Category: Commentary

  • Sterling Begins To Unwinds

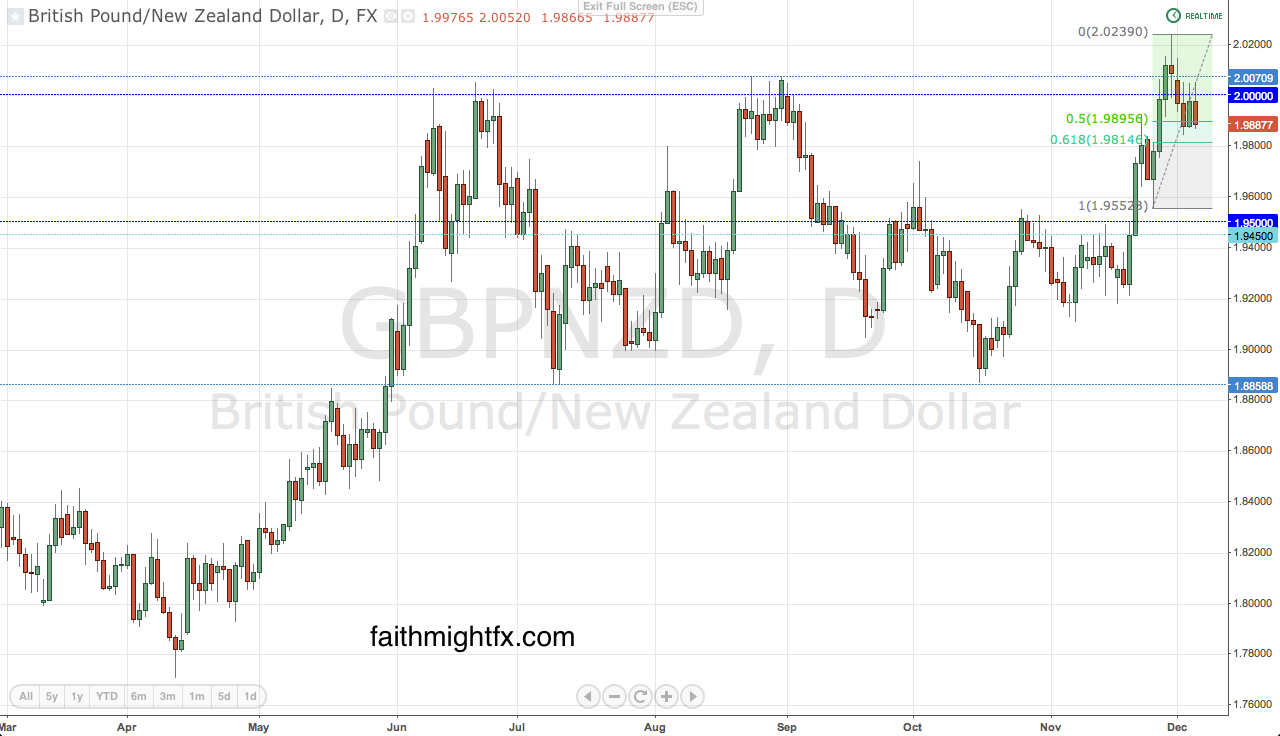
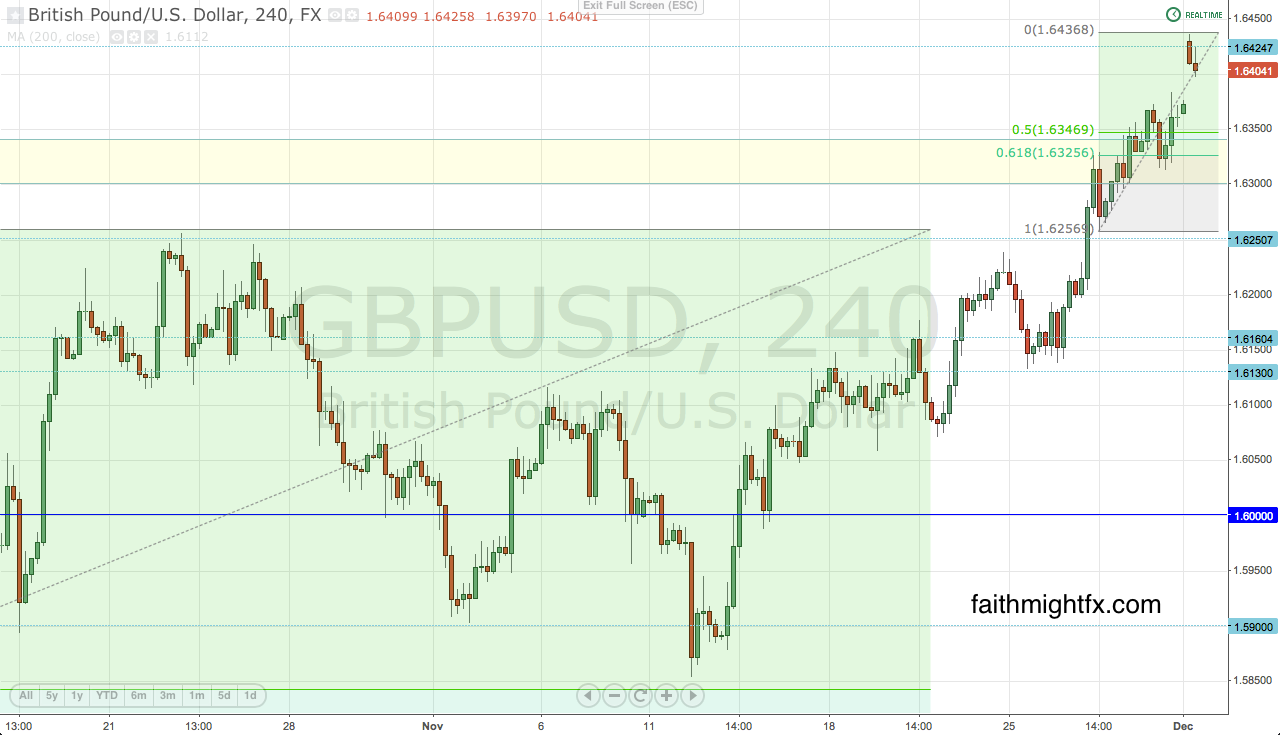
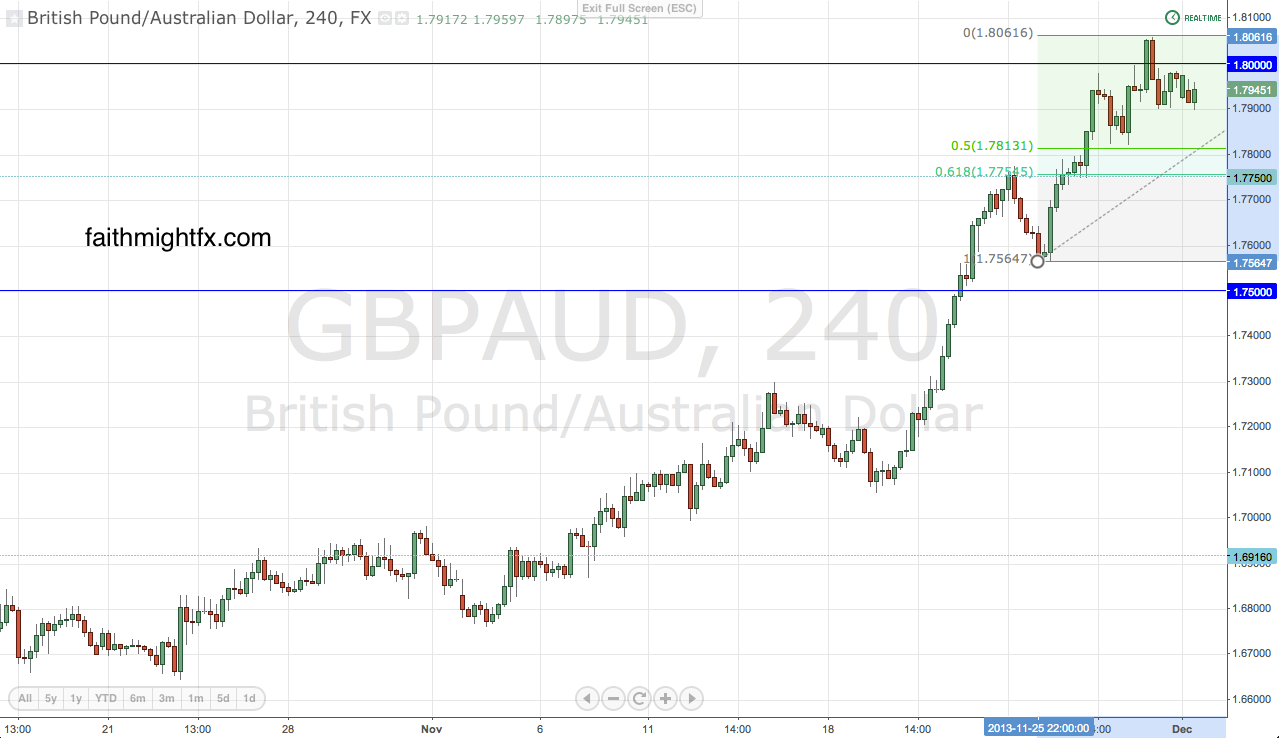
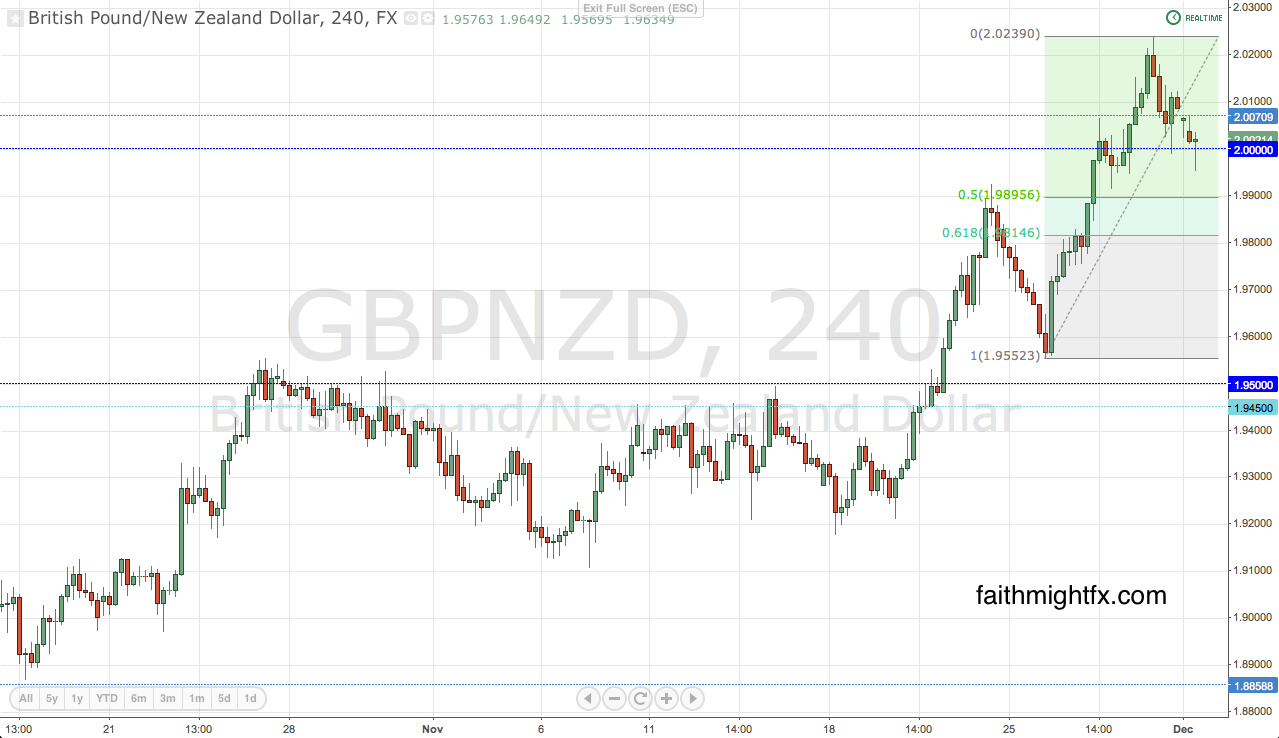
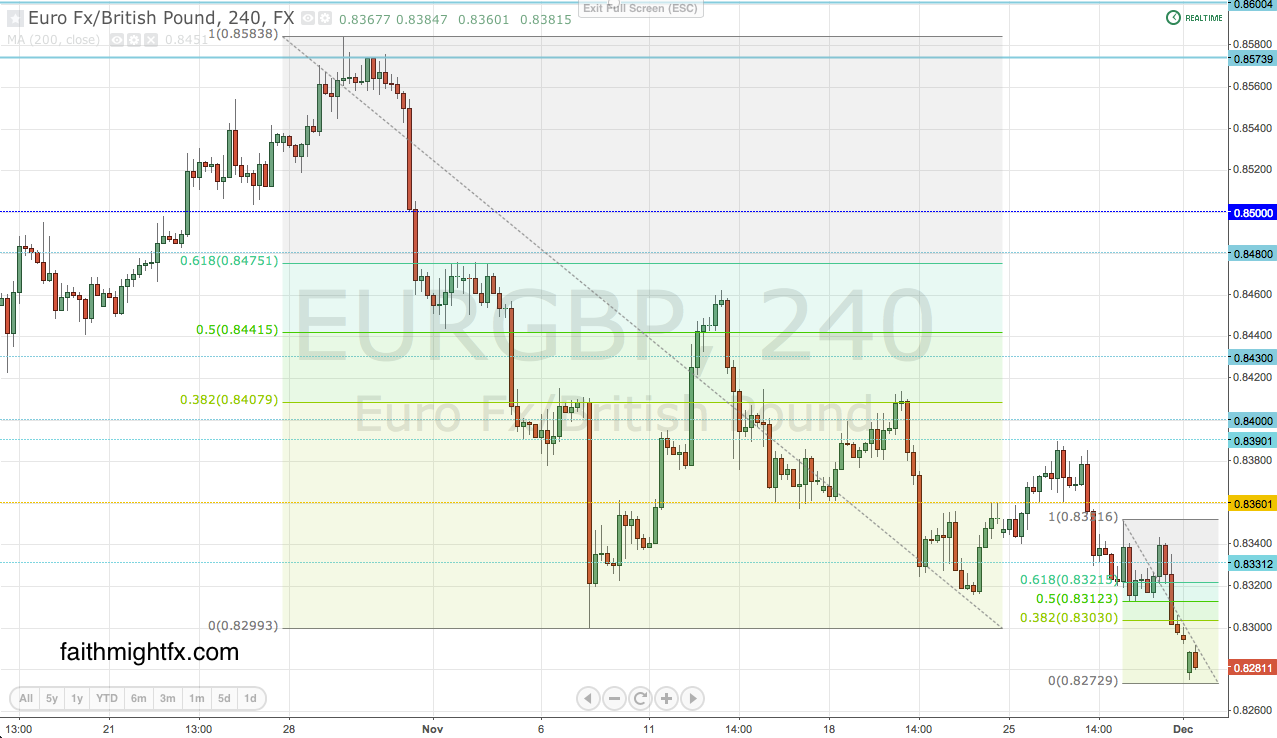
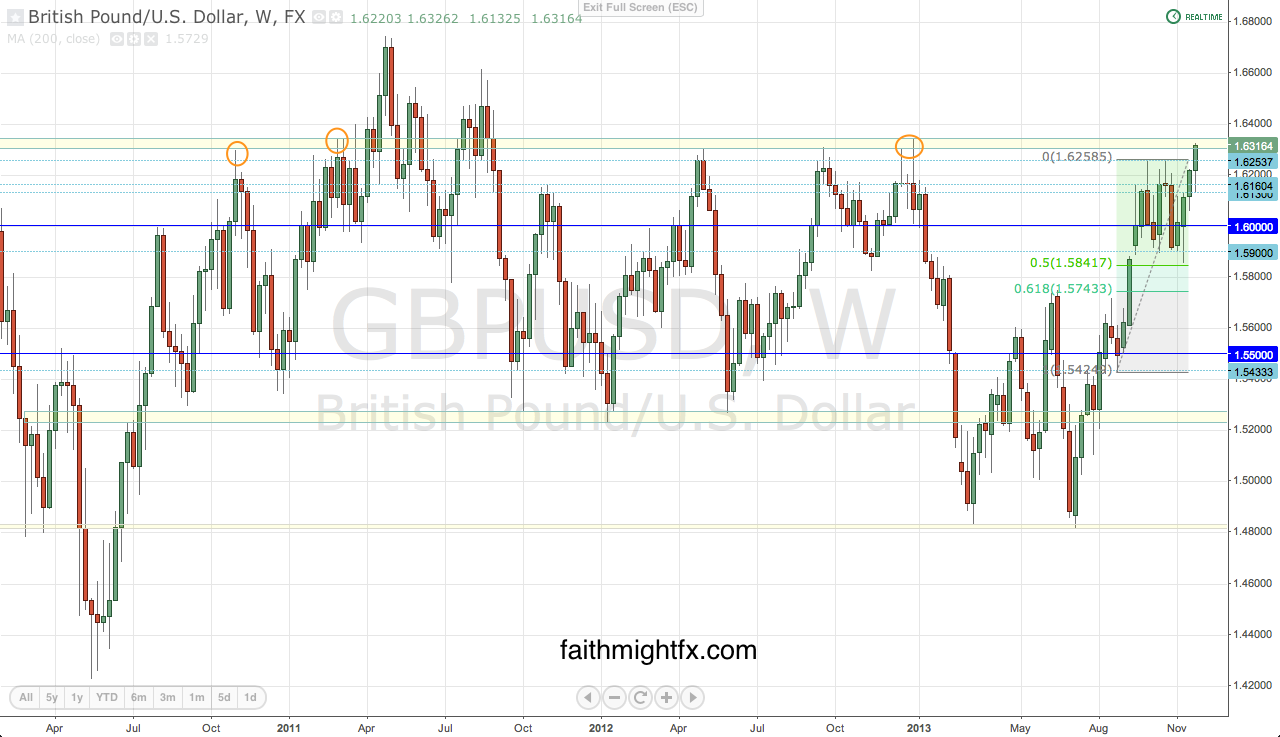
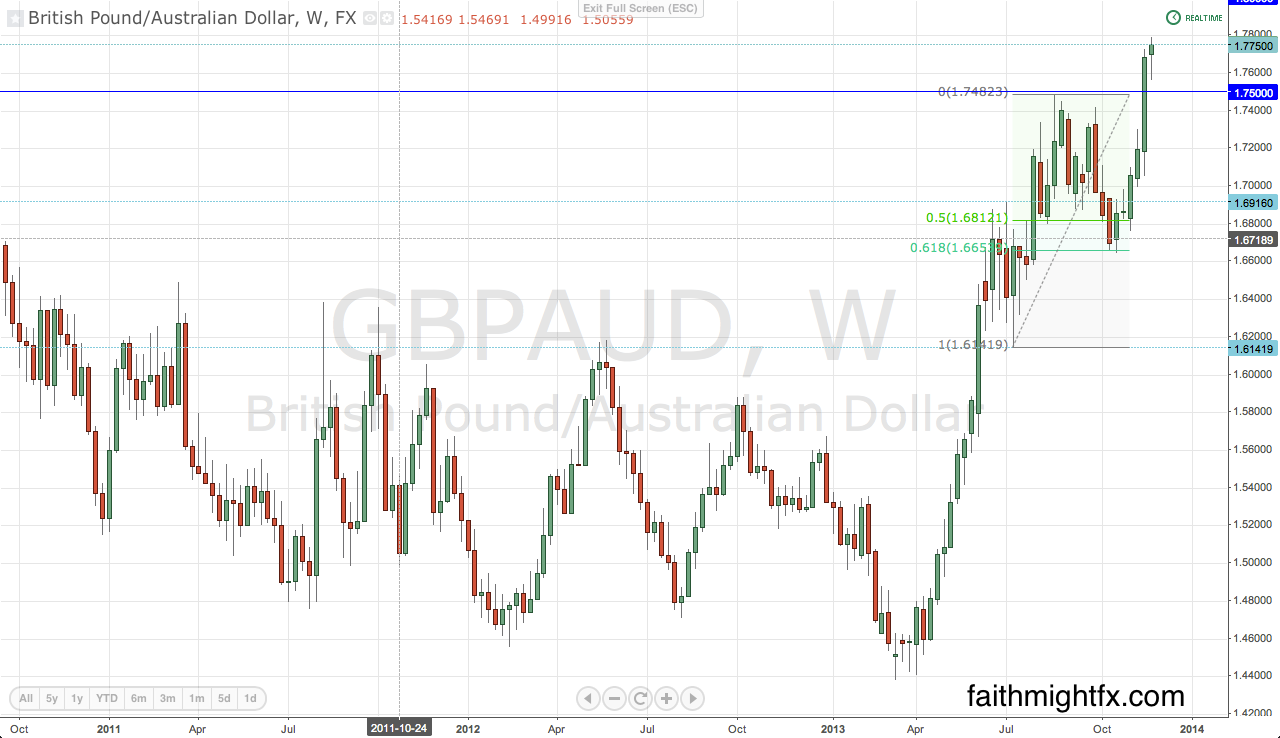
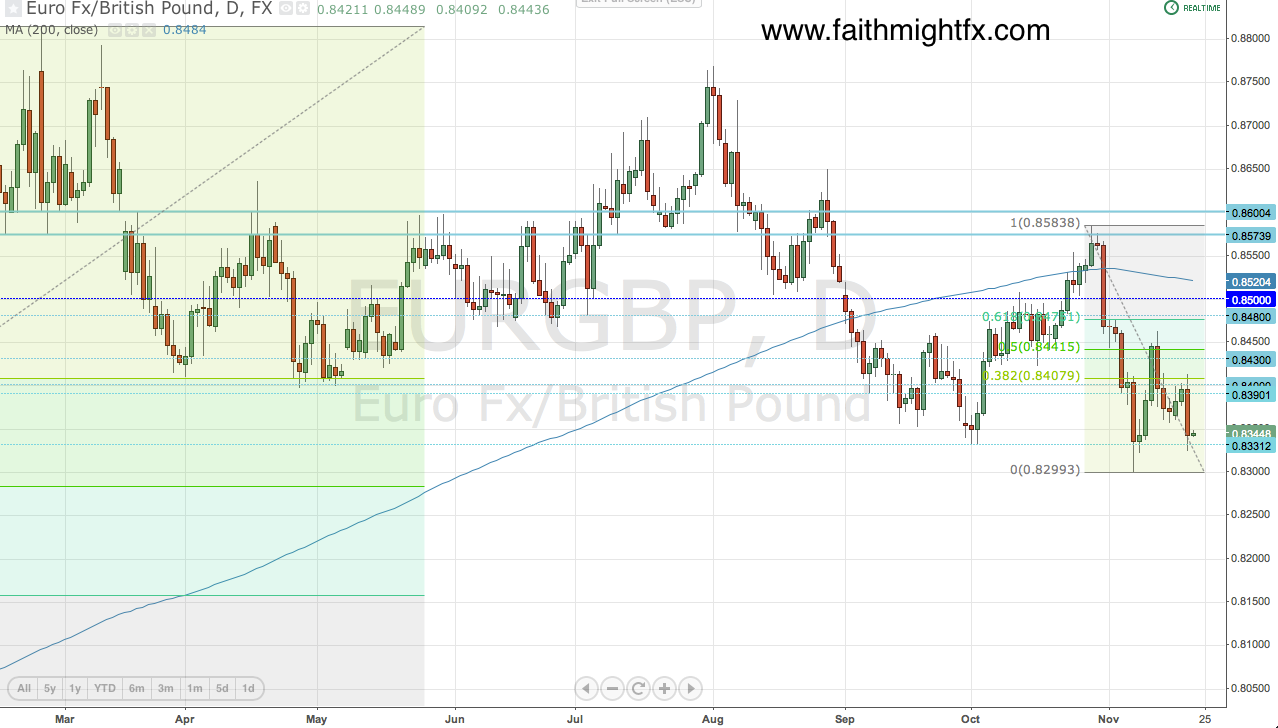
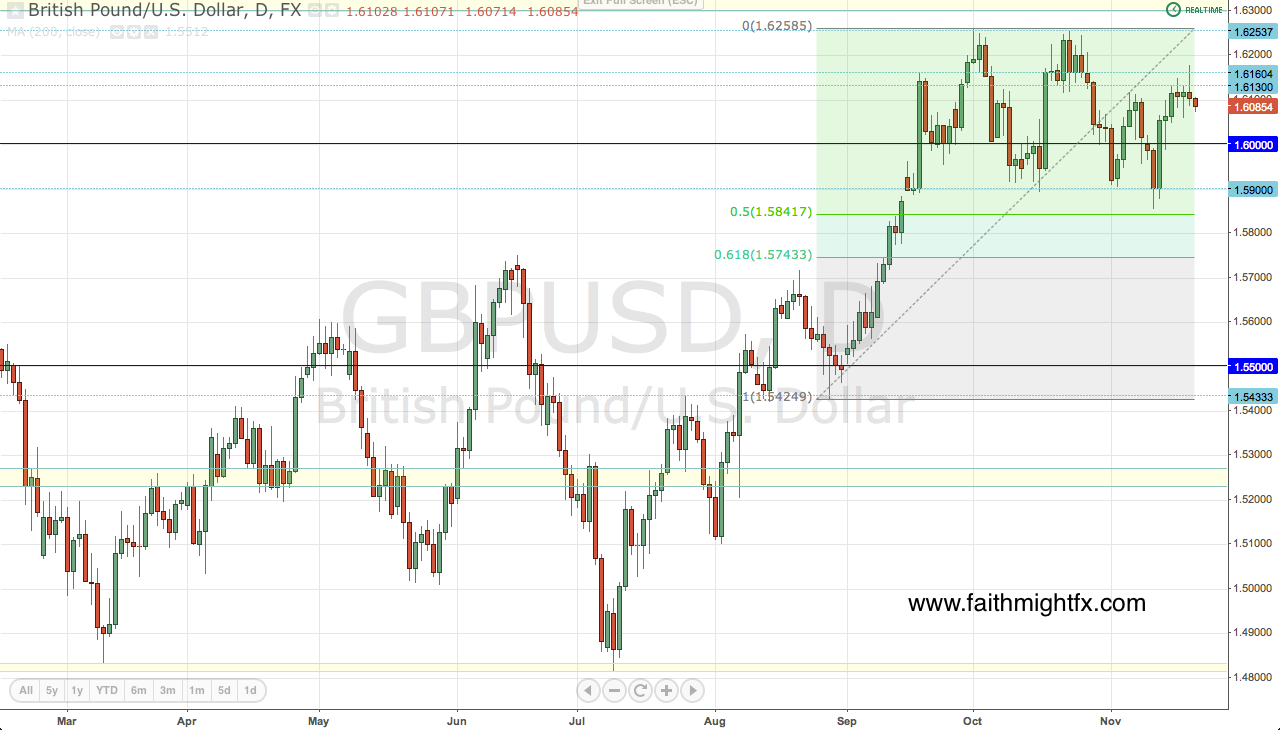
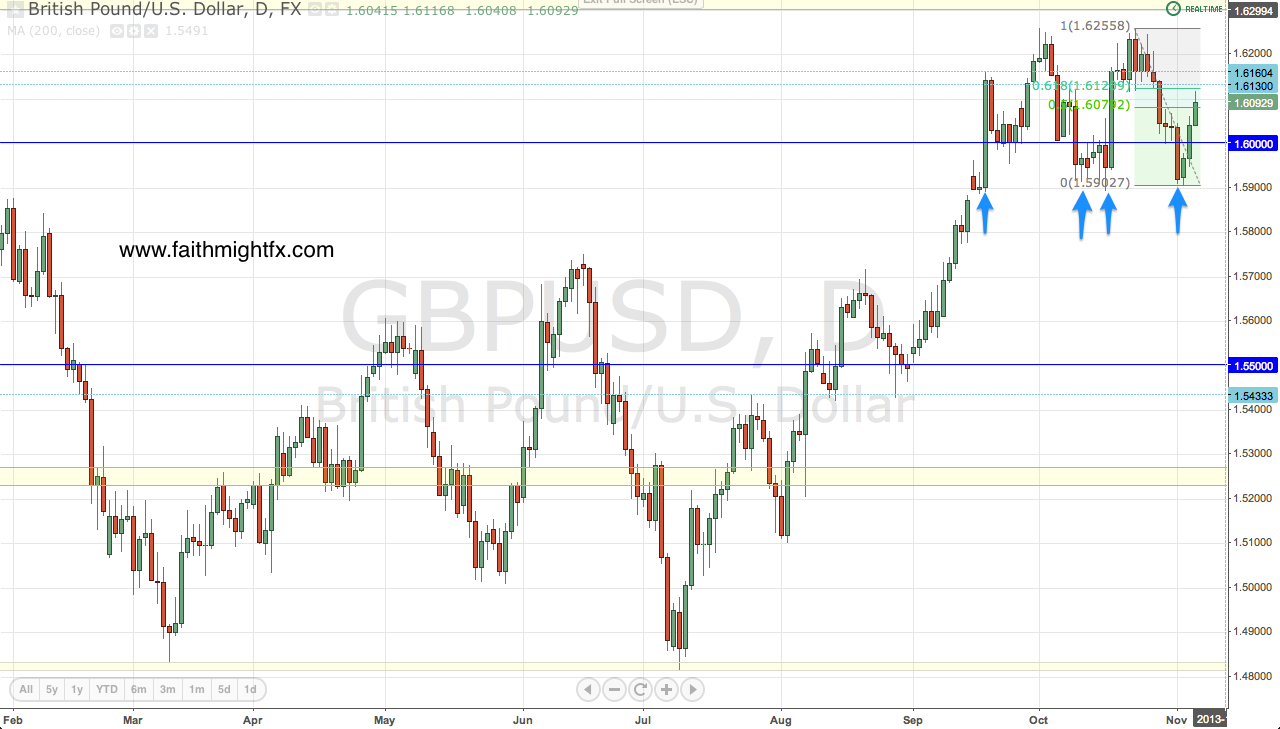
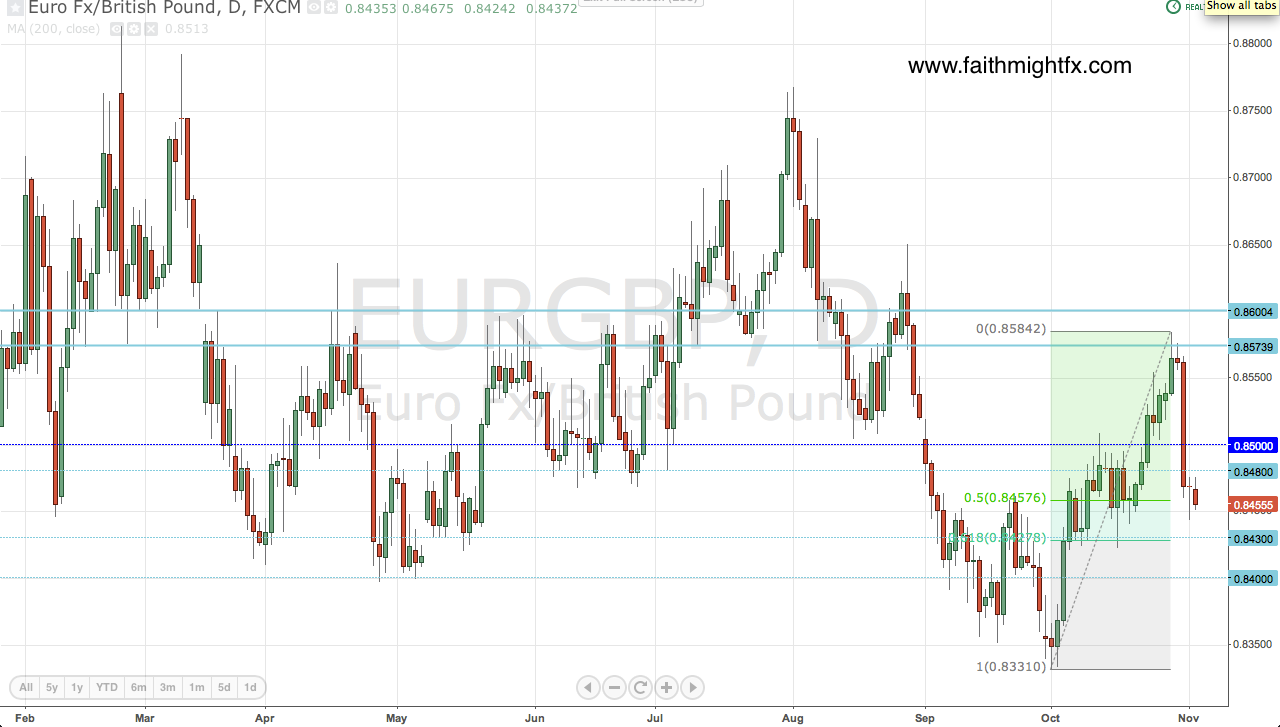
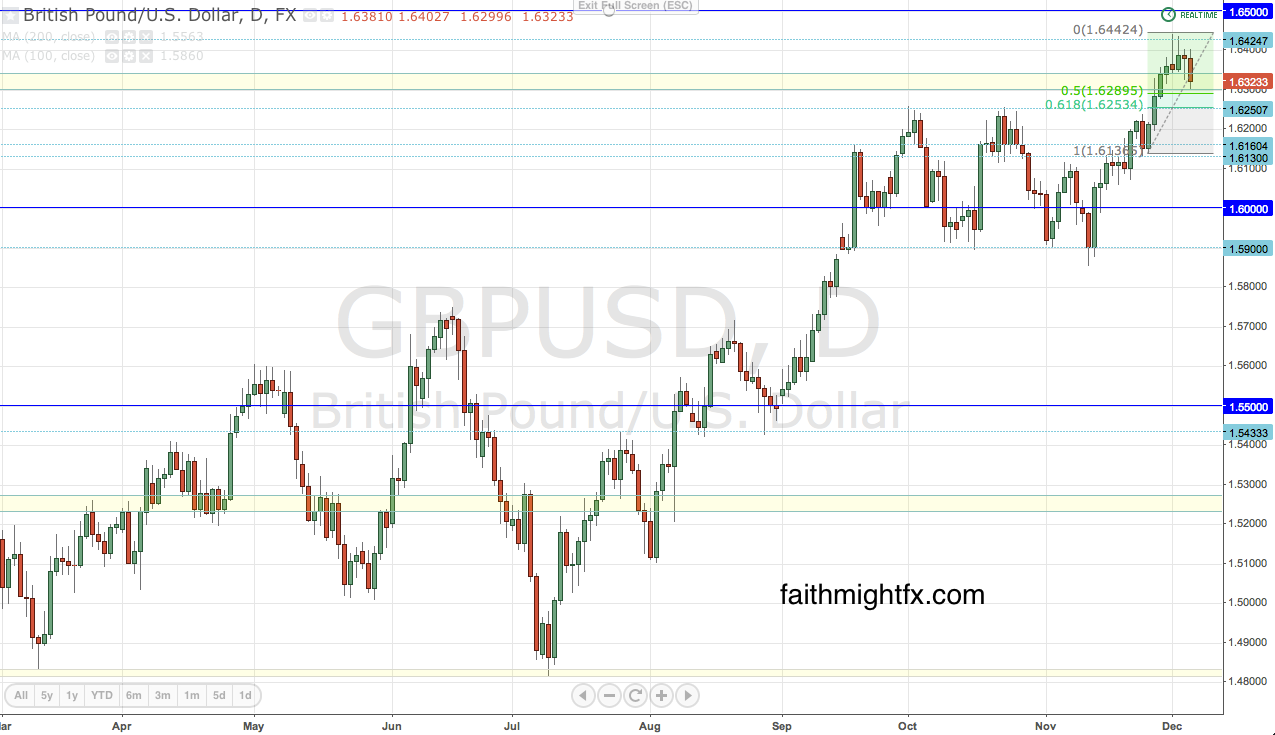
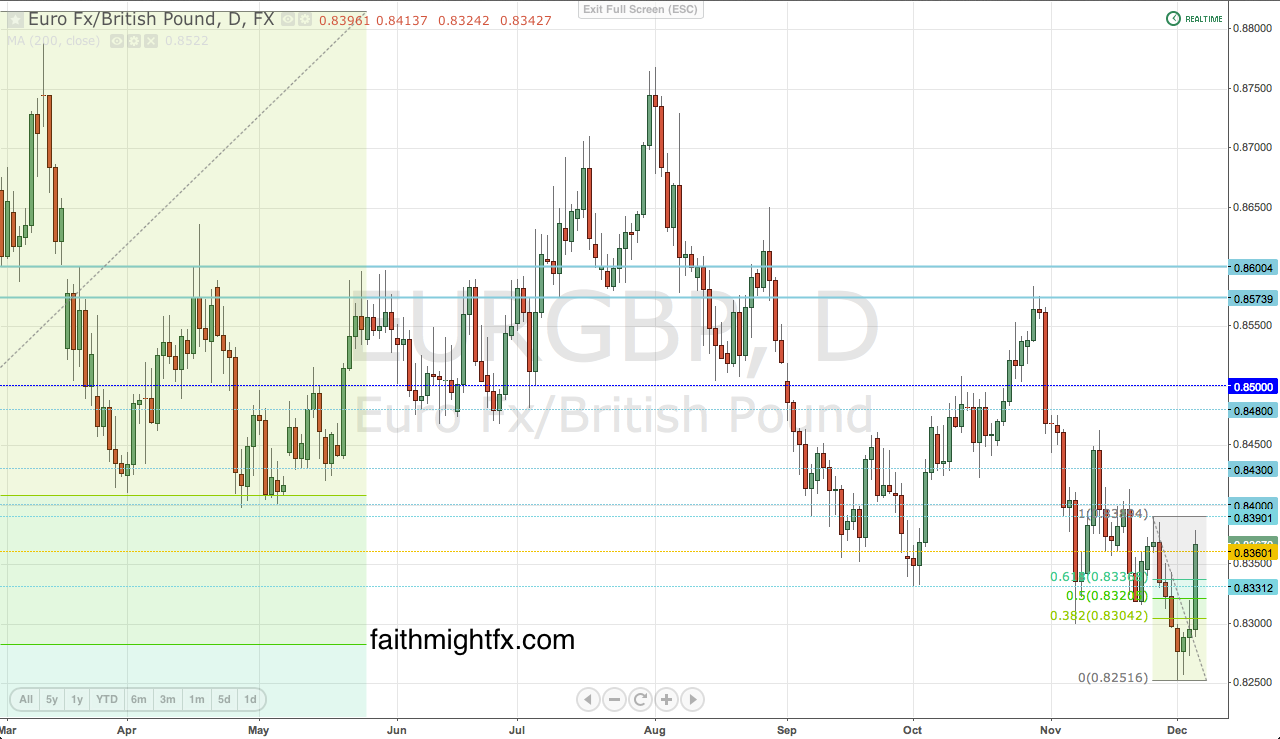
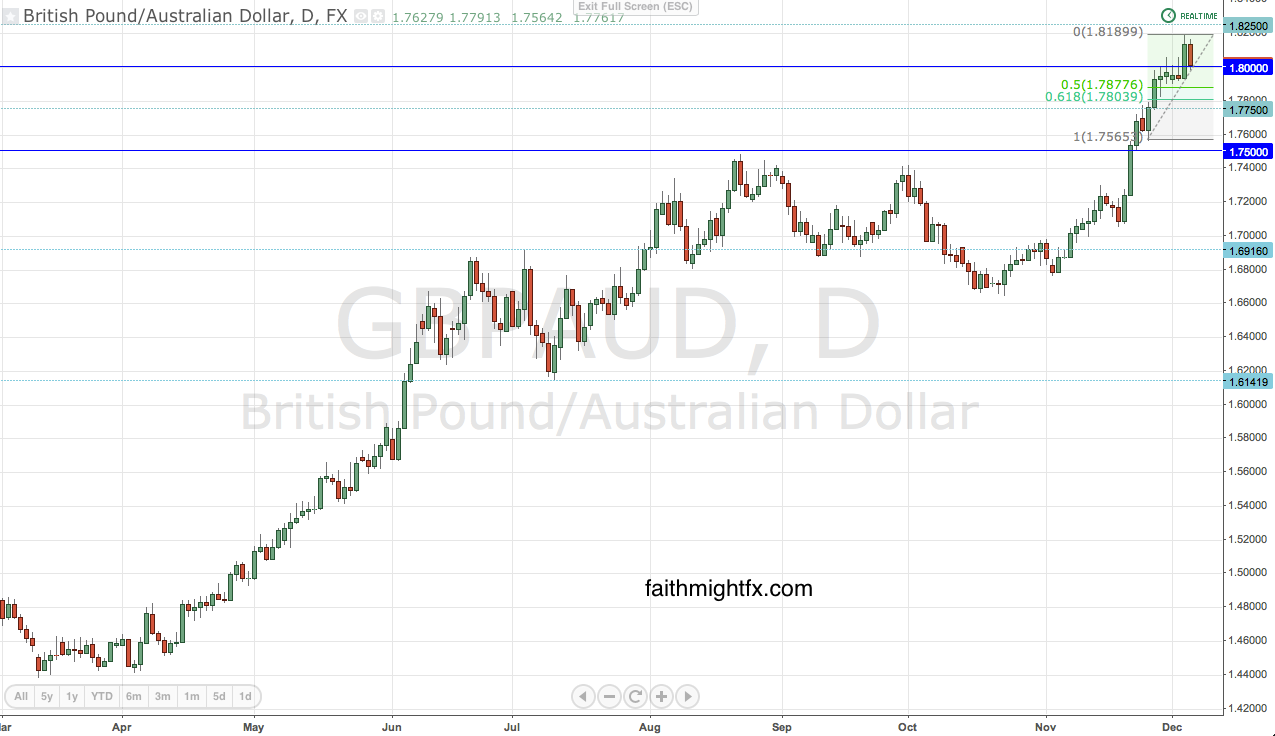
    At the beginning of the week, I put out some charts that I was watching on a correction. Corrections of last week’s rallies materialized and sterling put in even higher highs across the board: $EURGBP hit 0.8250, $GBPUSD hit 1.6450, $GBPAUD hit 1.8190, $GBPJPY hit 169.17, and $GBPNZD hit new highs last week at 2.0238. These are major levels not seen in 3+ years for some of these pairs. It seemed as if nothing could stop GBP bulls.

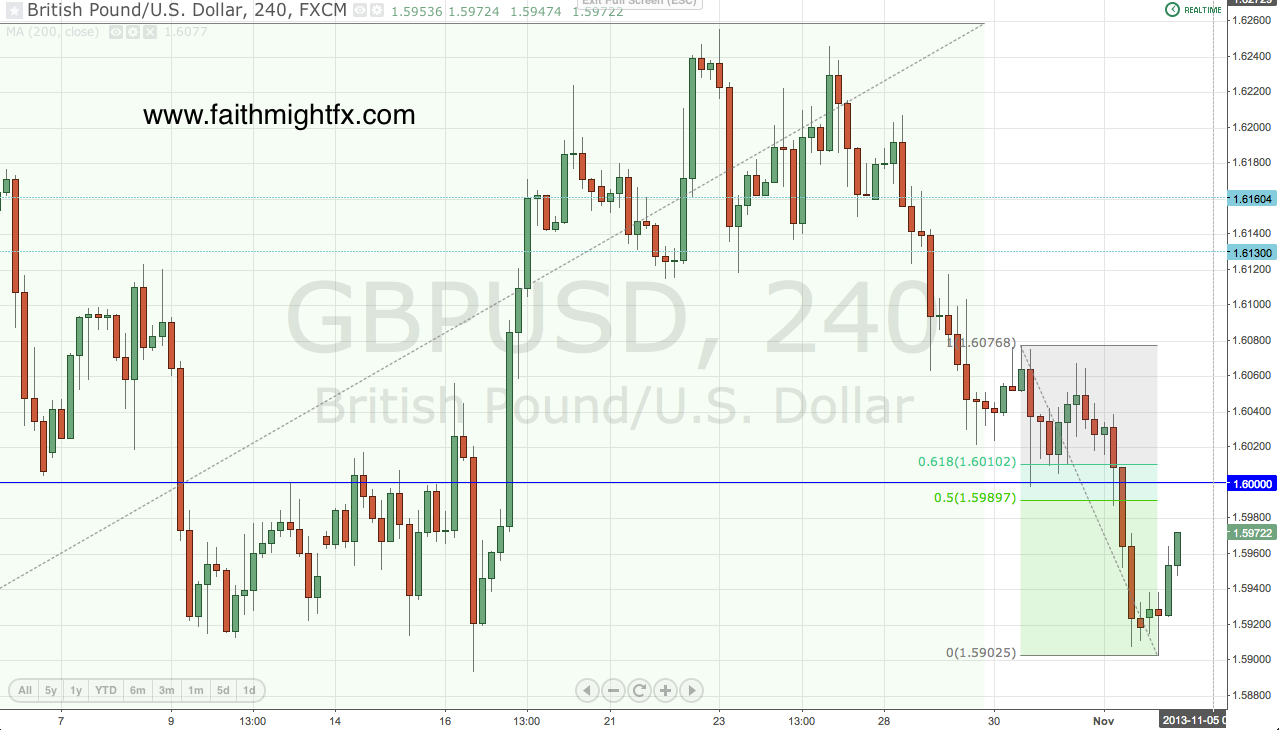
    Today, however, after monster rallies not just last week but for much of the 2nd half of 2013, it looks like sterling may be in for some major profit-taking. The Bank of England staying put on monetary policy again today gave buyers reason enough to begin booking profits. In fact, it would not surprise me if we saw these rallies start to put in major corrections in this last month of 2013.

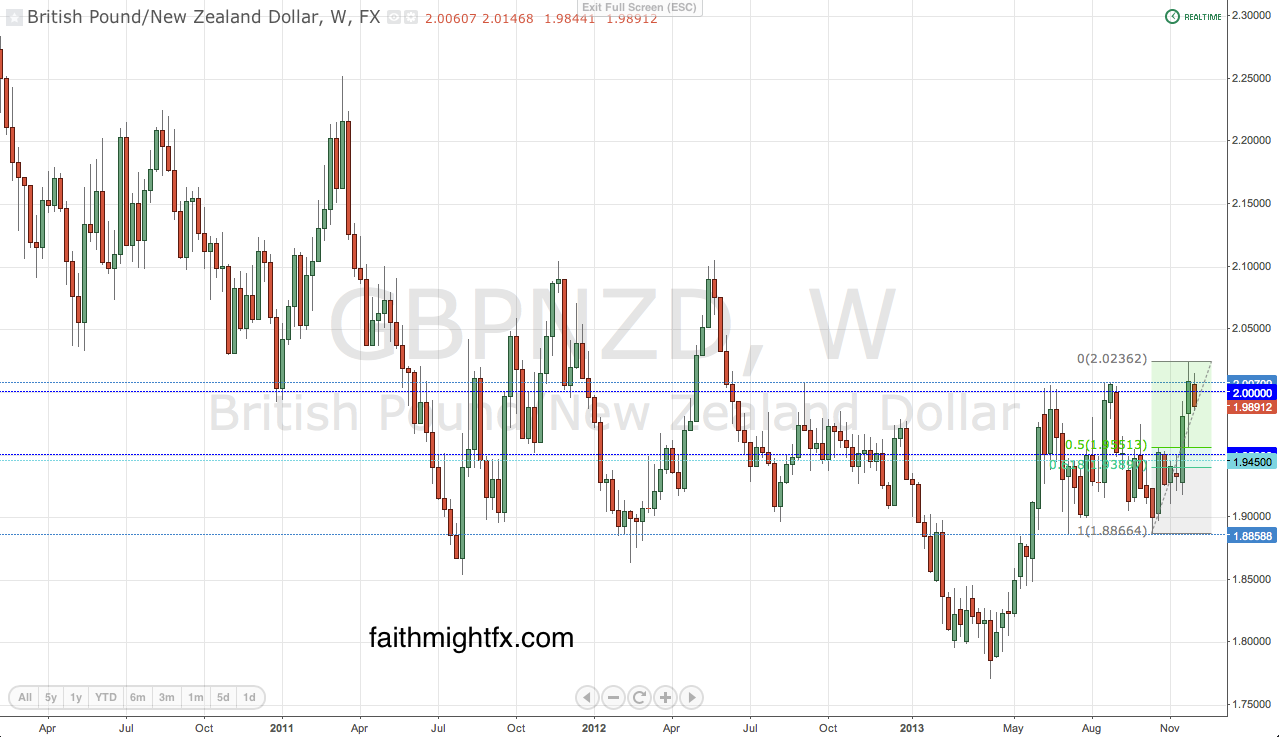
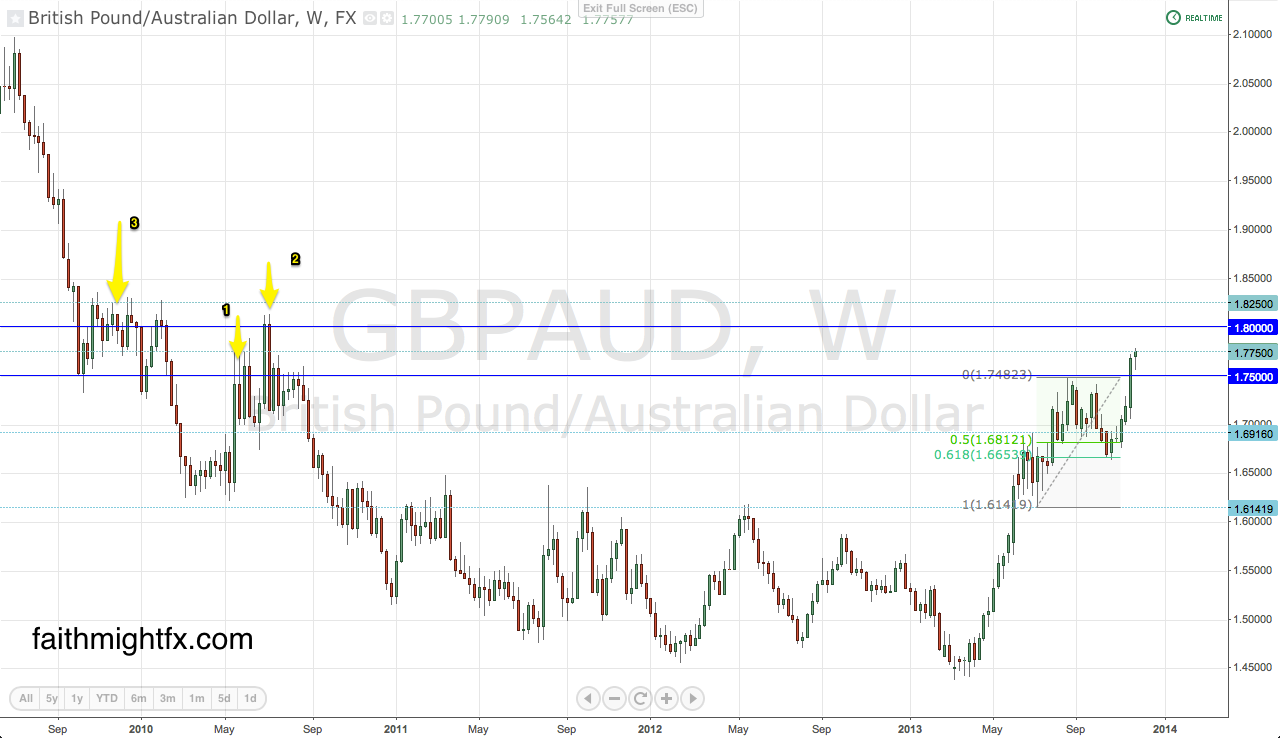
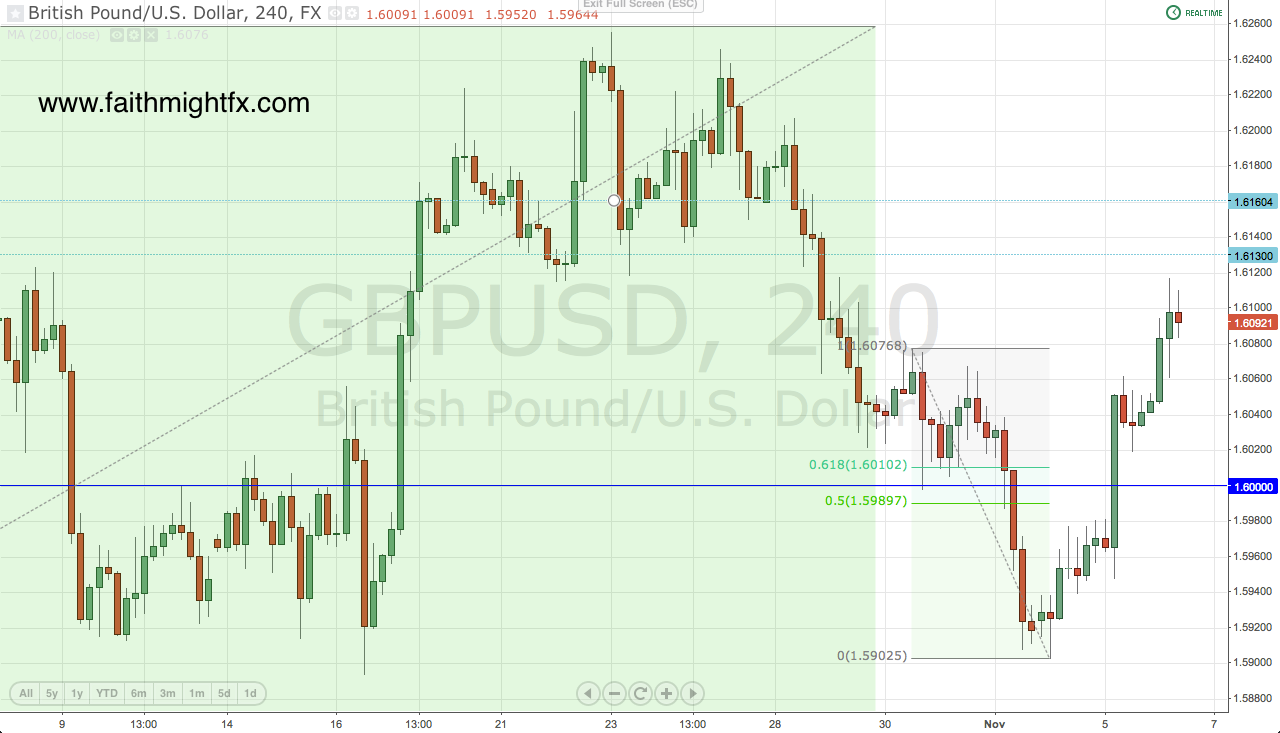
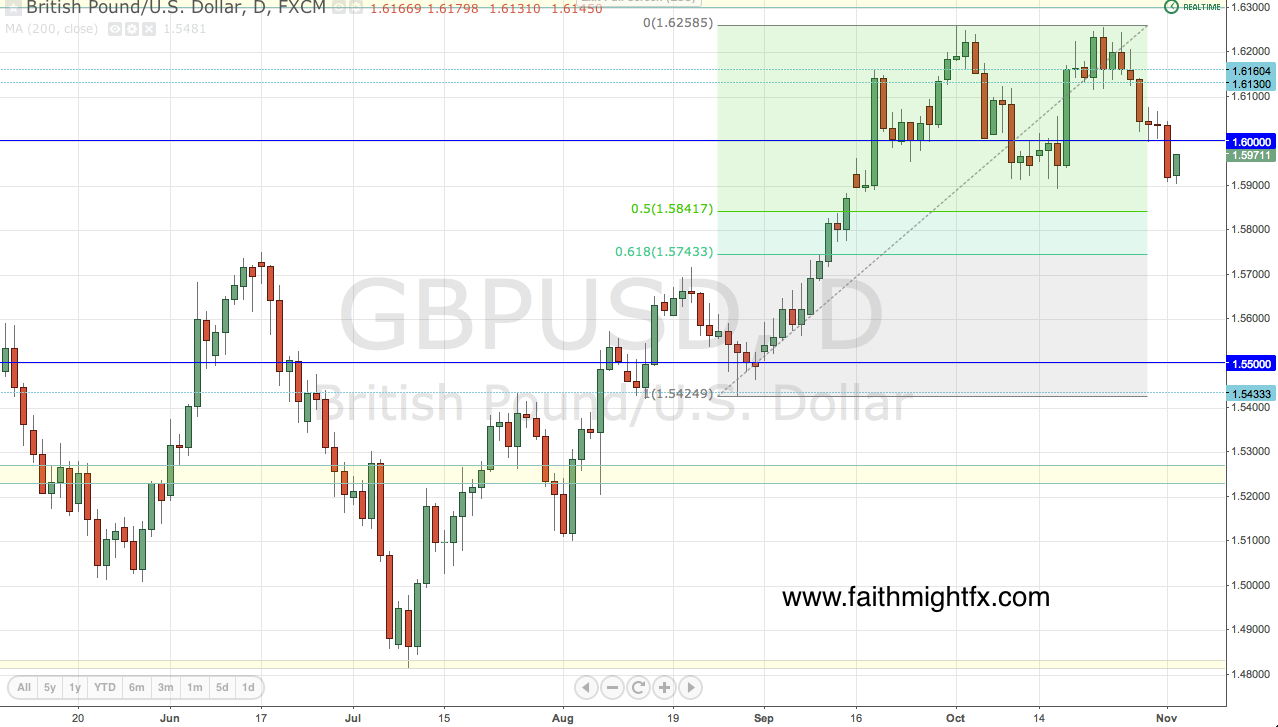
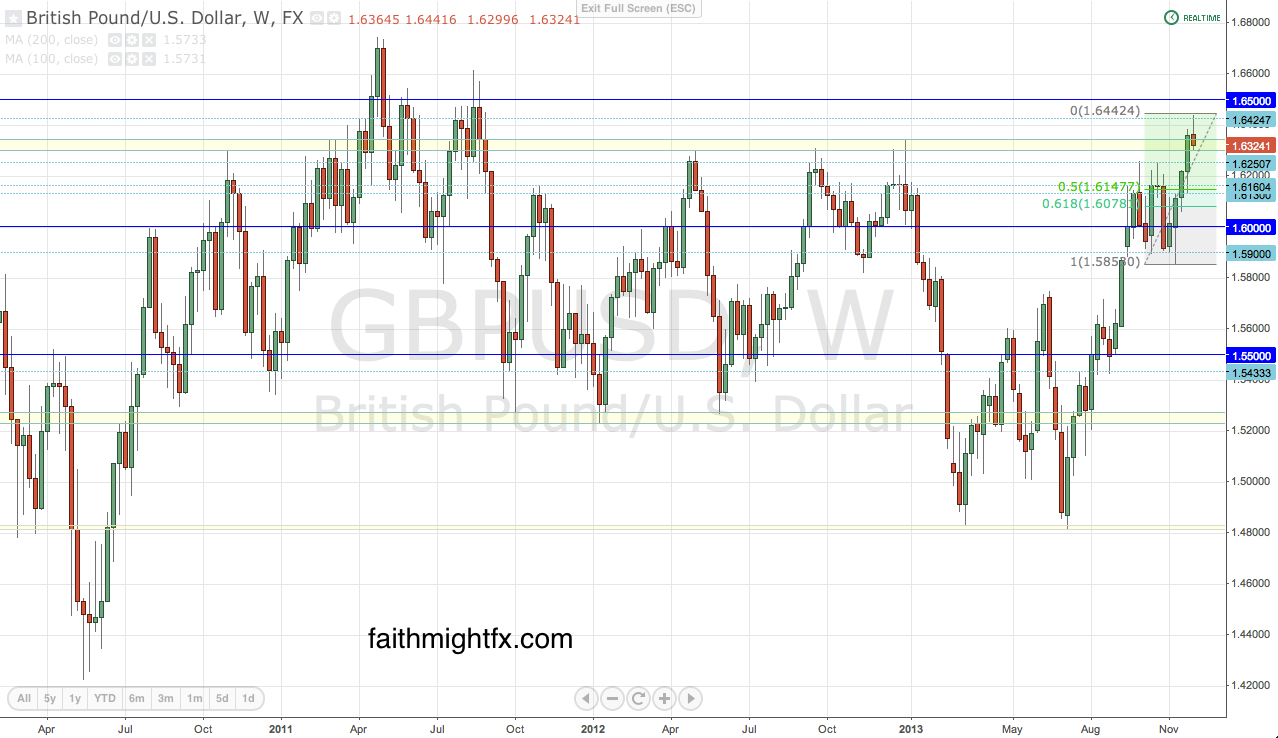
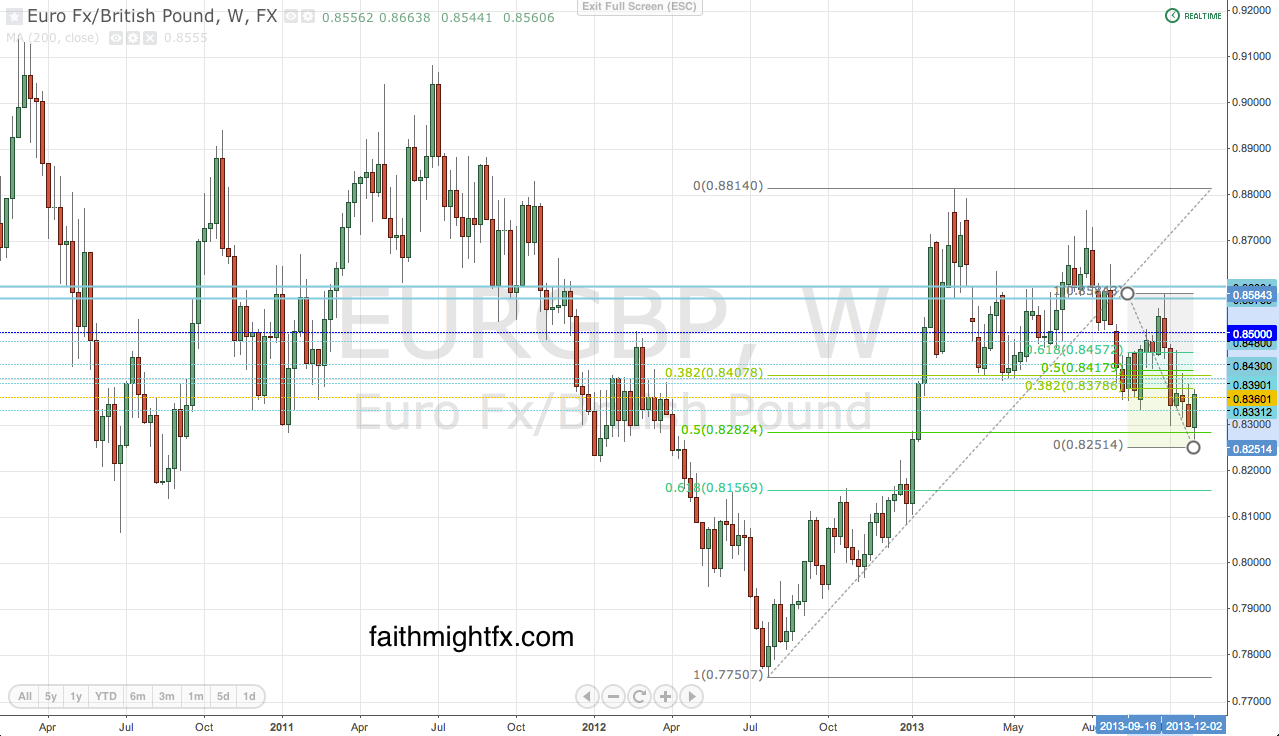
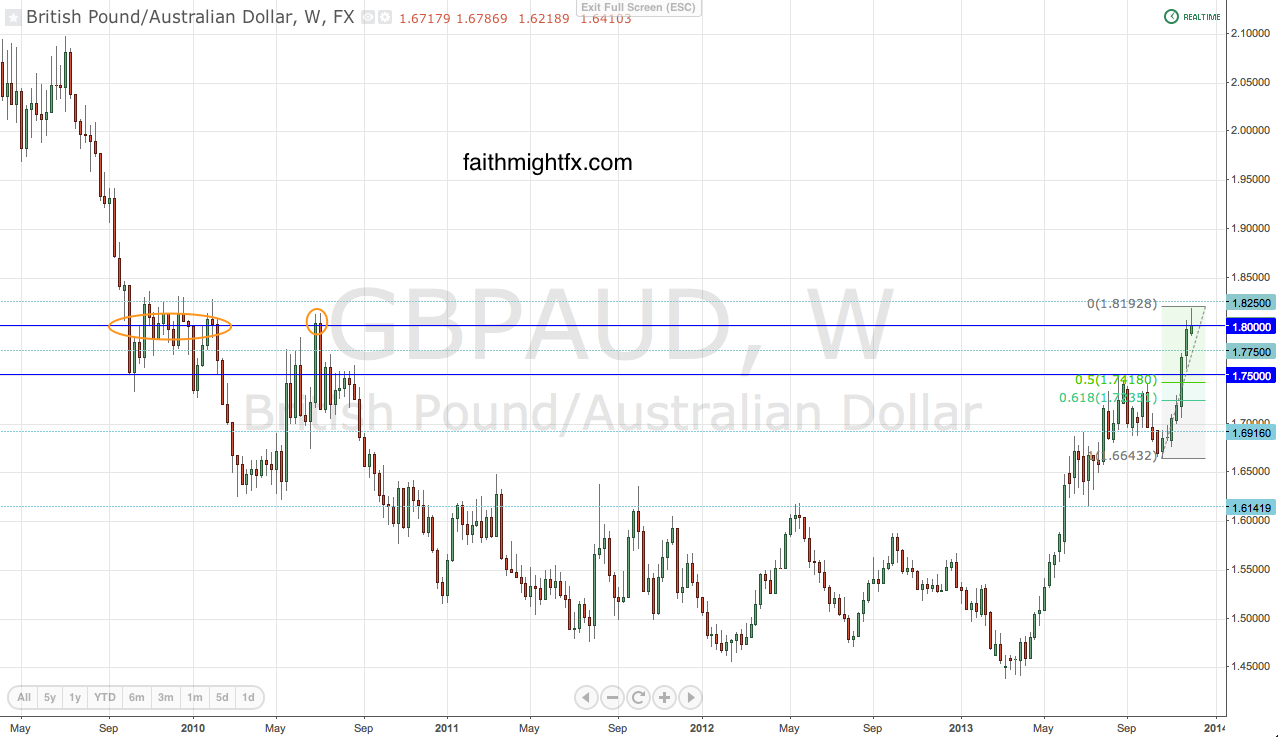
    If levels on the daily chart are broken, look to the weekly chart retracement levels. If we see price start to break the 61.8% Fibonacci level on the weekly charts, sterling could be looking at a reversal in 2014.

    $GBPUSD

     gbpusd daily chart

    gbpusd weekly chart

    $EURGBP

    eurgbp daily chart

    eurgbp weekly chart

    $GBPAUD

    GBPAUD DAILY CHART

    GBPAUD WEEKLY CHART

    $GBPNZD

    GBPNZD DAILY CHART

    GBPNZD WEEKLY CHART

  • New Week Possibilities

    After a strong week, it is not surprising to find sterling spending another Monday consolidating gains and pulling back off fresh new highs. If the trend continues in this new 1st week of a new month of trading, a correction of mostly last week’s rallies could provide opportunity for bulls. However, it also gives us levels to watch if the correction decides to turn into a deeper reversal.

    $GBPUSD

    GBPUSD 4 HOUR CHART

    $GBPAUD

    GBPAUD 4 HOUR CHART

    $GBPNZD

    GBPNZD 4 HOUR CHART

    $EURGBP

    EURGBP 4 HOUR CHART


  • Not Yet A Breakout

    $GBPUSD has finally hit 1.6300. After hitting resistance at 1.6250 for over 3 months and dropping to 1.5850, cable finally managed to hit the big psych level at 1.6300. I see many bears in the $GBPUSD stream at this price level. While a daily chart breakout is hardly a bearish event, check out the weekly chart. We’ve been here before…with no follow through.

    GBPUSD WEEKLY CHART

  • GBP/AUD Can Go Higher Still

    Sterling’s massive rally last week was led by the $GBPAUD which staged a breakout above the August consolidation highs just shy of 1.7500.

    GBPAUD WEEKLY CHART

    This breakout was launched the week the BoE and RBA made divergent comments on their respective monetary policies. That week price was struggling with 1.7000. Since then, price has rallied 800 pips. And given the new trends in global central bank policies, this trend could be just beginning. So how far can this trend really run?

    Looking further out on the weekly chart, price trades very bullish above 1.7500 with 3 levels clearly on the radar to the upside: 1.7750, 1.8000, and 1.8250. With 1.7500 as clear support (evident on this week’s early dip that only went as low as 1.7570), $GBPAUD has more room to run higher.

    GBPAUD WEEKLY CHART

    Read also: Central Bank Divergence (FMFX)

  • Central Bank Divergence

    ECB cutting rates this month was an aggressive move when most central banks have taken to jawboning under the guise of forward guidance. Action by the ECB definitely puts it squarely in dovish camp and the leader of the pack.The ECB and the RBA are firmly dovish having both cut interest rates already this year and keeping the door to accommodation open. The RBNZ and BoJ are biased dovish preferring to talk down it’s currency rather than take real action. The BoE and BoC are biased hawkish as they awaits for its recovering economies to, well, recover. The $FED, however, leads the hawks with a broken taper promise. However, the chairman-elect may move the $FED away from the edge and back to loving embrace of the doves. LOL. Time will tell.

    The Bank of England has been a big game changer for sterling since Carney has taken the helm. I think the market always knew he would bring change to the BoE. However, I believe the market believed Carney would be bearish for sterling. But the markets have perceived the BoE to be hawkish for quite some time thanks, in large part, to UK economic data that have  been surprisingly sustainable and robust since the summer. Once Carney set forward guidance in August, the data has kept the BoE on hold with monetary policy. This month, Carney has been outright hawkish in his delivery of the inflation report and following television debut. You have to wonder at his cleverness since those dovish comments as Governor-elect over a year ago.

    But you have to love this new landscape. These divergences are what trends are made of! With the end of 2013 fast approaching, we could see these divergences manifest in new trends as holiday volatility increases in the markets. Already we see a massive breakout in the $GBPAUD and EURGBP as these pairs best reflect these central bank divergences. $GBPUSD is a battle of the hawks as moves remain rangebound. Watch how other pairs act as the divergences in central banks become more apparent.

    EURGBP DAILY CHART GBPAUD DAILY CHART GBPUSD DAILY CHART

    Read also:


  • GBP/USD Stays Resilient

    With cable starting the week below the huge psychological level at 1.6000, it seemed the currency pair was finally gathering steam to make a real break lower to 1.5850. However, 1.5900 remained staunch support and stronger-than-expected UK data has launched the $GBPUSD back above 1.60.

    GBPUSD 4 hour chart

    After moving above 1.60 AND holding the 1.6020 level yesterday, $GBPUSD started to look quite bullish. Back in October, a similar move was met with new highs some weeks later. It seems we may have the same price action again in November. Since holding above 1.6020 yesterday, $GBPUSD has made a seriously bullish move to make highs so far at 1.6117. However, there is plenty of resistance above the week’s new highs.

    GBPUSD daily chart

    Price has been capped by the 61.8% Fibonacci level with 1.6130 and 16160 resistance levels not too far above that. As long as price remains above 1.59 support and 1.60 psychological level, $GBPUSD has the potential to return to 1.6250 resistance and make a real effort to 1.6300. Another interesting observation is that $GBPUSD has yet to turn bearish even with a daily or weekly close below 1.60. Each time is seems as though the USD will gather momentum, GBP bulls have proven more resilient. Will the bulls finally muster the strength needed to take out the 1.63 highs?

  • EUR/GBP Breaks Down

    Last week, the $EURGBP rallied right into the infamous sell zone between 0.8570 and 0.8600. And true to form, that zone held and the $EURGBP broke down last week right to the 50% Fibonacci level of the entire rally.

    EURGBP DAILY CHART

    Being that price is bouncing along the 50% Fibonacci level to open the new week, it seems as though a corrective rally may be in the works. However, given the velocity of the euro’s weakness in the past 2 trading sessions, a rally could be very shallow. I favor a continued move into 0.8430 where the real line in the sand for bears lies. This previous support level also coincides with the 61.8% Fibonacci level making this the level to watch in trading this week. Above current price action is resistance between 0.8480 and the big psychological level at 0.8500. It would take a break below 0.84 or above 0.85 to see momentum in price action. Until then, expect price action to be choppy between these levels and dictated by data releases this week.

    Last week the ECB pulled the rug out from euro bulls. While they maintained monetary policy, dovish comments from ECB members sent the euro swooning. The fundamental landscape remains positive for GBP. UK economic data is robust into the fall season proving to bulls that the summer recovery may actually have legs. After a quiet couple weeks, we get a slew UK data this week plus an interest rate decision from the Bank of England. While the market expects the BoE to remain on hold with monetary policy, data this week may cast the central bank in a hawkish light. Price moves will be sensitive to data releases into Thursday’s rate decision. Be mindful of the calendar and key levels this week.

  • GBP/USD Still In Range

    For several weeks now, the $GBPUSD has been trying to either retrace to the 50% Fibonacci at 1.5850 or break out higher above 1.6250. Neither has happened as last week 1.6250 resistance capped any rallies and the 1.5900 support level that has emerged in recent weeks has buoyed dips.

    GBPUSD DAILY CHART
    the big picture

    This week opens with $GBPUSD again at 1.59 support unable to continue lower. Thanks to the better-than-expected manufacturing PMI release, this corrective rally should find resistance into 1.60 if price is to move lower and finally break the 1.59 support level.

    GBPUSD 4 HOUR CHART

    The fundamental landscape remains positive for GBP. UK economic data is robust into the fall season proving to bulls that the summer recovery may actually have legs. After a quiet couple weeks, we get a slew UK data this week plus an interest rate decision from the Bank of England. While the market expects the BoE to remain on hold with monetary policy, data this week may cast the central bank in a hawkish light. Price moves will be sensitive to data releases into Thursday’s rate decision. Be mindful of the calendar and key levels this week.

  • What Are The Markets Whispering for 2014?

    I see 3 major trends for the markets next year in 2014:

    1. Investing in Africa only accelerates
    2. $GBPUSD enters 2014 at the bottom of its 5-year consolidation pattern (strong USD)
    3. The rise of women in finance

    Last Thursday, at Stocktoberfest, I presented 2 of the 3 ideas on a panel with Howard Lindzon, Chairman, StockTwits, Christopher Perruna, Director of Project Management at Gardiner & Capital Theobald, Greg Harmon, DragonFly Capital, Cole Wilcox, CEO Longboard Asset Management, and Mike Bellafiore, SMB Capital. Here is my presentation:


    (Infographics credit)

  • The Rise of Women in Finance

    Enacted in August by India’s parliament, the Companies Act requires every listed company to have at least one female director within a year, while others reporting minimum revenue of 3 billion rupees ($49 million) have three years to comply.

    Almost half of the top 100 companies traded on BSE Ltd., including the biggest two by market value, don’t have a single female member, according to data compiled by Bloomberg. As many as 6,000 women directors will be needed as firms look to fill the seats…

    Just off the heels of Stocktoberfest where we heard about the rise of women in finance from DailyWorth’s Amanda Steinburg, Bloomberg breaks news of the Bombay Stock Exchange Companies Act. What excellent timing.

    Read more: Women Sought on Boards as Stiletto Groups Grow: Corporate India (Bloomberg)