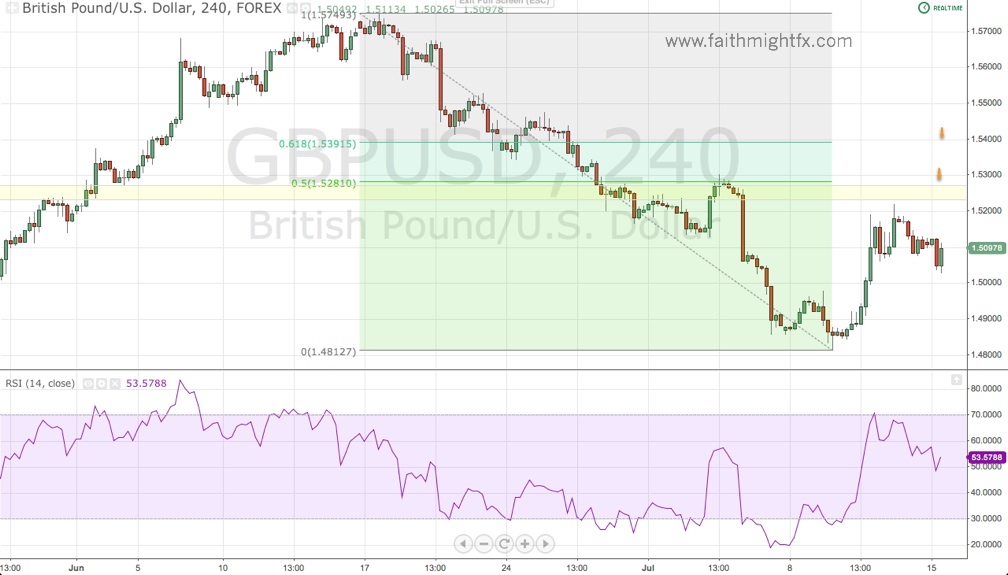
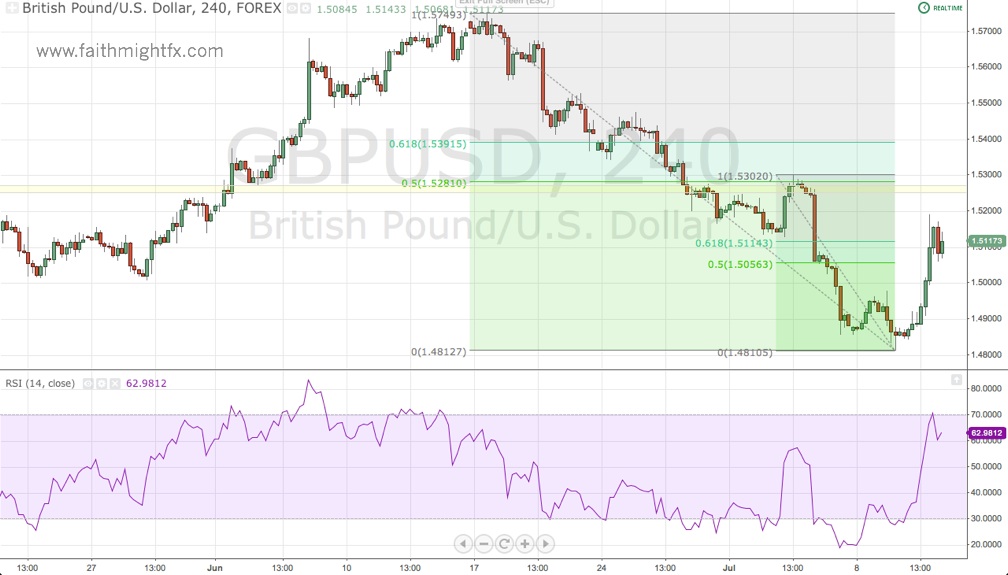
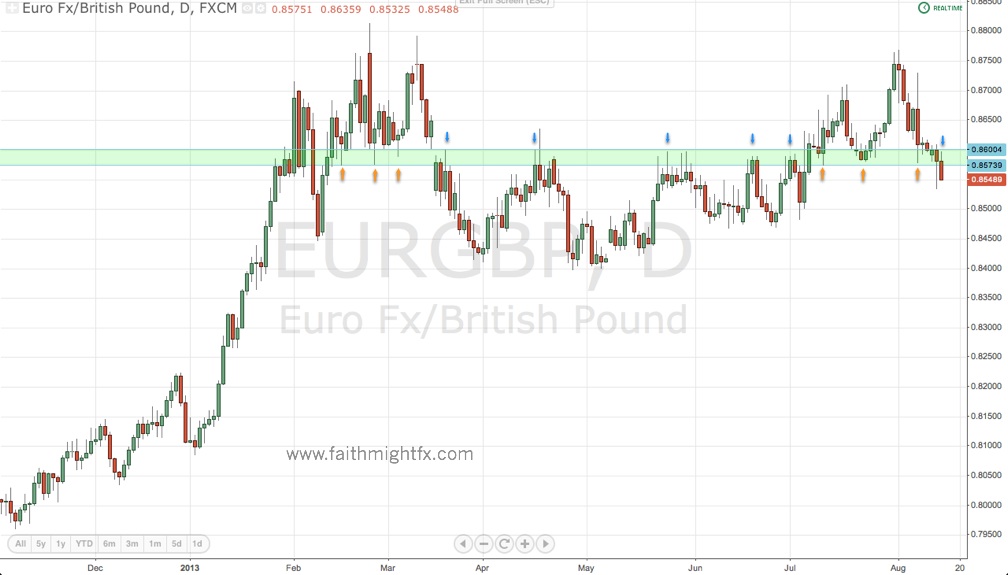
Yesterday, the sterling market experienced a flash rally where an “erroneous” order was filled to buy yards of GBP versus EUR. This sent $EURGBP crashing down to a low of 0.8535 and the other GBP crosses spiked higher. Despite this fat finger, $EURGBP broke a huge level for the pair at 0.8570.
As mentioned over 3 weeks ago,
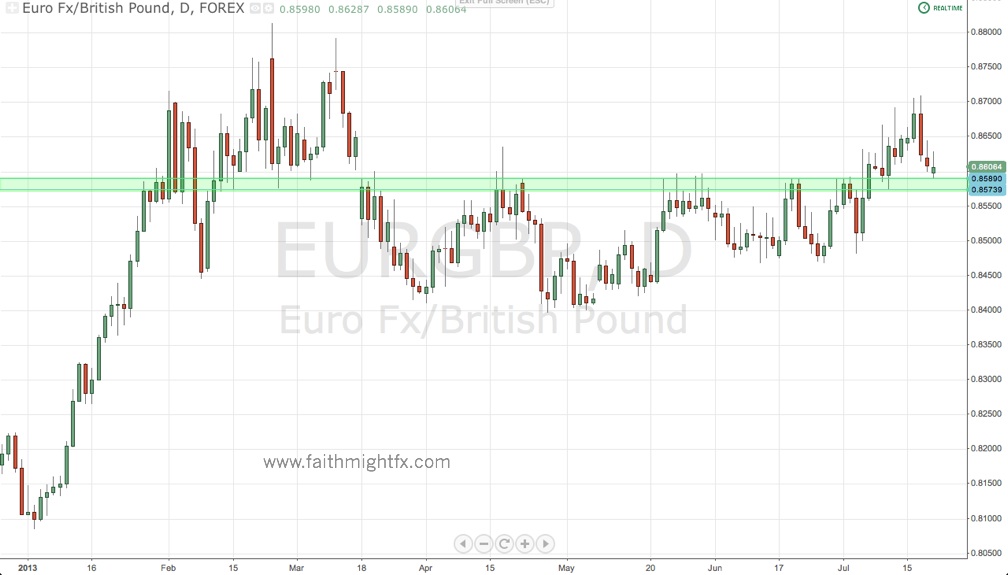
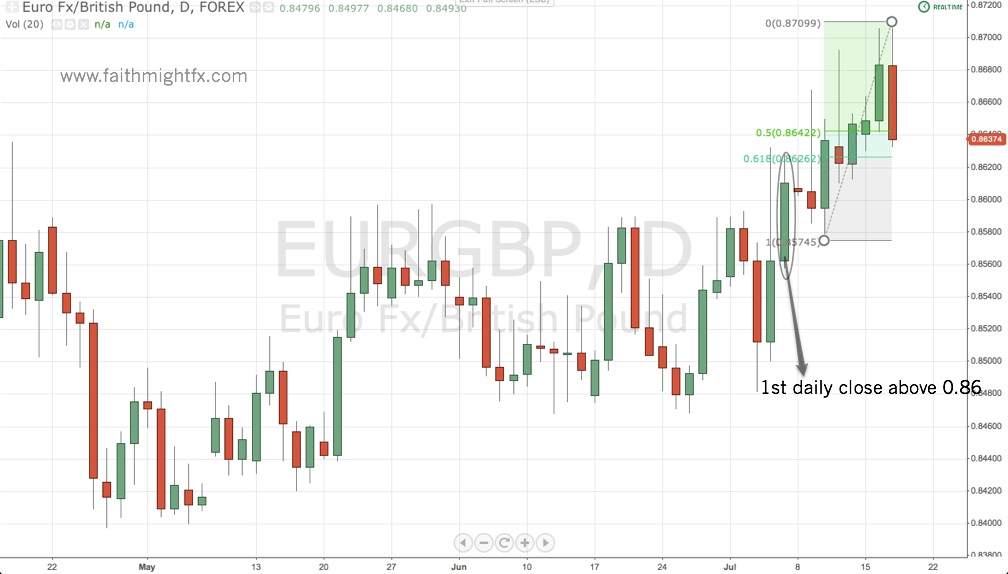
Of particular interest is this zone between 0.8600 and 0.8570. It has been a buy zone when $EURGBP has traded above it and a sell zone when the pair has traded below.
When we traded below the zone yesterday on the spike lower, this zone changed from a buy zone to a sell zone.
$EURGBP squeezing higher. I suspect swing shorts are setting up here right into 0.8610
— Lydia Idem Finkley (@faithmight) August 13, 2013
True to the zone, price was capped by the 0.8600 level with a high today of 0.8598 off yesterday’s 0.8535 lows. We now have follow through to the downside with $EURGBP trading at 0.8545 (as of this writing) and looking to move lower. Expect any rallies back into the zone to be met by offers unless price manages to close back above 0.8600.
Trade what you see.
Mentioned above:
- Decision Time for EUR/GBP (FMFX)
- ForexLive Americas wrap: EUR/GBP stops send a shudder through the market (ForexLive)