Since December 2020, EURUSD has been on a bearish trend. Each time the pair tries to gather momentum in the upward direction, the bears counteract the movement and the price heads back downwards. Since Q4 2020, $EURUSD has lost over 1900 pips.
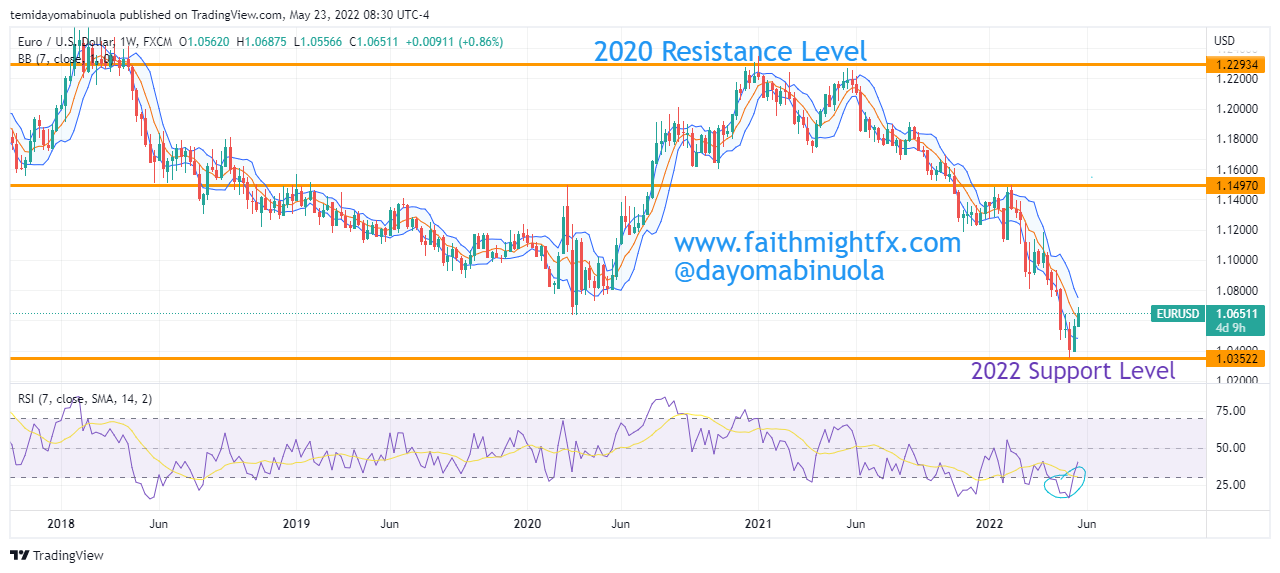
Since the beginning of 2022, the strength of the bulls have been minimal as the price has been pushed downwards in favor of the US Dollar. The war between Russia and Ukraine has led to Russia cutting the gas supply to some European countries and this may be a contributing factor to the weakened Euro. More so, the inflation hitting economies worldwide may also be a reason why major currencies can’t seem to rise against the US Dollar.
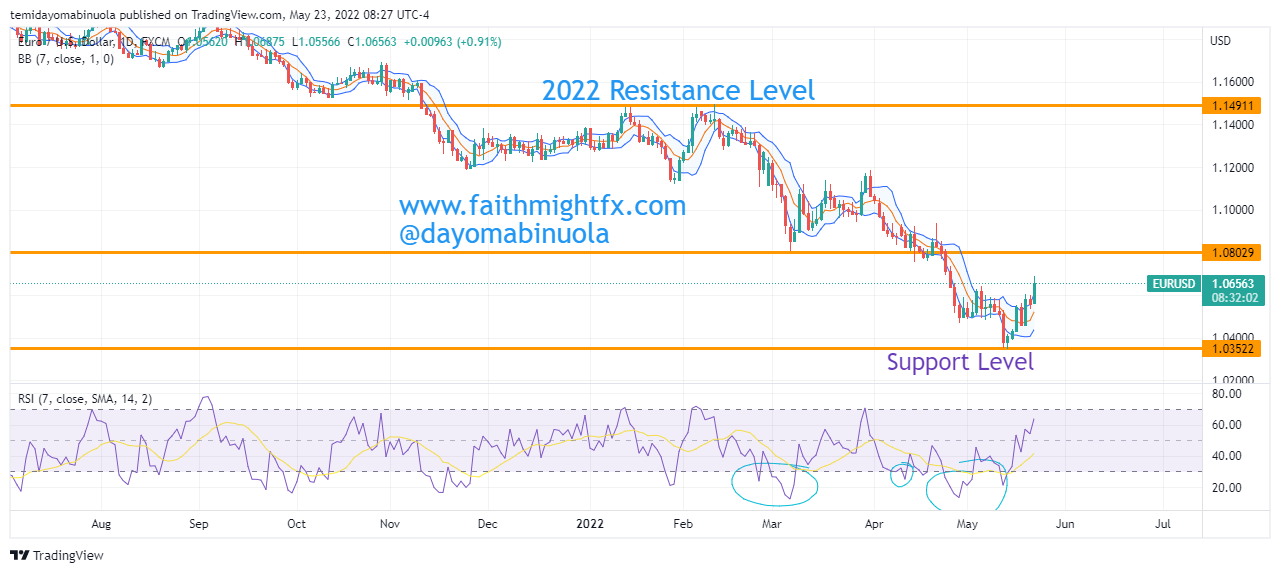
About four weeks ago, EURUSD fell below 1.0600 for the first time in five years. On the 13th of May, 2022, the price of EURUSD was as low as 1.0350. However, in the last two weeks, the Euro has appreciated against the US Dollar. Price has been able to rally to 1.0680 which is over 300 pips gain in the last week. In the coming weeks, the bears might push price lower again below 1.0470.
Some of these ideas are in our clients’ portfolios. To understand if this one can work for you or for help to invest your own wealth, talk to our advisors at FM Capital Group. Would you like more information on how to get currencies in your portfolio? Schedule a meeting with us here