fbpx

What PMI Week Tells Us

You cant make someone change from being either a lefty in denial or a miserable pessimist (ukipers) that dont want a recovery. I for one will enjoy the upturn and reap the benefits with my company as I can already see. Must go work to do

The above quote is a comment on an article in the Telegraph yesterday that the UK economy is recovering at the fastest rate in the world. During the summer, the UK economy showed some great numbers from all sides of its economy. Construction and manufacturing were buzzing, consumers were spending and house prices were rising. From June through August, services PMI numbers surprised to the upside. Even construction and manufacturing had some very robust months which becoming a great sign of recovery as these sectors in particular suffered tremendously during the Great Recession.

UK PMIs

OctoberSeptember
Manufacturing PMI56.757.5
Construction PMI58.960.1
Services PMI60.360.4

While this week’s PMI numbers may have missed expectations, these are some strong PMI numbers. All numbers are nicely above 50 indicating a very robust recovery in the UK. In fact, the September numbers were revised upward since 1st reported a month ago. It looks as though the fundamentals have come to reflect what price action has been telling us for the past few months.

So why the selloff this week? $EURGBP has rallied close to 150 pips off the lows. $GBPUSD and $GBPAUD have both tumbled handsomely from their highs. It looks like a classic case of buy the rumor, sell the fact. The market is forward thinking and now that fundamentals support price action, bulls are taking profits.

Sterling is still very much bullish even at current levels in $GBPAUD, $GBPUSD and $EURGBP. However, these corrections have broken key support/resistance levels opening the door for a deeper correction into next week to match these tremendous GBP rallies.

Mentioned above:

UK economy growing at fastest rate in the developed world (Telegraph)

Global PMI Data (Avondale Asset Management)

Read also:

GBP/USD In Yet Another Correction (FMFX)

Australian Dollar Puts In a Bottom (FMFX)

Reality Bites (FMFX)

Respect the Zone (FMFX)


Sterling Digest, 26 September 2013: grumpy bulls


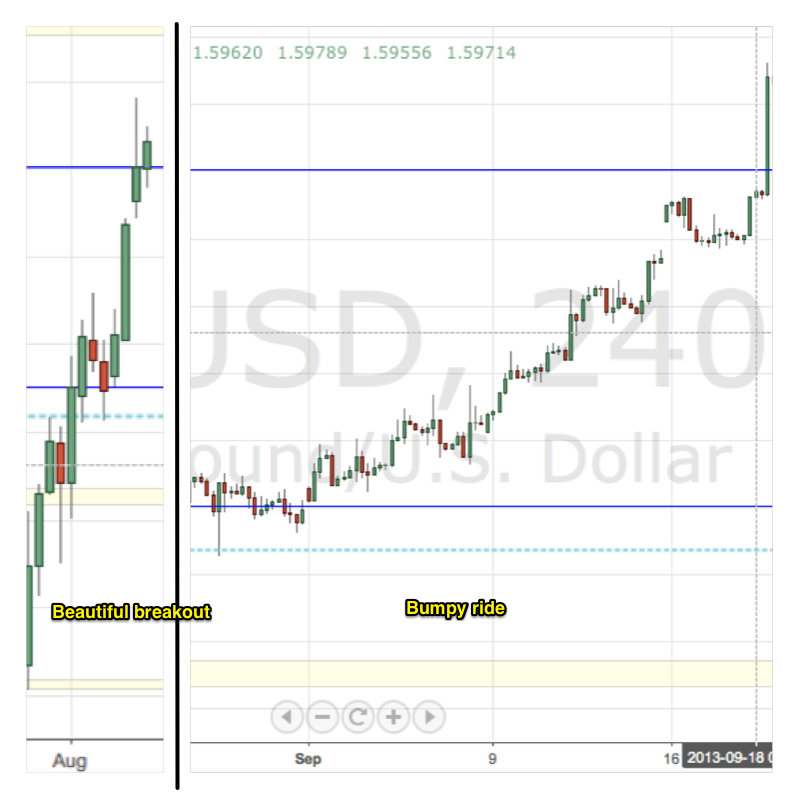
split screen of GBPUSD weekly and 4hr charts
No wonder bulls are grumpy

We left off the Digest musing over the strength in sterling due to robust UK economic data as GBP hit long-term resistance levels against all major currencies. Since August, GBP has experienced tremendous breakouts in some pairs and significant price corrections in others. Now that $GBPUSD is above 1.60, $GBPCAD above 1.65, $GBPAUD above 1.71 and $EURGBP at 0.84, it seems as though GBP bulls are having their way. However, these moves have not been without resistance. The moves higher in sterling have been a grind with slow, choppy moves that have been difficult to trade on anything but a short term basis. With a light calendar this week, the market has allowed GBP to correct but robust economic data gave life to sterling as $GBPUSD, in paritcular, managed not to loose its important 1.60 level. With 3Q at its end, October brings the market its first glimpse of fall season data. If the UK economy continues to put in robust results, expect GBP to continue its summer rally back to long-term resistance levels.


Read the last issue: Sterling Digest, 23 August 2013: reality bites


Today’s Appearance in FXStreet’s Live Analysis Room

The FXStreet’s Live Analysis Room has become a fun place to stop by and chat markets with veteran trader Dale Pinkert. He has a brought on a wide-array of traders and market participants from all sides, aspects and backgrounds. It’s always an honor to be asked back. (Click the image to listen)

onairnow_fxroom
Listen to Tuesday’s interview ($GBPUSD AT 1.60)

Mentioned during appearance:


Sterling Digest, 23 August 2013: reality bites

Free stress test. Cool photo on Flickr
Are the markets telling us something?

Carney was supposed to be bearish for sterling. He was supposed to do some monetary magic that would weaken sterling to levels that would jumpstart industry in a stagnate British economy. There is just one problem with that. The story changed. When Carney accepted the position, the British economy was a very sad one. But that is not today’s scenario 6 months later. Numbers have been robust. Optimism is starting to creep in. Headlines are honestly hopeful. But let us not get too ahead of ourselves. The latter part of 2013 is yet to unfold. With sterling moves higher on yields (which are moving higher on growth), the question remains is if this growth is sustainable and repeatable. The uncertainty around this answer plays out as a grinding market for now. The moves are choppy but very well bid into some major resistance levels. ACROSS THE BOARD. $GBPAUD has seen 1.75; $GBPNZD targets 2.00; $GBPUSD has flirted with 1.5750; and $EURGBP remains supported by 0.85. The $GBPCAD weekly chart is unbelievable with price right at long-term resistance at 1.64. Incredible strength in sterling in the middle of August seems a little too good to be true. Wait for September.

Image credit


Respect The Zone

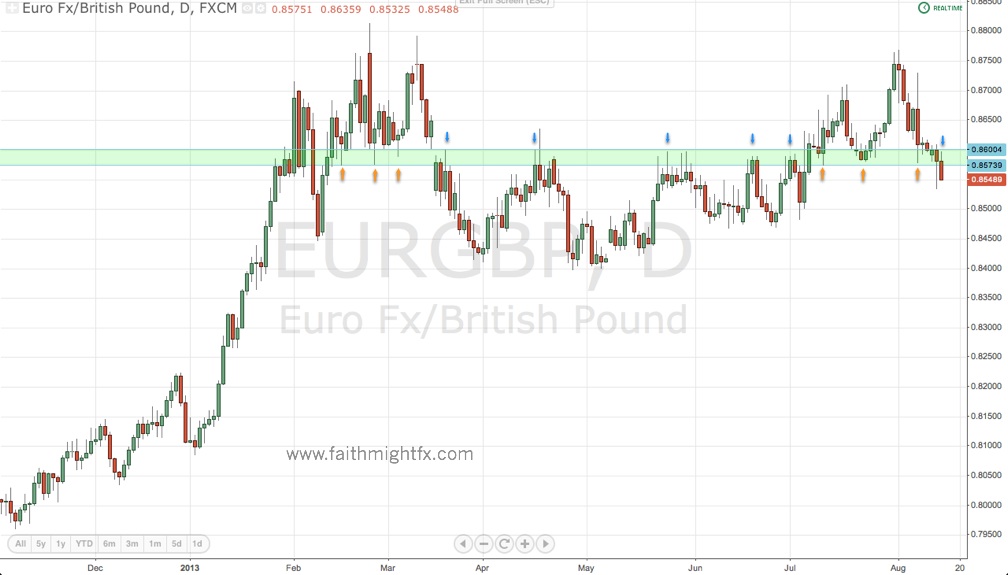
Yesterday, the sterling market experienced a flash rally where an “erroneous” order was filled to buy yards of GBP versus EUR. This sent $EURGBP crashing down to a low of 0.8535 and the other GBP crosses spiked higher. Despite this fat finger, $EURGBP broke a huge level for the pair at 0.8570.

EURGBP DAILY CHART

As mentioned over 3 weeks ago,

Of particular interest is this zone between 0.8600 and 0.8570. It has been a buy zone when $EURGBP has traded above it and a sell zone when the pair has traded below.

When we traded below the zone yesterday on the spike lower, this zone changed from a buy zone to a sell zone.

True to the zone, price was capped by the 0.8600 level with a high today of 0.8598 off yesterday’s 0.8535 lows. We now have follow through to the downside with $EURGBP trading at 0.8545 (as of this writing) and looking to move lower. Expect any rallies back into the zone to be met by offers unless price manages to close back above 0.8600.

Trade what you see.

Mentioned above:


Sterling Digest, 13 August 2013: mixed post guidance

DJ mixing sound board
Carney remixes guidance for UK

Sterling has been mixed since the announcement of forward guidance giving the Bank of England (BoE) a dual mandate to target both inflation and unemployment. It also means that economic data takes on increased importance as markets parse news to determine central bank sentiment and direction in price action. However, sterling has been mixed in the week after forward guidance was unveiled. Last week, GBP rallied across the board post-announcement taking $GBPUSD to 1.5571 and $EURGBP to 0.8578. In this new trading week, however, GBP has weakened considerably off those highs. The spotlight of this week will be the release of the BoE meeting minutes which will give the market a peek into the central bank’s true sentiment on forward guidance. Given the unanimous vote last month not to increase QE, a split vote threatens to weaken the GBP and increase volatility in the near term.

Image credit


Timing Is Always Important

Sterling has completed some big time levels in the past week. $GBPUSD hit one-month highs at 1.5571. $GBPAUD broke out higher to 1.7340. And $EURGBP mean reverted back to 0.86 after hitting 5-month highs at 0.8750. I say all that so you can understand why I’m very much on the defensive into this new week. It is important to recognize how likely it is that these particular pairs start the week consolidating these major moves.

With the $GBPUSD linked to the almighty USD, cable will certainly lead. Opening below 1.55 signals weakness that could be short-lived as the Monday session gets underway. 1.5430 resistance-turned-support and the 1.5400 50% Fibonacci level of the rally from 1.5102 to 1.5571 are the key levels of support to watch now at the market open. $EURGBP below 0.8600 has 0.8570 as key to direction. The loss of 1.6925 resistance-turned-support signals further losses toward 1.6750 in the $GBPAUD.

If you enjoyed these major moves, take a seat back. If you missed these major moves, take a seat back. Timing is a critical factor in our trading. Be mindful of the timing: big moves, August trading, and new shifts in some of the major central banks. There is no need to rush or force trading, today, in particular. Often times, the best opportunities in the market are those you can wait on.

Mentioned above:


Sterling Digest, 23 July 2013: #royalbaby bump

royal baby announcement
It’s a #royalbabyboy!

The UK monarchy has a new addition and the hype surrounding the birth of the new prince could arguably be called overdone. But sterling opened the week to news that Kate Middleton was in labor and rallied very nicely in the wake of the good news. $GBPUSD made new highs at 1.5384. $EURGBP broke to new lows at 0.8582. The baby has been here less than 24 hours and he has become responsible for lifting the UK into economic recovery. Talk about influence! In all seriousness though, with the economic calendar extremely light this week, sterling traders are looking ahead to Thursday’s UK GDP release. In light of the some robust numbers from retail sales and PMI in the past weeks, GDP is expected to surprise to the upside. Such a surprise will continue to fuel sterling strength and possibly induce a reversal in the $GBPUSD and $EURGBP. However, GDP expectations are so high that a disappointment may just end the rally.

Image credit


Decision Time For EUR/GBP

The $EURGBP is at a crossroads at this 0.8600 level.

EURGBP daily chart

Of particular interest is this zone between 0.8600 and 0.8570. It has been a buy zone when $EURGBP has traded above it and a sell zone when the pair has traded below. As the $EURGBP entered the zone last week, it was met with bids as the pair closed the week at 0.8609. Now as trading kicks off in this new week, price has slipped back into this zone. Where will $EURGBP go from here? With a very light economic calendar this week, this pair will be particularly driven by the UK GDP and German IFO releases. Either the bulls return or the bears step in.

Trade what you see.


EUR/GBP Reversal At Hand

I hardly think so. But yesterday I read 2 analyses on $EURGBP that spelled out opposing views on the future direction of the pair. And I think, as traders, it is always important to consider both sides of a trade no matter your own opinion on price action.

The Bear Case

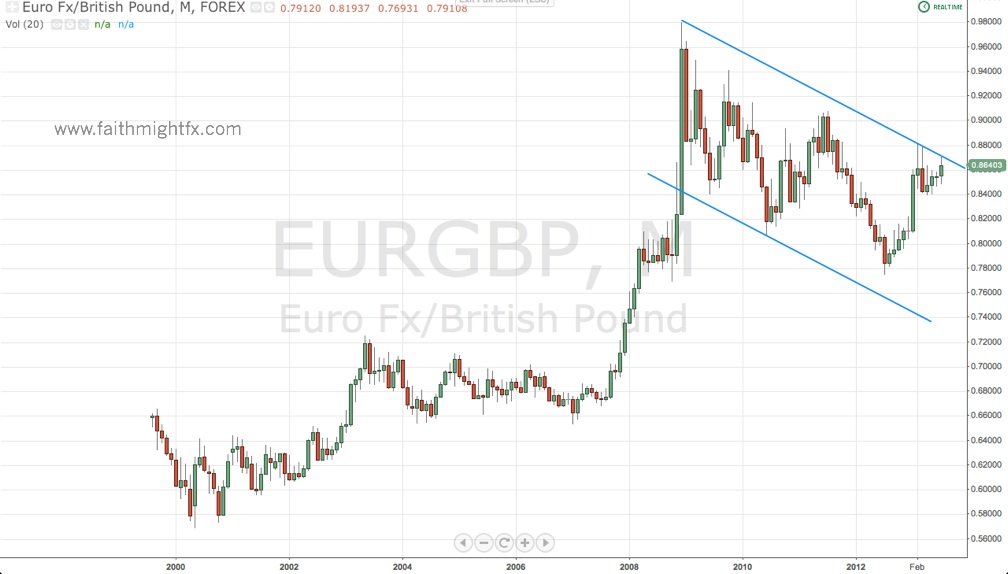
EURGBP monthly chart

Despite the recent new highs (today at 0.8710), price does remain in this downward channel that has been forged over the past 4 years. The fundamentals weakly suggest that the UK economy is doing relatively better than the rest of the EU economy. The bears do have a case especially at these levels.

The Bull Case

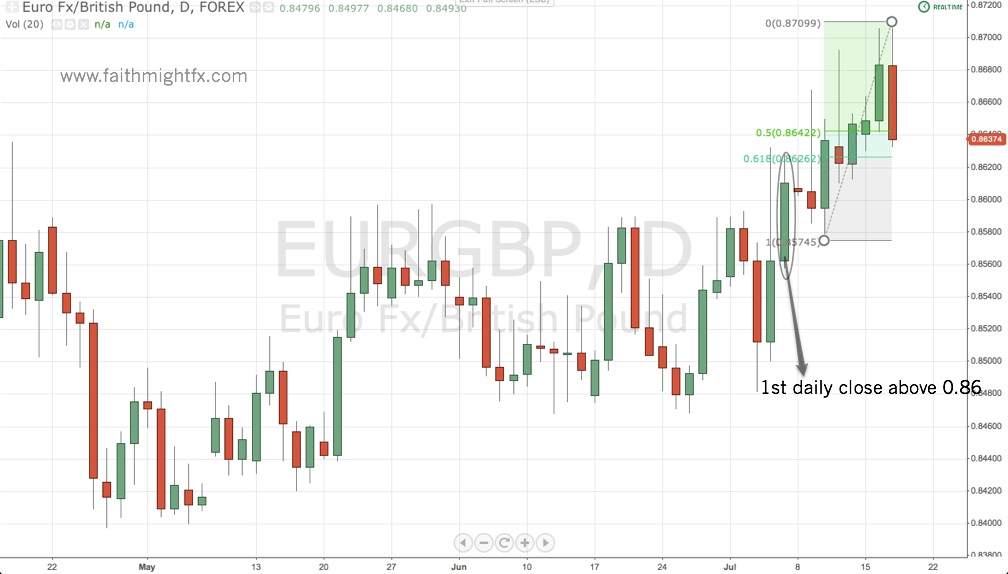
After trading in a range for over 10 weeks, the $EURGBP broke that range to the upside. Typically, a breakout ensues in the direction of the break when there has been a well-established range. And the $EURGBP did break out to a high today at 0.8710. However, the Bank of England minutes of Governor Carney’s 1st meeting revealed a much more hawkish central bank. Additionally, UK unemployment data came out much stronger than expected. As such, the $EURGBP has pulled back into the Fibonacci levels of the rally after the range break.

EURGBP DAILY CHART

Even on this pullback, the bullish picture remains intact. The market now awaits the testimony from Fed Chairman Ben Bernanke. Dovish comments from Bernanke could support the EUR and push the pair back above 0.8700. However, if the pullback extends beyond the 61.8% Fibonacci level, only a daily close below 0.8574 would indicate bearish price action in the short term targeting 0.8500.

Trade what you see.

Mentioned above: