fbpx

Gold’s Price Reaches An All-Time High

Gold's Price Reaches An All-time High

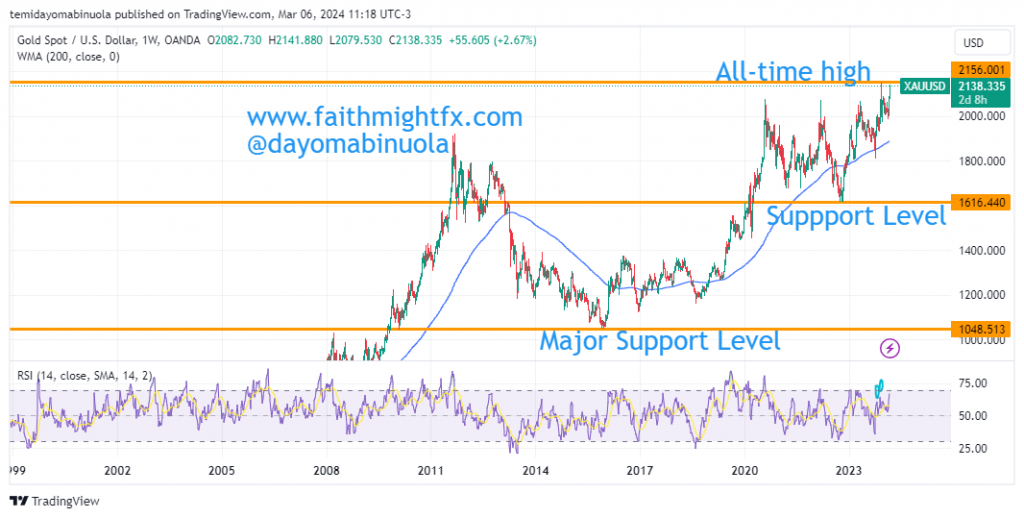
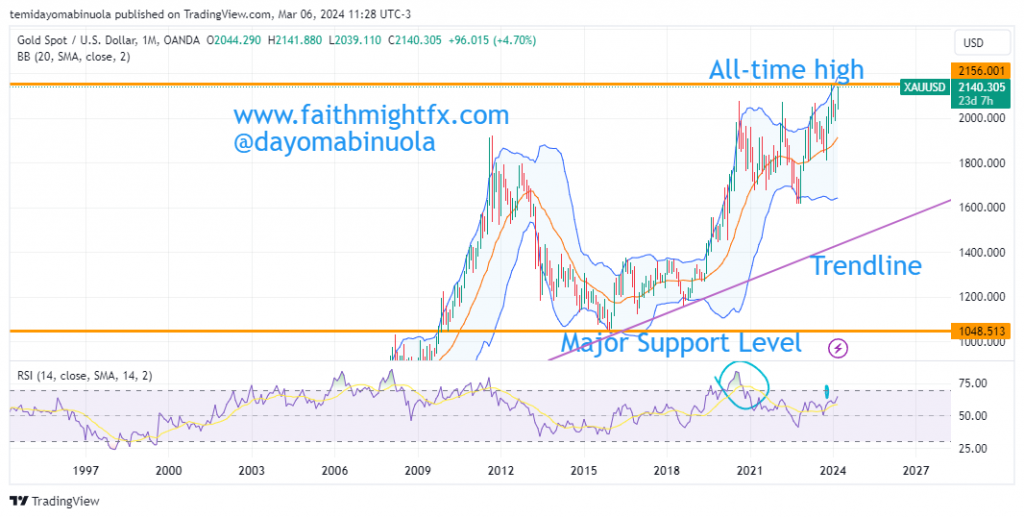
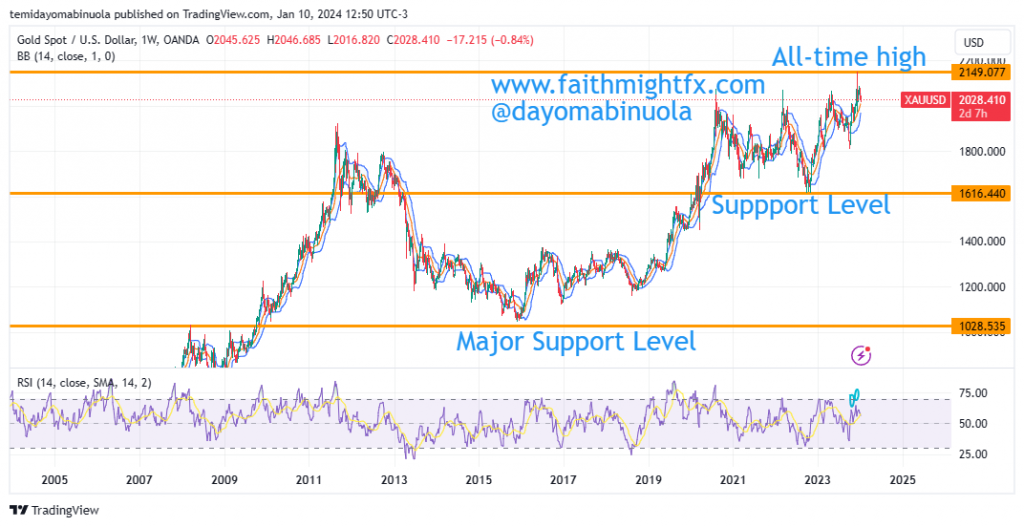
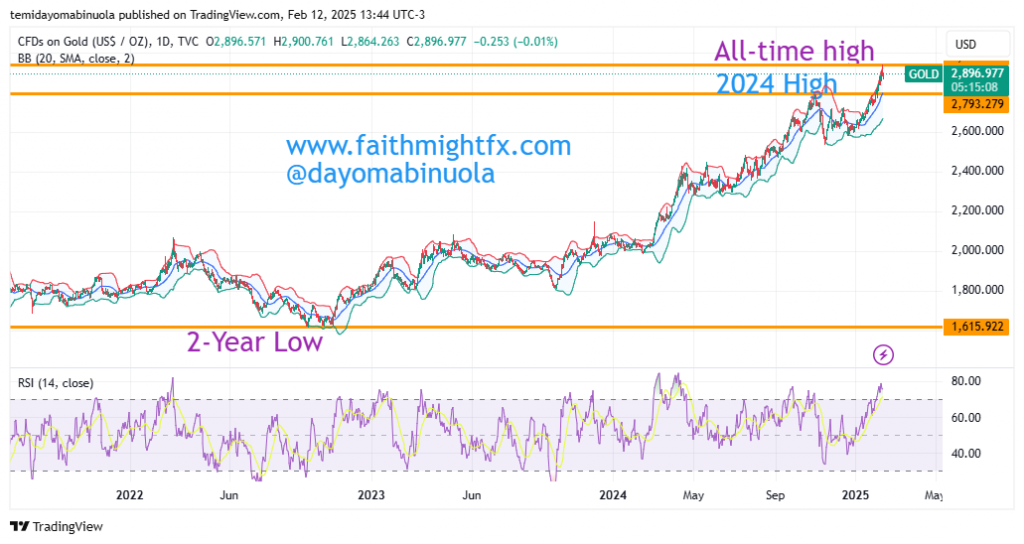
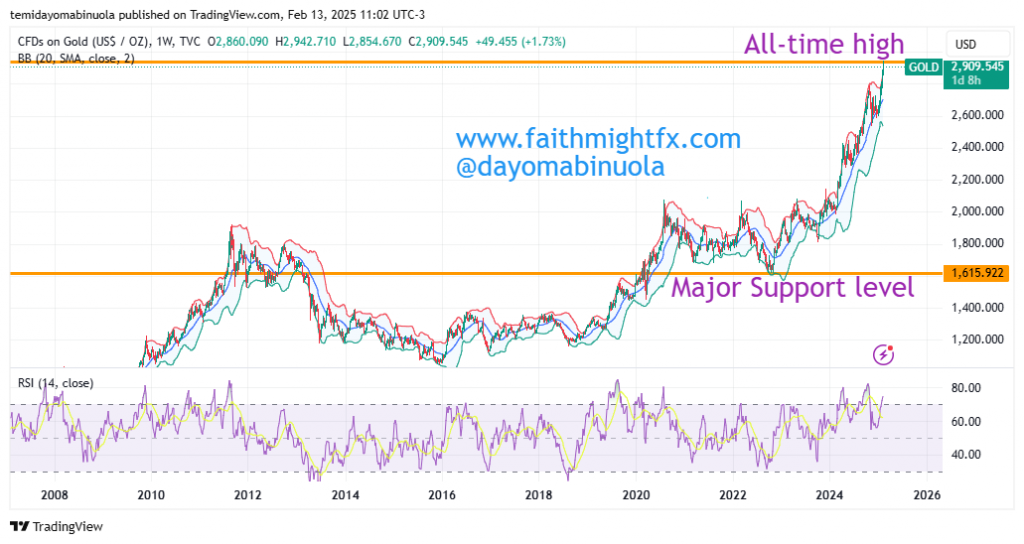
The commodity price has been increasing for about a decade despite the uncertainties in the financial market. The lowest price of XAUUSD was $1048 in December 2015. The price has rallied to $2141 per ounce in December 2023. Unlike many other asset classes during the lockdown, the price of gold rose to $2074 per ounce in September 2020. The bears took over as price fell to $1622 in September 2022, which stands as the lowest price since April 2020.

At the time price of XAUUSD was at $2074, RSI was at an overbought position. The price of Gold broke out of the previous resistance level to reach $2141, which currently is the all-time high of gold. There was a price retracement in January and February 2024 that made price fall to $1985 before price rallied again above $2000 in the last week of February. As a result of the bullish momentum, the price of gold might break a new all-time high at $2150 in the coming days or weeks.

Some of these ideas are in our clients’ portfolios. To understand if this one can work for you or for help to invest your own wealth, talk to our advisors at FM Capital Group. Would you like more information on how to get commodities in your portfolio? Schedule a meeting with us here

The Price of Gold Reaches An all-time high Before 2023 Ended

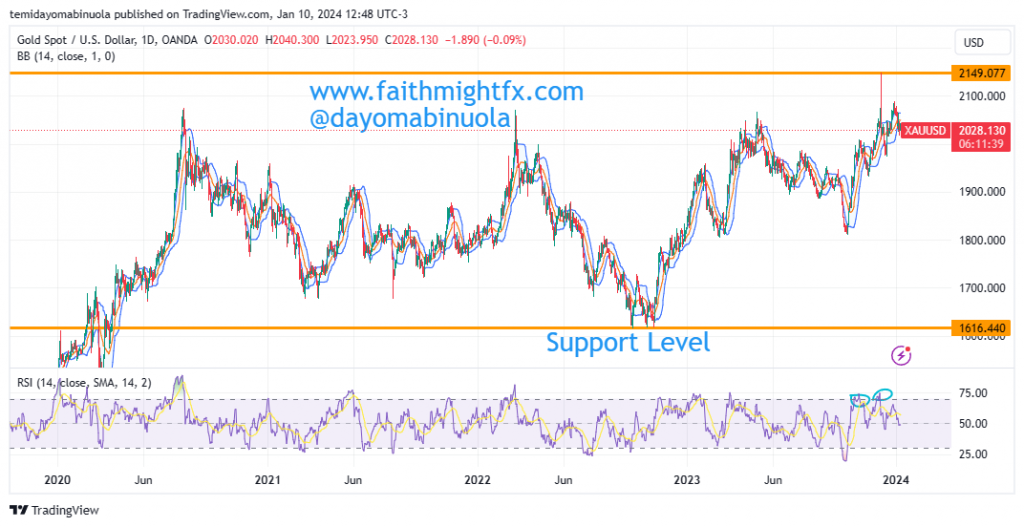
The highest price level gold has reached since the lockdown has been at $2076. The lowest price level was t $1620 between September 2022 and November 2022. The rally in December made the price of XAUUSD reach $2150. RSI on the daily chart shows price has been overbought at two different positions. The bulls were not able to maintain the rally as price has fallen to $2028 as of the time of this writing.

In the last one decade, the price of gold has rallied from the lowest point of $1051 in December 2015, to the highest point at $2150 in December 2023. As the bears are beginning to push price lower, we might see the price of gold reach $1848. Since the beginning of this year, the price of gold has been falling, which could be an indication of the bears taking full control of the commodity. The price on the daily chart has crossed to the lower region of the Bollinger bands.

Some of these ideas are in our clients’ portfolios. To understand if this one can work for you or for help to invest your own wealth, talk to our advisors at FM Capital Group. Would you like more information on how to get gold in your portfolio? Schedule a meeting with us here.

Gold Bounces As Bulls Gain Momentum

Gold Bounces As Bulls Gain Momentum

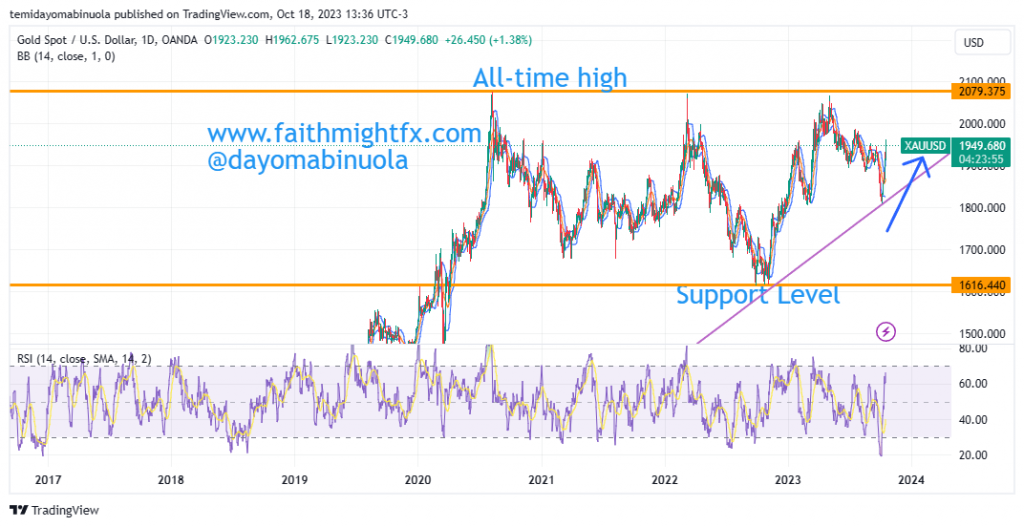
In October 2022, the price of gold fell to $1617 per ounce, after price had reached $2071 in March 2022. This price dip is one of the worst falls Gold has had since its been traded. A major support level was formed at $1617. There was consolidation for about 8 weeks before a bounce in the price of $XAUUSD started in November 2022. The bounce made the price of gold reach a previous resistance level of $2071 in May 2023. At different times in the past, in August 2020, March 2022 and May 2023, the price of Gold has maintained this resistance level at $2071.

In the past three years, the price of Gold has been moving between $1617 and $2071. From the recent top in May 2023, price fell to a support level of $1810 in October 2023. The current price of Gold is at $1948. We might be seeing price rally to $1990 in the coming weeks, The RSI on the daily chart has shown that the price is oversold.

Some of these ideas are in our clients’ portfolios. To understand if this one can work for you or for help to invest your own wealth, talk to our advisors at FM Capital Group. Would you like more information on how to get commodities in your portfolio? Schedule a meeting with us here.

Gold’s Bears To Push Price Lower

Gold Bears to Push Price Lower

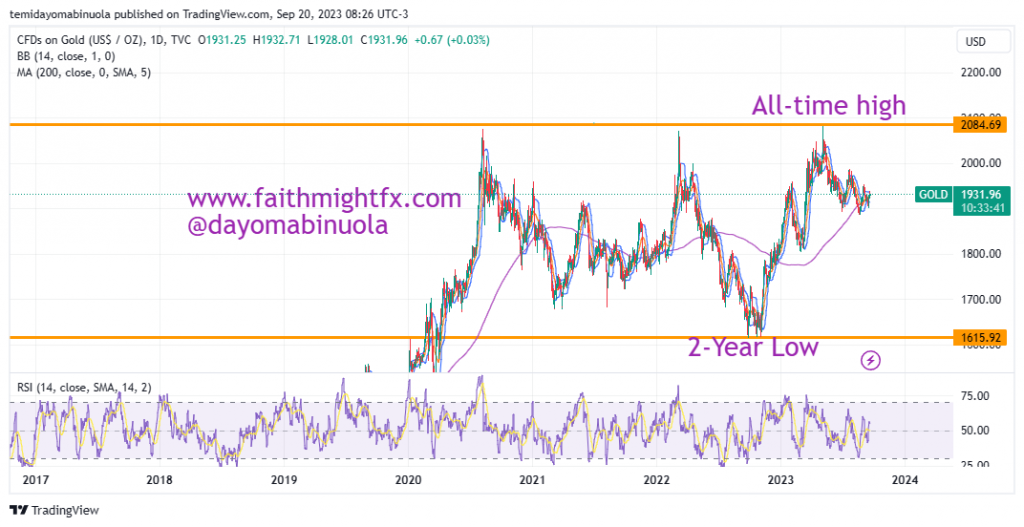
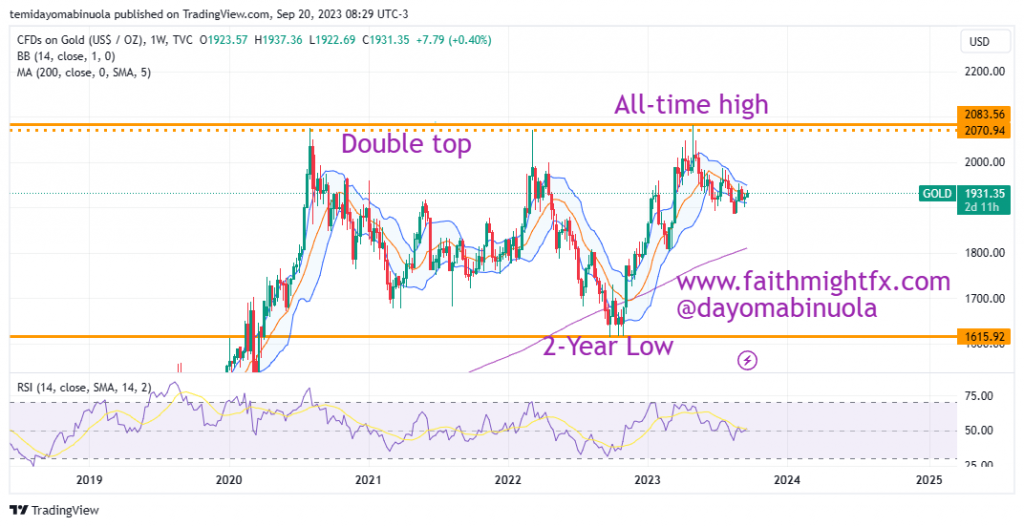
Gold experienced two highs between 2020 and 2022, which signifies a double-top on the monthly chart. This double-top was at $2069, one in August 2020 and the other in March 2022. A price drop to $1616 occurred after this double top. Between September and October 2022, the bears lost their momentum and the price of gold began a major rally in November 2022.

The rally that began in November 2022 made the price of gold reach an all-time high at $2082 in May 2023. Since the all-time high, the lower highs and lower lows pattern has been formed on the daily chart. The price of gold is currently at $1932, we might be seeing the price fall to $1914 in the coming weeks.

Some of these ideas are in our clients’ portfolios. To understand if this one can work for you or for help to invest your own wealth, talk to our advisors at FM Capital Group. Would you like more information on how to get commodities in your portfolio? Schedule a meeting with us here.

Price of Gold Could Fall To $1900

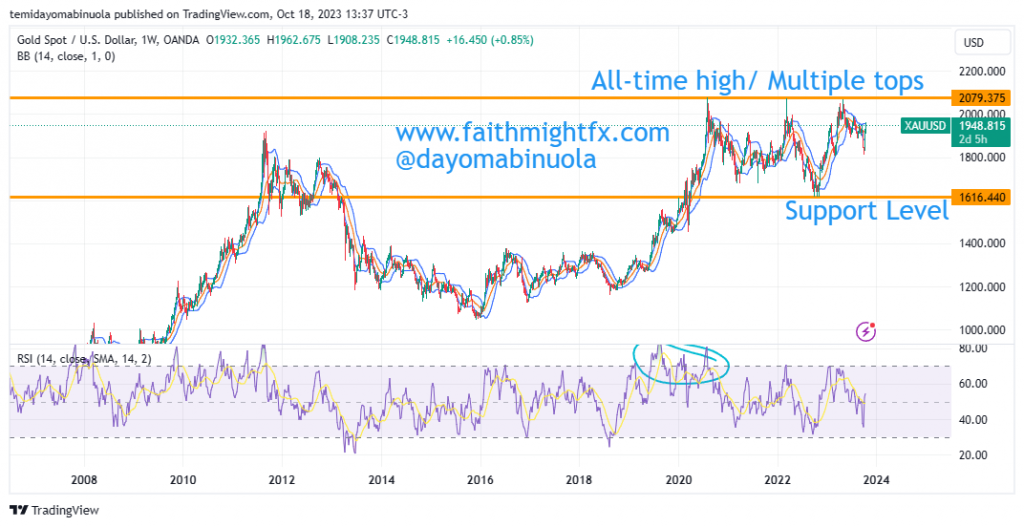
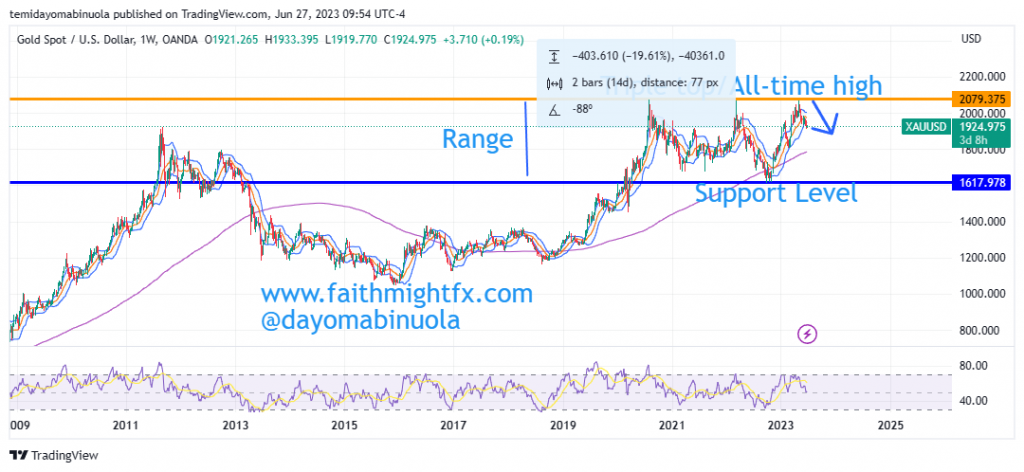
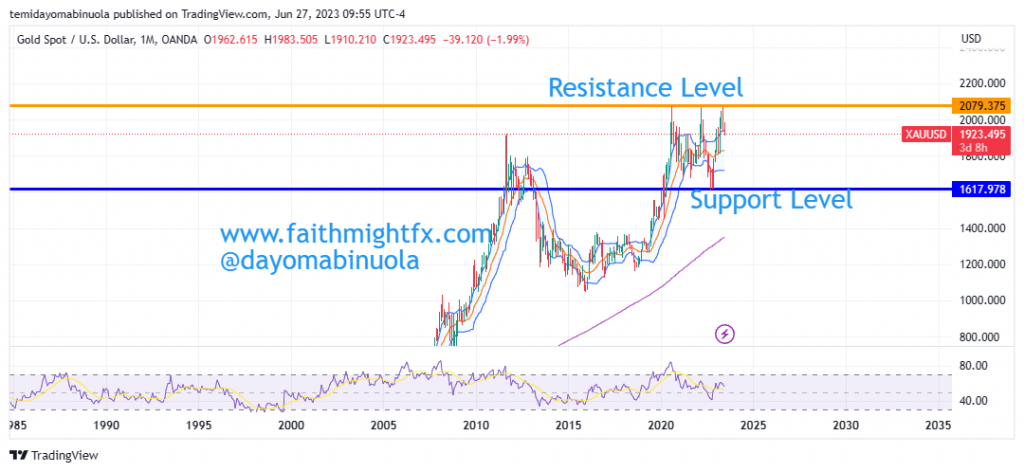
On the 25th of January, 2023, we published an article when the price of Gold reached the psychological level of $1900. We forecasted that Gold will rally to hit $2017. That target was reached in May 2023. This is the third time the price of Gold is retesting the resistance level at $2079 since August 2020 when the price hit $2079 for the first time. Price has been falling since the retest was reached. Last month’s candlestick closed bearish.

On the monthly chart, XAUUSD has been overbought on the RSI since August 2020 and has not shown any indications that price has been oversold. This is one of the reasons there might be a price fall in the coming weeks. Looking at the Bollinger bands on the weekly chart, price has crossed to the lower level of the Bollinger bands. On the weekly chart, price also shows that it has been overbought at three different times since 2020. We are seeing a bearish turn this month and it could continue as we might see the price of Gold fall below $1900 in the coming days or weeks.

Some of these ideas are in our clients’ portfolios. To understand if this one can work for you or for help to invest your own wealth, talk to our advisors at FM Capital Group. Would you like more information on how to get commodities in your portfolio? Schedule a meeting with us here.

Gold Price Reaches $1900 Since May 2022

Gold Reaches $1900 For The First Time Since May 2022

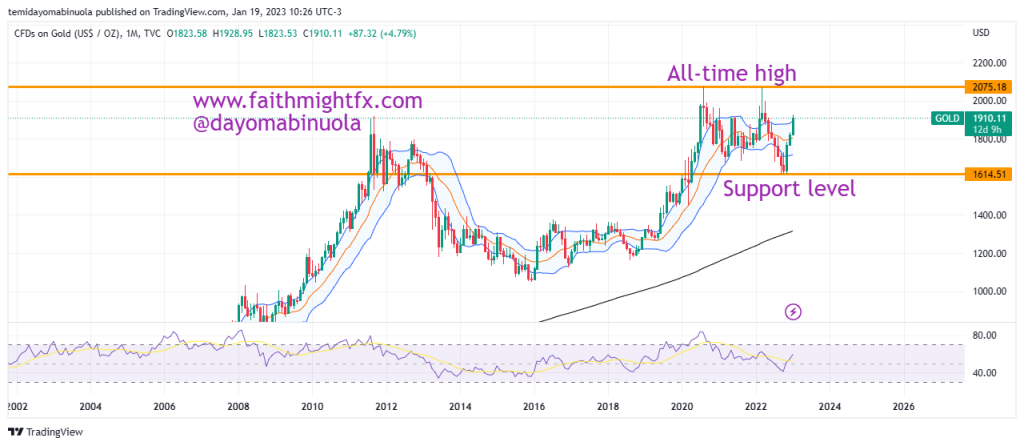
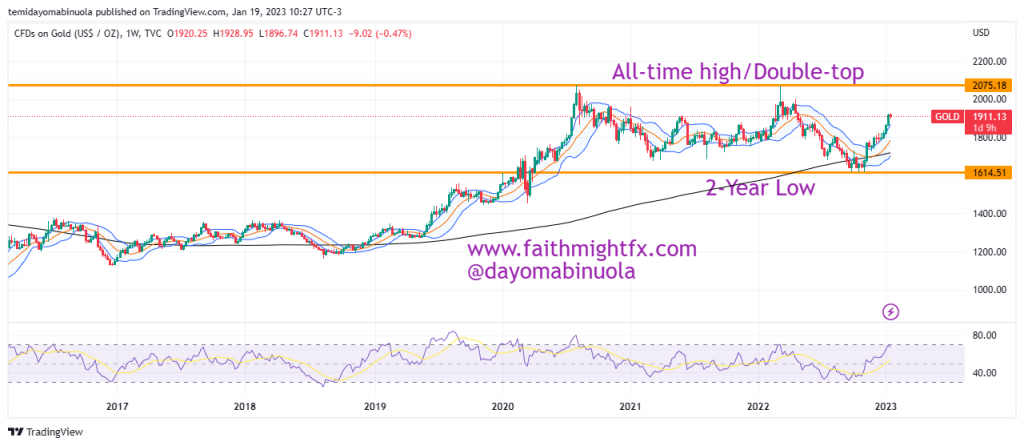
The price of Gold is beginning to appreciate after its price fell from the record high of $2075 per ounce in March 2022. From April 2022 to October 2022, all months closed bearish. The price of Gold reached $1614 in November 2022 which is the lowest price since April 2020. The $1614 price mark stands as the support level for that last 2 years. 

Monthly Chart

In November 2022, a bounce from the 2-year support of $1614 occurred as the bulls gained more strength. As a result of the rally that started in the last quarter of 2022, Gold’s price closed for the year 2022 at $1822. The rally continued into 2023 as the price reached a 2023 high at $1928 on the 16th of January.

Weekly Chart

The rally could continue in the coming weeks as the resistance level at $2075 might be broken to the upside, which could eventually make Gold’s reach an all-time high. 

Some of these ideas are in our clients’ portfolios. To understand if this one can work for you or for help to invest your own wealth, talk to our advisors at FM Capital Group. Would you like more information on how to get commodities in your portfolio? Schedule a meeting with us here

Gold Reclaims $1800 Psychological Level

Gold reclaims $1800 psychological level

The opening price of Gold in 2022 was $1828.01. Despite the rally in January, the month ended on a bearish note at $1796. February and March were much more bullish as price hit $2070 which was last reached in August 2020.

Weekly Chart

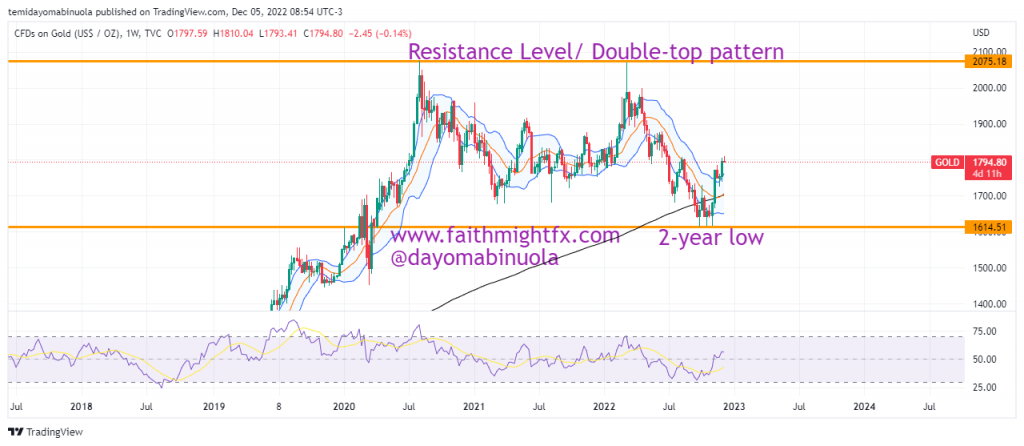
The bears took control as Q2 began and from April to October, all monthly candlesticks closed bearish. This bearish run made price hit $1616 which stands as the support level for the last two years i.e. 2021 and 2022.

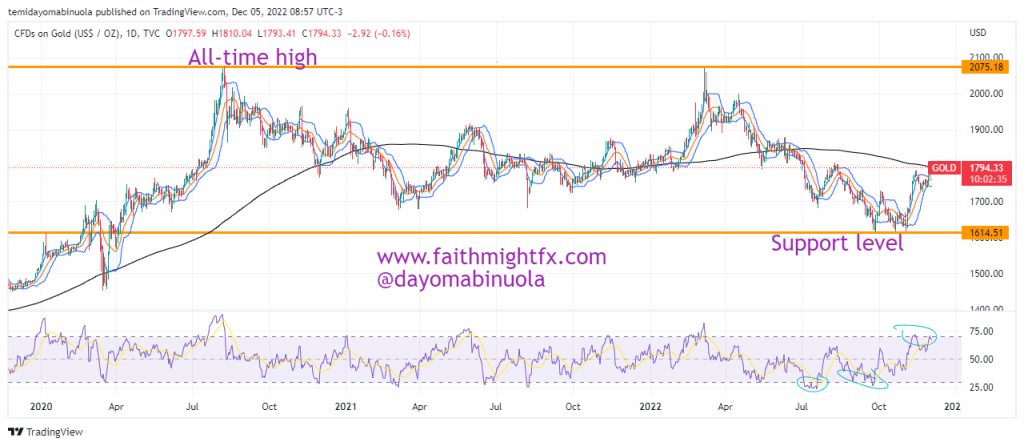
Analyzing November and the first few days of this month, there seems to be some hope for Gold. In November, price bounced from the year’s support of $1616 as November closed at $1768. This bullish run has continued as price touched $1800 on December 1, 2022. 

Daily Chart

Currently, price has reached a new month’s high at $1809. Our analysts do not see the bears taking over and that means by December 31, 2022, the price of Gold should still be above $1800 psychological level. RSI indicates on the daily time frame that price is overbought however, this might not translate to a price reversal soon.

Some of these ideas are in our clients’ portfolios. To understand if this one can work for you or for help to invest your own wealth, talk to our advisors at FM Capital Group. Would you like more information on how to get commodities in your portfolio? Schedule a meeting with us here
Gold’s Price Heading To 2022 Support Level

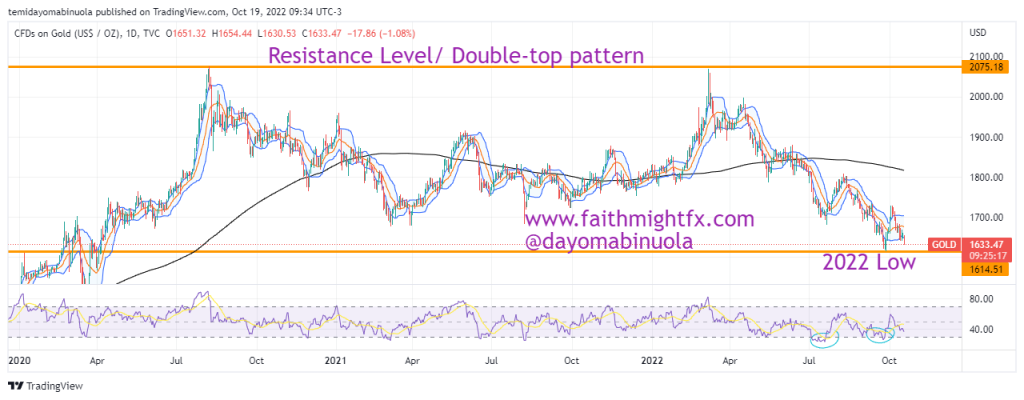
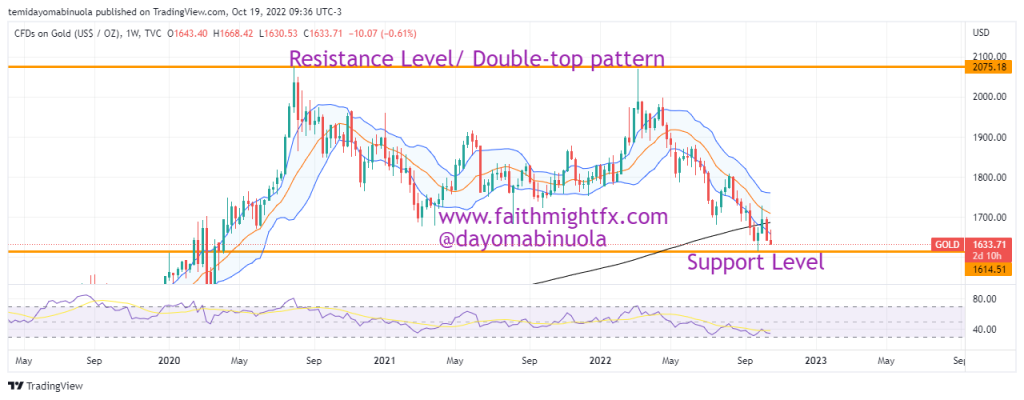
Globally, the prices of commodities have dipped this year. At the beginning of the year, the price of Gold was at $1829 per ounce. There was a rally in the first quarter of the year, which made price reach $2071 per ounce. Since the year’s high was reached, it has continued to fall. We wrote an article in July 19, when price of Gold was at $1711. Our analysts on this day said price could fall below the then support level of $1676. The price of Gold today stands at $1632.

Daily Chart

Just like the cryptocurrency market is down in this year, the gold market is also down. We might be seeing a new 2022 low below $1616, which is the current year’s low. On the weekly chart, there is a double-top pattern, which must have led to price fall. Despite RSI shows price has been oversold twice on the daily chart, price could still fall further.

Weekly Chart

Some of these ideas are in our clients’ portfolios. To understand if this one can work for you or for help to invest your own wealth, talk to our advisors at FM Capital Group. Would you like more information on how to get commodities in your portfolio? Schedule a meeting with us here
UNCHARTED Podcast: Episode 4

CRYPTOCURRENCY: An overview of the Crypto market
CRYPTOCURRENCY: Analysis of Bitcoin & Ethereum

In this podcast episode, we did a general review of markets. First, we extensively discussed Cryptocurrencies. We looked into Bitcoin and Ethereum and the recent stagnation. We also did a forecast of the direction that these major Cryptos may move in the coming months. We touched on Solana and the impact Bitcoin has on all cryptocurrencies. Here’s a forecast on Bitcoin we made some months back.

CURRENCIES: The Impressive Run of the US Dollar and how Risk-Aversion is contributing to it
CURRENCIES: Depreciation of world currencies and their reliance on the USD
CURRENCIES: US Dollar as a Safe Haven, GBPUSD, & NZDUSD
CURRENCIES: Possible causes for USD rise and Inflation
CURRENCIES: US Economic Strength and quarter-over-quarter GDP growth
CURRENCIES: Recession Fears & USDJPY

We also took a dive into the world of Currencies, specifically the United States Dollar. The Dollar has been dominating the world of currencies. Despite inflation rates being sky high, the Dollar seems to be doing relatively well when compared with other major currencies. We also discussed the Central Banks and their reactions to the inflation their respective countries face.

COMMODITIES: An overview of Gold & Silver
COMMODITIES: USD vs Gold, which is the Safe Haven of Choice?

We closed this episode on Commodities. During times of crisis, it is expected that people will hedge their funds in Precious Metals but this isn’t what we are seeing. Investors are hedging their funds in USD and investors from emerging markets also see USD as a safe haven as opposed to Gold and Silver.

Some of these ideas are in our clients’ portfolios. To understand if this one can work for you or for help to invest your own wealth, talk to our advisors at FM Capital Group. Would you like more information on how to get stocks in your portfolio? Schedule a meeting with us here.

Commodities Skyrocket Amidst Russia-Ukraine Tensions

Since the beginning of the Russian military invasion of Ukraine, prices of most commodities have headed in a strong bullish direction. On Monday, 7th of March 2022, the price of Gold hit $2002 per ounce in a gap up. The last time it reached this price was in August 2020. The year’s support line is at $1780 per ounce.

Weekly Gold Chart

The price of silver reached a new resistance level at $26.1 per ounce. The last time Silver’s price was at this level was in July 2021. The year’s support level is maintained at $21.9 per ounce.

Weekly Silver Chart

The price of Brent Crude Oil opened for the week at $129 per barrel. It appreciated for some hours to $130.55 after which it began to drop. As of March 7, 2022, the price of Brent Crude Oil is at $122 per barrel. WTI Oil opened at $121 per barrel and rallied up to $130.55 before it began a descent. WTI Oil’s price is currently at $119.

WTI Oil Price
Brent Crude Oil

We don’t see the commodity price sustaining this rally over the long-term as the Russian military forces might cease-fire in a few weeks following strong sanctions from the international community of nations. The conflict may also be suspended soon if Putin and Zelensky can come to an agreement.

Some of these ideas are in our clients’ portfolios. To understand if this one can work for you or for help to invest your own wealth, talk to our advisors at FM Capital Group. Would you like more information on how to get stocks and commodities in your portfolio? Schedule a meeting with us here.