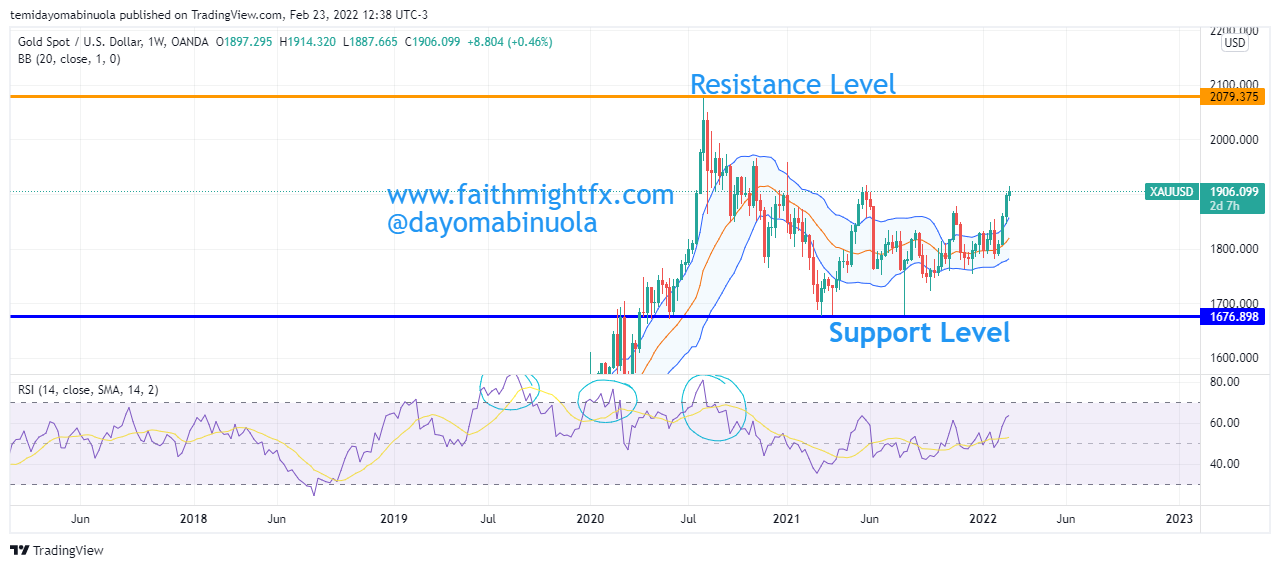
Ever since the all-time high for Gold was reached in August 2020 at $2074 per ounce, the bears have been more active in $XAUUSD’s price action. Before the all-time high in 2020, there was high volatility in the price of gold. For example, the lowest price of $XAUUSD in August 2018, August 2019, and August 2020 were $1,160, $1,400, and $1,865 respectively.
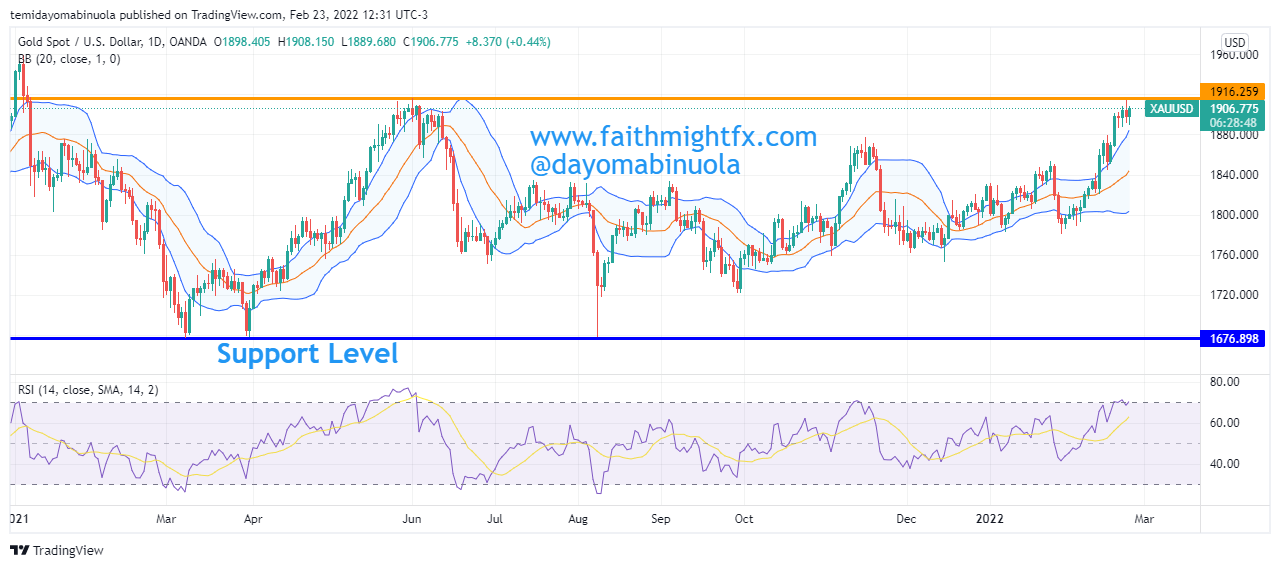
Since the all-time high in 2020, the price has maintained a support level at $1,677 even till now. The current resistance level is at $1,917 which has been active since 2021. As at August 2020 when the price of $XAUUSD reached an all-time high, RSI indicated that the price was overbought which possibly was the cause of the price dip at that time.
Since the beginning of 2022, Gold has rallied. This week, Gold hit $1,912, the highest point since the year 2022 began. It isn’t certain that Gold can keep up this rally for much longer as the rally is linked to investors’ panicky response to hedge their investments in precious metals, which are commonly considered to be safe havens during geopolitical crises.
Some of these ideas are in our clients’ portfolios. To understand if this one can work for you or for help to invest your own wealth, talk to our advisors at FM Capital Group. Would you like more information on how to get stocks and commodities in your portfolio? Schedule a meeting with us here.