fbpx

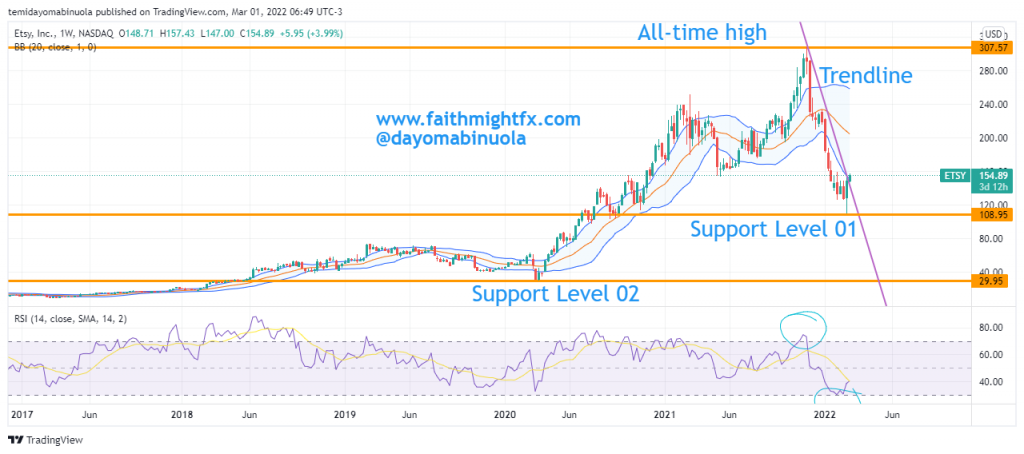
Etsy Dips To A New Low


Etsy is an American Vintage e-commerce company focused on handmade and vintage items and craft supplies. Etsy was founded 16 years ago and went public about 7 years ago at $16. On the day of the IPO, the share price rose by 72%. After 9 months of its launch on the stock exchange, it took a bearish turn and hit an all-time low at $6.04.


From January 2016, $ETSY share price took off in the bullish wave. In November 2021, Etsy’s price reached a new all-time high at $308.96. That high reflected on the RSI as an “overbought” indication. Following that all-time high, the share price fell and so far, the share price has lost 65% of the price of the all-time in November 2021. The most recent price dip did not indicate oversold on the RSI despite the 65% fall in price. The crisis between Russia and Ukraine has not really affected the US stocks as $ETSY has been appreciating from the new low at $108.53 for the past two weeks. This appreciation could lead to a long-term rally that could see $ETSY gaining 100 points.

Some of these ideas are in our clients’ portfolios. To understand if this one can work for you or for help to invest your own wealth, talk to our advisors at FM Capital Group. Would you like more information on how to get stocks and commodities in your portfolio? Schedule a meeting with us here.

Fastly Loses Big 

Fastly is an American cloud computing services provider, which is designed to help developers extend their core cloud infrastructure to the edge of the network, closer to users. The stock had its IPO in the spring of 2019. After surging in its debut and eventually doubling from its IPO price in the early fall, shares went down over 35% from their highs in the fourth quarter, putting many post-IPO investors in the red. $FSLY stock started trading at $21 per share. Fastly said it had sold 11.25 million shares at $21 each, raising $180 million. Fastly investors are back to the initial stage. 

Before the current downturn of Fastly, the IPO investors made over 6x since its IPO. The all-time high of Fastly was in October 2020 at $136.45.  The price of Fastly is currently trading at $20.27, a few points below the IPO price of $21.50. At the beginning of this week, $FSLY opening price was $27.70. Fastly has lost over 27% of its value from the beginning of the week. Until certain measures are taken before $FSLY share price could rally, though a gap-down has occurred which might be filled soon. Since the January 2021 monthly candlestick finished with a bullish one, only June and October monthly candlesticks finished on a bullish note, all other ones have been bearish. 

Some of these ideas are in our clients’ portfolios. To understand if this one can work for you or for help to invest your own wealth, talk to our advisors at FM Capital Group. Would you like more information on how to get stocks in your portfolio? Schedule a meeting with us here.

Meta Share Slumps, The Worst Day Fall For Any Stock

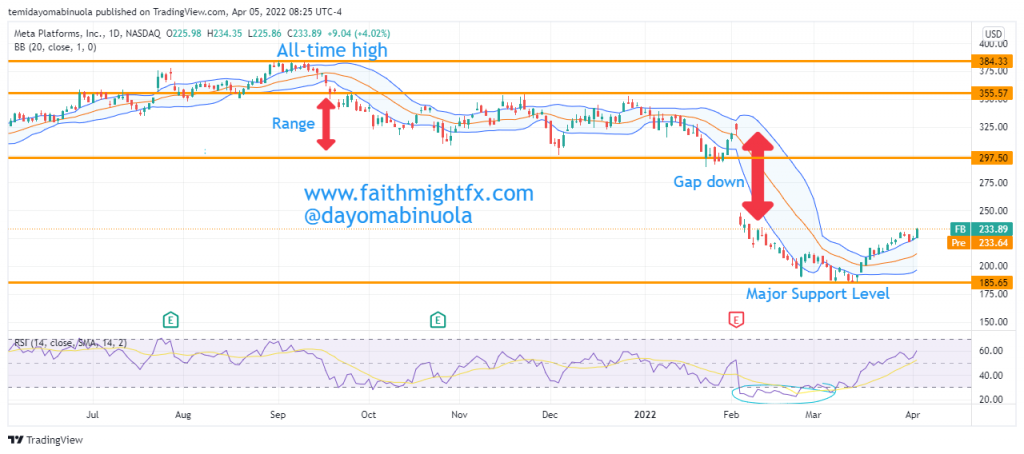
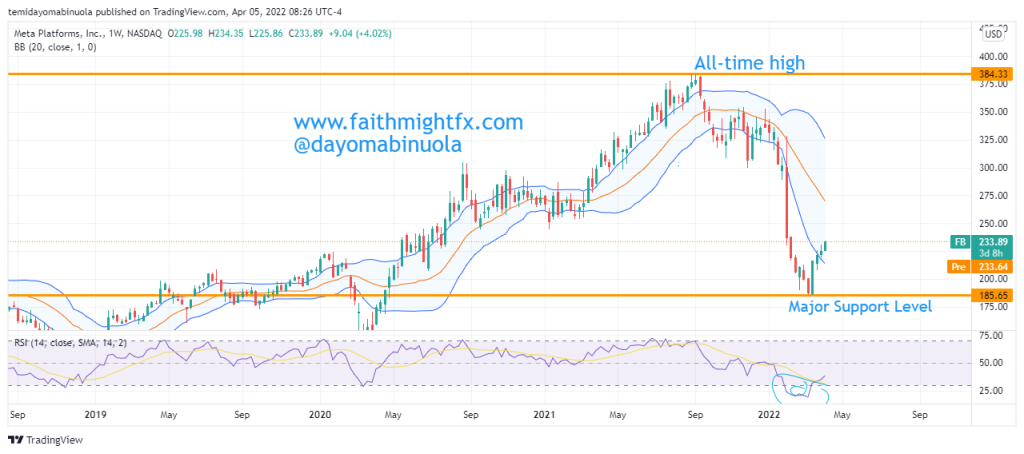
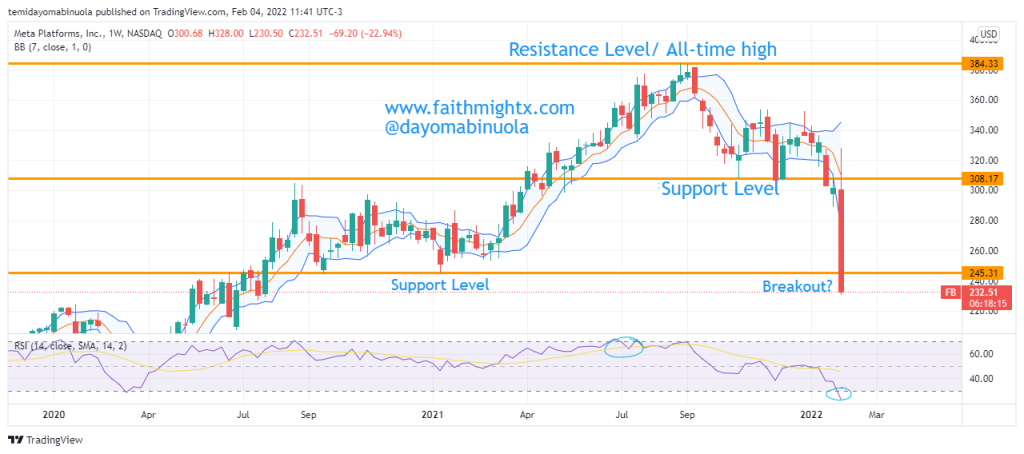
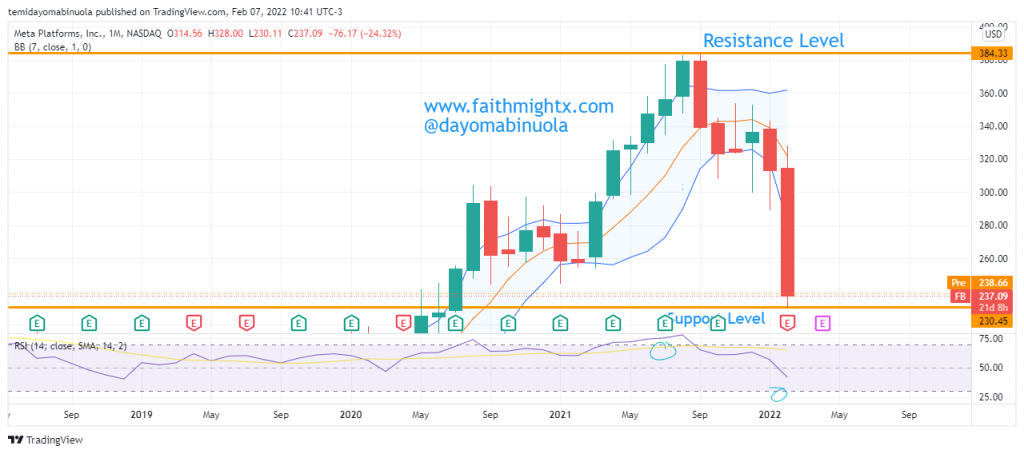
The Facebook parent company, Meta Platform Inc plunged 26% last week Thursday after the release of poor earnings results. About $251.3 billion in market value was wiped out, making it the biggest daily loss for any U.S. company ever. As a result of this fall, Mark Zuckerberg lost over $30 billion. This massive fall of Meta made other tech stocks fall, the likes of Twitter, Snap, and Pinterest.

Weekly Chart

In the year 2021, the opening price of Meta was $274.79 and closed at $332.46. The appreciation in price put smiles on the faces of investors. Now, the reverse is the case this year. The opening price of the Meta stock was $338.26 but now the price is at $237.01, which is a 30% loss from the year’s opening price. Long-term investors have nothing to fear about the most recent dip in the price of Meta. In the coming weeks, the price could rally to $381, which will eventually lead to a new all-time high.  There was a gap down when the market opened last week Thursday as a result of the earnings report. On Friday, Meta’s loss increased because of the continued bearish turn, but at the end of the trading day, there was a rally that formed a Doji. RSI using the daily time frame shows that price has been oversold, which could lead to a possible reversal.

Monthly Chart

Some of these ideas are in our clients’ portfolios. To understand if this one can work for you or for help to invest your own wealth, talk to our advisors at FM Capital Group. Would you like more information on how to get stocks in your portfolio? Schedule a meeting with us here.

Microsoft Appreciates After Earnings Report

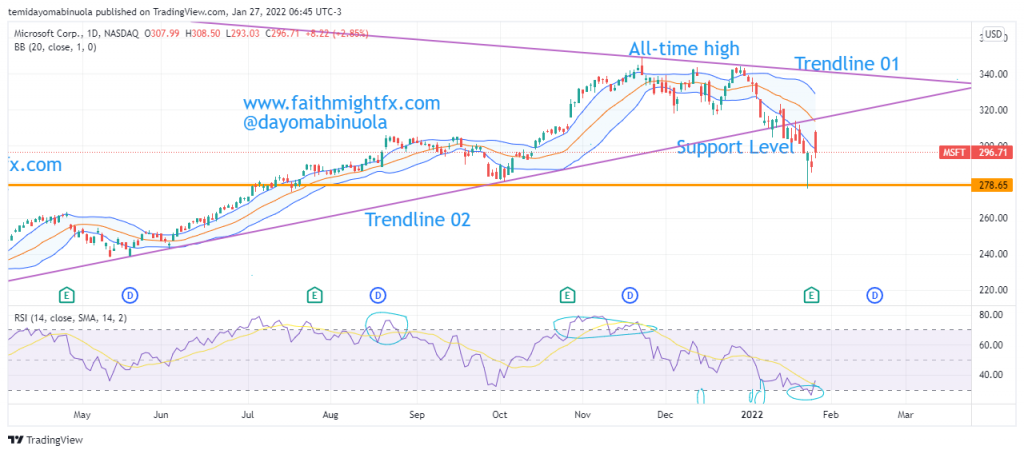
Microsoft reported earnings beat analyst expectations. The earnings per share came in above what analysts had forecast, rising 22.2% year over year. Revenue also surpassed analyst estimates, up 20.1% compared to the same quarter one year ago. Microsoft’s opening price at the beginning of 2022 was $335.87. The price has since fallen to $296.71, making it the worst monthly fall ever. That is an 11% decline since the beginning of the year.

Daily Chart

Furthermore , the company’s shares fell as much as 5% in post-market trading on Wednesday. Over the past year, Microsoft’s shares have made a return of 26.7%. The share price of $MSFT reached an all-time high at $349.69 in November 2021. Before the global market tanked a few days ago, the price had been ranging since that all-time was reached. The price of $MSFT reached $276.02 on the 24th of this month before a price correction. The last time price of Microsoft was at the $276.02 level per share was back in July.

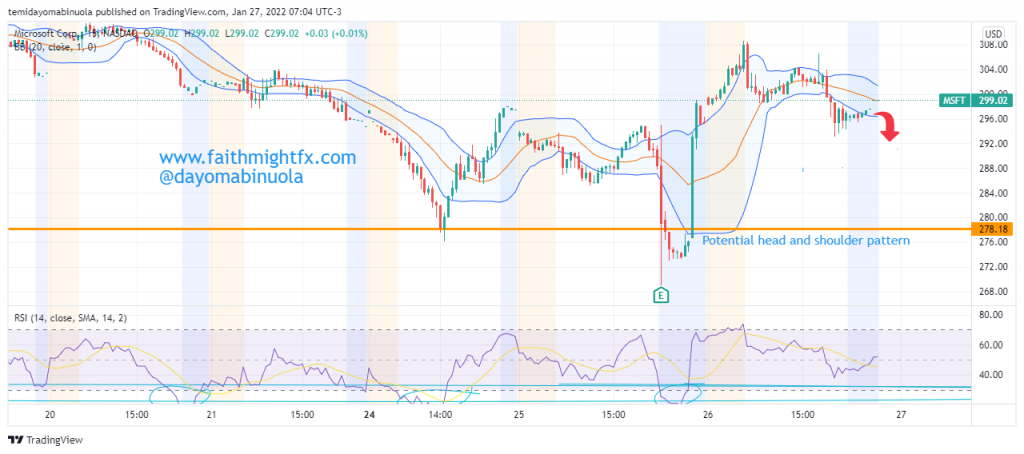
15mins Chart

The 15mins time frame is showing that an inverted head and should pattern is about to form, which, in the long run, leads to a massive bullish run. In the next few days, the price should fall to complete the head and shoulder. If this is completed, the price could reach $339.98. The market opened yesterday after a gap-up but closed on a bearish note. The global market has been very bad this week. The next rally might just be what investors have been waiting for since the holidays are over. The RSI daily chart already shows that the price has been oversold. This could be the indication the bulls are expecting.

Some of these ideas are in our clients’ portfolios. To understand if this one can work for you or for help to invest your own wealth, talk to our advisors at FM Capital Group. Would you like more information on how to get stocks in your portfolio? Schedule a meeting with us here.
Virgin Galactic’s Price Falls To IPO, Loses Big

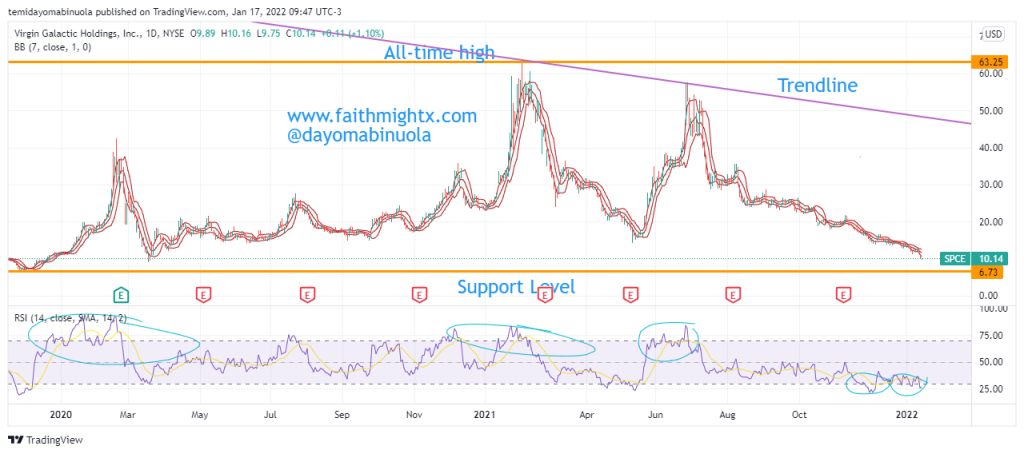
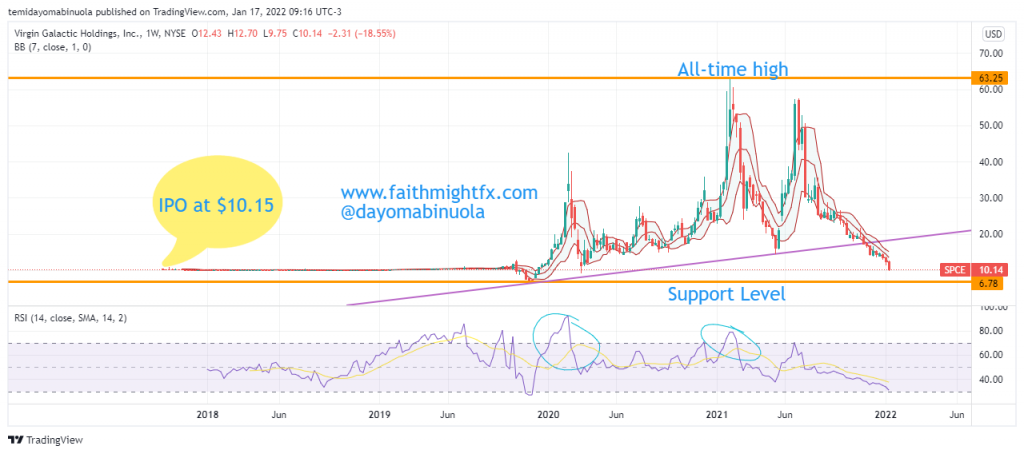
Virgin Galactic is an American spaceflight company founded by the Billionaire, Richard Branson with its headquarter in California, USA and operates from New Mexico. The company is developing commercial spacecraft and aims to provide suborbital spaceflights to space tourists. It had its IPO in the NYSE in September 2017 with the price at $10.15. The price was stable till October 2019, when the price fell a bit to $6.98. This price correction led to a huge rally in price to the all-time high before the global lockdown at $42,64. During the lockdown, the price fell to $9.18 which was about an 80% loss in value, the price recovery moved the price to $63.25.

Daily Chart

On 11 July 2021, Branson and three other employees rode on a flight as passengers, making them the first to travel on his own ship into outer space (according to the NASA definition of outer space beginning at 50 miles above the Earth). Since this event, $SPCE has lost about 50% in value. The share price was expected to rally, but the price continued to fall since the first flight.

Weekly chart

Regular paid passenger service flights have been scheduled to begin this year 2022 after two more test flights have been completed. The share price has fallen from the all-time high at $62.50 to $10.14, which is approximately an 84% loss.  The current price is at $10.14  which is very close to the pandemic lowest price was at $9.05.  The share price might rally as $SPCE prepares passengers flights this year. The rally might reach $43.49, which is about 3X of the current price at $10.14. On the weekly chart, price is still at the lower region of the Bollinger bands and RSI gives no indication of the price being oversold. On the other hand, the Daily chart has multiple indications that the price has been oversold.

Some of these ideas are in our clients’ portfolios. To understand which ones can work for you or for help to invest for your own wealth, talk to our advisors at FM Capital Group. Would you like more information on Investment Advisory, Portfolio Services, and VC? Schedule a meeting with us here.

Microsoft Bounces From The Year’s Support

After the all-time high of Microsoft was reached on the 22nd of November, 2021, the price has continued to drop from the highest close on the 28th of December 2021 at $343.00. From the trendline drawn from the all-time high in 2021, the price is yet to break it to the upside. Microsoft investors have little or nothing to worry about, as the price has appreciated in the last two decades. 

1hr Chart

Just recently, Microsoft hired a top Apple Engineer, Mike Filippo, to work on custom chips as it looks to expand its own server-chips efforts, according to people with knowledge of the matter. Filippo’s exit is a huge loss to Apple after he has served as a top designer of semiconductors at ARM for a decade. Microsoft’s 2022 opening price was $335.24. The $MSFT bulls have failed to show up since the holidays were over. Price keeps falling as low as $304.78 on the 10th of January, 2022, making it the year’s support level. A gap-up occurred yesterday from $315.06 to $319.57.  This might lead to price recovery as our analysts look forward to the price of Microsoft reaching $341.48.

Daily Chart

There is no indication of price reaching a new all-time high as we look forward to receiving the earning report of Microsoft on the 25th of January 2022. On the daily chart, RSI shows the price is overbought while on the 1hr chart price is currently oversold. The hire of Filippo might boost the share price of Microsoft in the coming weeks. The trendline 01 on the chart shows that price is on a bull trend despite the bad start in 2022. RSI though shows price is overbought on the chart.

Some of these ideas are in our clients’ portfolios. To understand which ones can work for you or for help to invest for your own wealth, talk to our advisors at FM Capital Group. Would you like more information on Investment Advisory, Portfolio Services, and VC? Schedule a meeting with us here.
Apple Market Cap Hits $3Trilliion

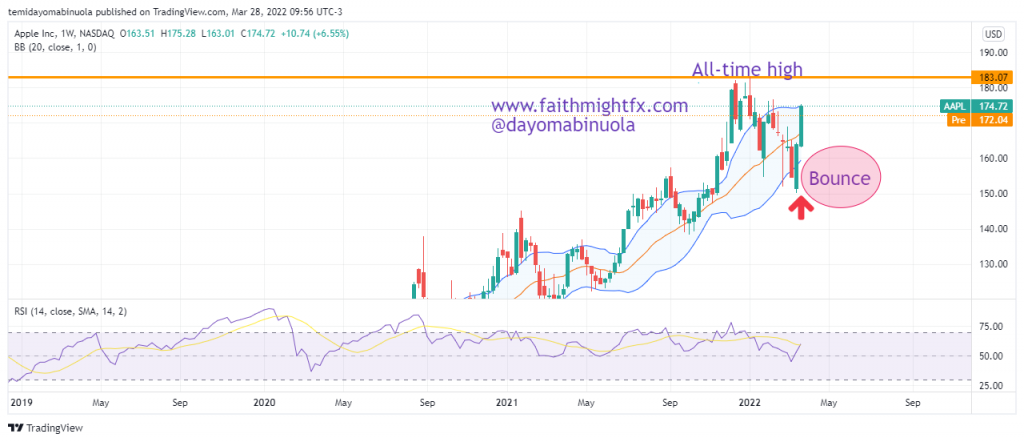
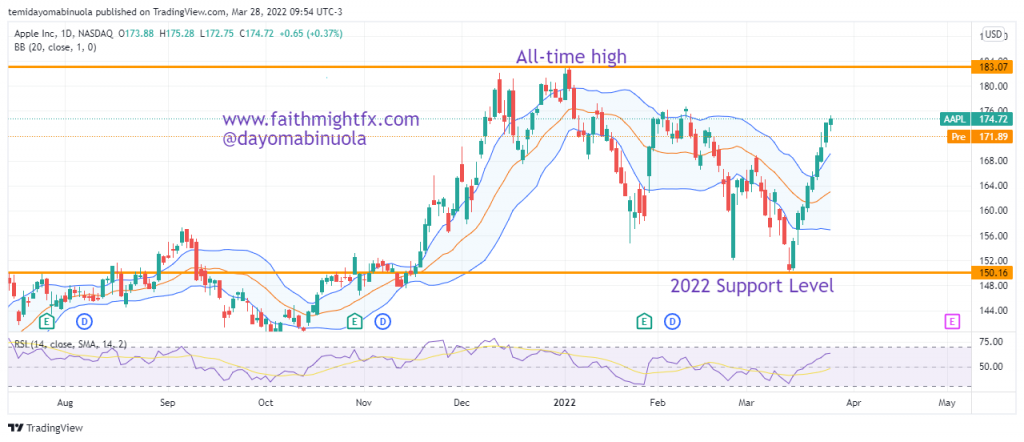
Apple becomes the first company in America to reach the new milestone of $3Trillion Market Cap.  The technology company has done tremendously since the pandemic. The pandemic lowest price was $53.32. The current price stands at $179.70 which is a day after the all-time high at $182.93 was reached. Therefore, investors have gained about 3x since the pandemic low.  Since Tim Cook became the CEO of Apple on the 24th of August 2011, there has been a massive rally in the share price of Apple. He has been able to achieve about 10X in the last decade. The market cap has jumped from $340billion to $3Trillion.  Apple investors have been enjoying a jolly ride due to good leadership. 

Weekly Chart


In December 2021, our analysts concluded that the price of $AAPL should reach a new all-time high, which might eventually take the market cap to $3Trillion as a result of continuous profit-making. Going forward, a correction might occur which leads to the market cap dropping from $3Trillion. Apple’s share price might drop about 18% in the coming weeks, which might eventually bring the share price down to $149.07, a level below the September 2021 all-time high of $157.55. Since the latter months of 2019, the price of Apple has been overbought multiple times, as the price only had a few corrections. Meanwhile, there is no indication of price reversals.  

Daily Chart

Some of these ideas are in our clients’ portfolios. To understand which ones can work for you or for help to invest for your own wealth, talk to our advisors at FM Capital Group. Would you like more information on Investment Advisory, Portfolio Services, and VC? Schedule a meeting with us here.
Amazon’s Price in a Range

Amazon is an American multinational conglomerate that focuses on e-commerce, cloud computing, digital streaming, and artificial intelligence. The stock has done well for investors in the last decade, as an investment in $AMZN has generated over 19X. The share price of Amazon has maintained a resistance level at $2044 since September 2018, but the price broke out the resistance level to the upside in February 2020 to a new all-time high at $2913.18. After the break-out, there was a price correction before a major rally began to a new all-time high at $3770.49 and the support level is maintained at $2883.53.

Daily Chart

Since a support level was formed at $2883.53, the price of $AMZN has failed to break the support level to the downside as the price has been ranging between the support level and the all-time high at $3770.49 since mid-2020. Unfortunately, an Amazon warehouse was hit by a tornado, this week killing six, and an activist group targeting Exxon. In July and November of this year, $AMZN has formed a double top, could this be an indication of a correction. Using Amazon to shop could be a major option for shoppers if covid cases increase with the new variant ‘Omicron’, as the lockdown may be re-imposed.

Weekly Chart

RSI has shown that price has been overbought since the ease of lockdown in 2020. Despite the rally around to the all-time high at $3770.49, the price has crossed to the lower region of the Bollinger bands this month. For long-term investors, Amazon could be a good deal, just as it has done in the last decade.

Some of these ideas are in our clients’ portfolios. To understand which ones can work for you or for help to invest for your own wealth, talk to our advisors at FM Capital Group. Would you like more information on Investment Advisory, Portfolio Services, and VC? Schedule a meeting with us here.
Apple Investors Continue To Make Profit

This week is the best week so far for Apple since the beginning of the year. The share price appreciated on Wednesday by over 2.8%. It has been up 8% this week and about 6% this month. The supply chain shortages are getting worse though as Apple completely stops iPhone production in China for the first time in a decade.

Daily Chart

Just like many other stocks, Apple’s share price dipped during the lockdown from then $81.53 to $53.65, which was a 34% loss in value at that time. As the lockdown was eased last year, the price has continued to rally from the lowest price level at $53.65 to a new all-time high this month at $176.65. That is over 2X gain since the ease of lockdown. The last year has been the best year for the Apple investors as more gains are made. The current market cap for Apple is $2.86 trillion. Apple could be the first company to reach the $3trillion market cap.

Weekly Chart

Now that Apple has completely stopped the production of Iphones in China, this might lead to the share price taking a break from the rally. Apple has been sued over Apple watch defect that poses hazards to customers. RSI has shown that the price has been overbought twice between November and December. Price is currently in the upper region of the Bollinger bands, a correction might occur if the Omicron virus poses a major threat to the global populace.

Some of these ideas are in our clients’ portfolios. To understand which ones can work for you or for help to invest for your own wealth, talk to our advisors at FM Capital Group. Would you like more information on Investment Advisory, Portfolio Services, and VC? Schedule a meeting with us here.

Why Did Pfizer Lose 5% In Value?

Pfizer is an American multinational pharmaceutical and biotechnological corporation. The company was established in 1849 and went public at the beginning of 1968 at an opening price of $0.42. Over the years, the share price of Pfizer has appreciated in several multiples. The Pfizer investors have enjoyed a rally over the years as the price keeps appreciating. The previous all-time high at $44.01 was reached in 2018 and maintained until the price broke out to the upside to new all-time highs in August 2021 and December 2021 respectively. Pfizer was licensed to produce the vaccine as a result of the necessity caused by the spiking cases of coronavirus across the world. Despite the share price of Pfizer going low as $26.37 in 2020, after it reached the all-time high in 2018 at $44.01, millions of persons worldwide got vaccinated with the Pfizer vaccine which must have led to the share price appreciating.

Weekly chart

The most recent all-time high of $PFE was reached in November 2021 at $55.83. Some scientists might have been saying that the Omicron variant of the coronavirus is of less concern. Just like many vaccine-producing companies, $PFE’s share price dropped 5.14% yesterday. Despite a few lockdowns across the world and some countries restricting flights from some other countries, there seems to be a correction occurring with the price of $PFE. The share price of Pfizer might drop to $41.93 which is around the previous support level at $41.10, as some scientists have said the Omicron variant is not of major concern.

4hr Chart

Some of these ideas are in our clients’ portfolios. To understand which ones can work for you or for help to invest for your own wealth, talk to our advisors at FM Capital Group. Would you like more information on Investment Advisory, Portfolio Services, and VC? Schedule a meeting with us here.