fbpx

Carnival Corporation Share Price Bounces from Support Level

Carnival corporation &plc is a British-American cruise operator with a combined fleet of over 100 vessels across 10 cruise line brands. Carnival corporation had its IPO in July 1987 at $3.94 per share. Carnival corporation is listed on NYSE and LSE. As of this year, the total staff of Carnival corporation stands at 150,000.

Daily Chart

Carnival corporation & plc announces offering of $1.25 Billion for refinancing to be issued by Carnival Holdings in Bermuda. This news could have been the reason for an uprise in the price of Carnival yesterday, with 11.14% appreciation in price.

Weekly Chart

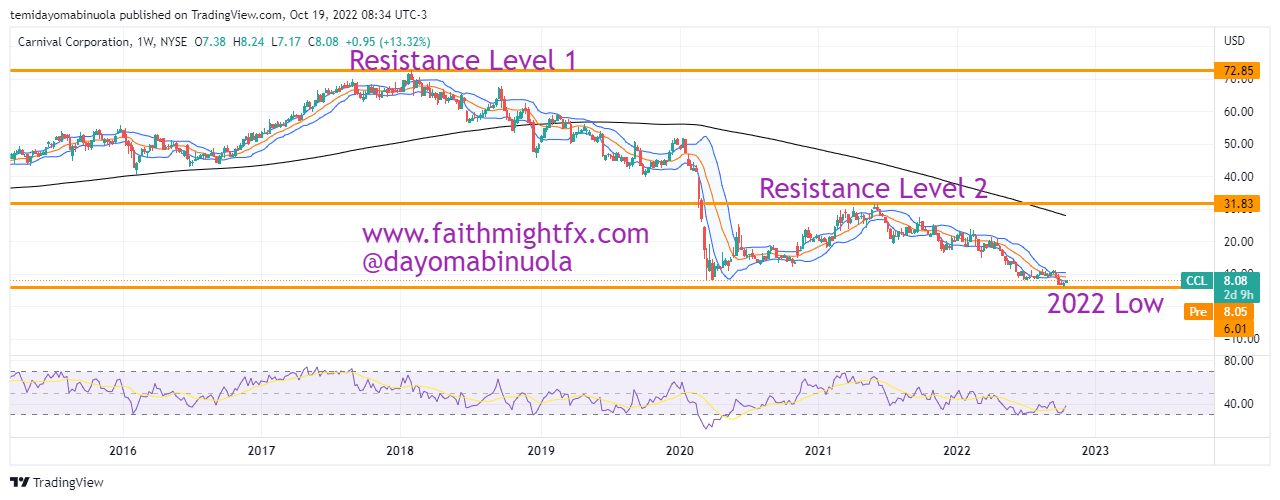
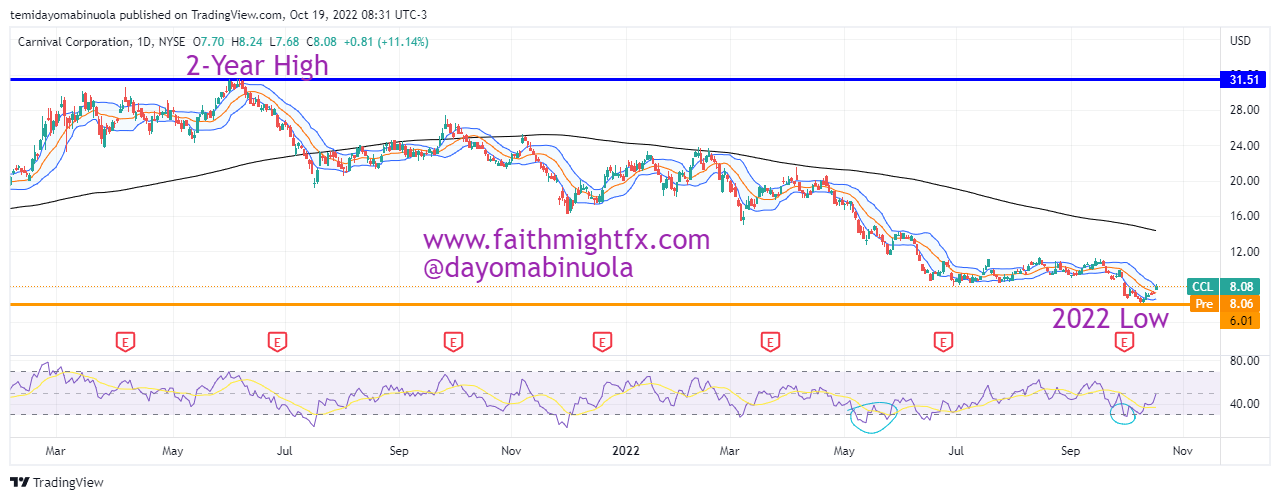
Over the years as price rallied, $CCL reach an all-time high in January 2018 at $72.85 and fell to $8.08 as a result of the 2020 pandemic. Post-Lockdown, a rally to $31.83 occurred in 2021, which currently stands as a a two-year high. Before the 11.14% rally yesterday, the price of $CCL fell to $5.89, which makes it the lowest price since 1991. We might be seeing a rally to $11 in the coming weeks from its current price at $8.08.

Some of these ideas are in our clients’ portfolios. To understand if this one can work for you or for help to invest your own wealth, talk to our advisors at FM Capital Group. Would you like more information on how to get stocks in your portfolio? Schedule a meeting with us here

Archaea Energy Gains Over 50% In One Day

Archaea Energy is one of the largest renewable natural gas producers in the United States with an industry leading RNG platform and expertise in developing, constructing and operating RNG facilities to capture waste emissions and convert them into low-carbon fuel. 

Monthly Chart

Archaea Energy had its IPO in December 2020 at $11.50 per share. The first four months of its IPO closed bearish until the bulls took over at the beginning of the second quarter in 2021 as price reached a new high in June 2021 at $18.61. The highest point Archaea’s share price reached in 2021 was $21.95 and the closing price for the year was $18.28.

The first four months of 2022 was majorly bullish as Archaea Energy attained a new high at $23.75 in April 2022. The following month was followed by a bearish turn which resulted in price reaching a current year’s low at $12.62 in June 2022. A rally then commenced from the year’s low to an all-time high of $26.12 on October 17, 2022 which was as a result of a gap up.

Weekly Chart

This gap up is the result of a recent announcement by British Petroleum of its plans to expand into bioenergy by acquiring Archaea Energy for approximately $4.1Billion. The gap up led to a 54.15% appreciation in Archaea Energy’s share price which is the highest rally in a single day since its IPO. As a result of the rally, RSI is currently overbought on the daily chart which might lead to a correction in price and this correction might reach $24.

Some of these ideas are in our clients’ portfolios. To understand if this one can work for you or for help to invest your own wealth, talk to our advisors at FM Capital Group. Would you like more information on how to get stocks in your portfolio? Schedule a meeting with us here

Snapchat Loses 39% Of Share Value In 24 hours

Snapchat had its IPO in March 2017 at $24. The first two trading days closed with the bulls in charge. The third trading day had the bears gaining traction and this traction transitioned into a full-blown bearish run up until December 2018. In that month of December 2018, Snapchat share price hit $4.88, which stands as the all-time low.

Monthly Chart

2019 began on a brighter note in comparison to the previous year as the first seven months of 2019 closed bullish. This bull trend couldn’t complete a year-long run as price ranged between $12 and $18. A few months into 2020, precisely in April, the bulls became active while price was about $11. On the monthly chart, a bullish steam picked up and it raved on until Snapchat’s share price hit $83, which stands as the all-time high. This all-time high was reached in September 2021.

Weekly Chart

Ever since this all-time high was hit, Snapchat’s share price has been falling heavily. Since September 2021 till date, all monthly candlesticks have closed bearish except for February 2022. So far, Snapchat has lost over 87% of its all-time high. Since May 24 2022, the price of Snapchat has been ranging between $11 and $15. 

On the 22nd of July, 2022, a gap down occurred that resulted in a 39% loss in value as price fell from $16 to $9.97. The last time price got to this level was in March 2020 during the lockdown. In the next few weeks, we could see price rallying above $20 as price is currently oversold on the RSI.

Some of these ideas are in our clients’ portfolios. To understand if this one can work for you or for help to invest your own wealth, talk to our advisors at FM Capital Group. Would you like more information on how to get stocks in your portfolio? Schedule a meeting with us here

ETSY Loses More Than 8% In One Day

Since the all-time high of Etsy was reached in November 2021 at $309.06, price has continued to dwindle as it has lost over 75% of its all-time high. The price of Etsy at the beginning of 2022 was at $222. Etsy has not recorded any profits this year as price has kept falling from the opening price of the year.

Daily Chart

Etsy’s share price is currently at $74.04 and the current support level sits at $66.98. Earlier in the year, precisely between February and April, there was a range in price between $113 and $164. The price broke out late in April which led the price to reach its current support level in mid-June 2022. This support level was last reached in May 2020.

Weekly Chart

On the daily, weekly, and monthly charts, there are no indicators of price being oversold on the RSI. Could this be an indication of a possible continued downward run of Etsy’s share price keeping in mind that on the 28th of June, 2022, the price opened at $79.11 and closed at $74.04 which was an 8% loss in just a single day? On another hand, candlesticks on the daily time frame indicate that price has been consolidating. From our analysis, we see the bears continuing to push the price lower despite the consolidation.

Some of these ideas are in our clients’ portfolios. To understand if this one can work for you or for help to invest your own wealth, talk to our advisors at FM Capital Group. Would you like more information on how to get stocks in your portfolio? Schedule a meeting with us here

Block, Formerly Square, Loses More Than 50% Of Its Value In 2022

Since the price of Block reached its all-time high in August 2021 at $289.05, the bears have aggressively taken over the market. The monthly chart of $SQ throughout the year 2021 showed a ranging market. The price at the beginning of Q4 2021 was at $255.88. Q1 2022 began at $162.87, that’s about $100 loss in the space of one quarter. We wrote an article in December 2021 of a continued bearish trend of $SQ. At the time the article was written, price of $SQ was at $192.15. The price of Block as of 9th of June 2022 closed at $76.58.

Monthly Chart

Will the price of $SQ fall to the 2020 lockdown lowest price at $34.28? The company has lost 9.64% in the last 24hrs, lost 7.85% in the last 7 days and in the last one year, it has lost 63.57%. The market cap of the company is currently at $44.45billion. There are still no hopes of price rallying soon as price might still continue to range or fall further in the coming months. Investors have no choice at this time but to be patient as the effect of the newly introduced blockchain technology to $SQ could make the price rally in the second half of 2022.

Daily Chart

Some of these ideas are in our clients’ portfolios. To understand if this one can work for you or for help to invest your own wealth, talk to our advisors at FM Capital Group. Would you like more information on how to get stocks in your portfolio? Schedule a meeting with us here

Coca-Cola Share Price Jumps

After the full takeover of BodyArmor by Coca-Cola in November 2021, the share price of Coca-Cola had a brief bullish run that took the share price from $56.29 in November 2021 to $67.11 in April 2022, which now stands as the current all-time high for Coca-Cola. 

Daily Chart

In the month of May 2022, Coca-Cola’s share price dipped from the all-time high down to $62.66. Price rallied shortly afterward and the price reached $66.39. The bears counteracted the rally as the price was pushed down to $59.66. $59.66 is the current support level. In the week of May 23rd, the price rallied and the bulls were able to get the price to $64.68 which was the closing price for the week.

Weekly Chart

This recent bull run might not be maintained as the bears might overpower the bulls and push price lower to reach $60. If the price eventually breaks $60 to the downside, the price might continue to fall further.

Some of these ideas are in our clients’ portfolios. To understand if this one can work for you or for help to invest your own wealth, talk to our advisors at FM Capital Group. Would you like more information on how to get stocks in your portfolio? Schedule a meeting with us here

Tesla Share Price Continues To Fall

Since April 2020, the charts on Tesla have been bullish. This upward trend occurred in spite of the pandemic that crashed many stocks. The price at the beginning of the bull run in April 2020 was $100 per share after the stock split. (Please note that all prices are quoted since the stock split in August 2020). This continued until the end of the year despite little corrections in between. The $TSLA price soared on this bullish energy to an all-time high of $1,245 in November 2021.

Daily Chart

There has been a huge correction since the all-time high in November 2021 as price has been falling. This bearish run saw a little bullish movement which occurred in March 2022 with the price experiencing a temporary rally. The bulls, however, were counteracted by the bears and the price continued its downward trend.  In Q4 2021, our analysts concluded that the share price of Tesla could go below $1000 after reaching a new high at $1092 in October 2021.

Tesla’s price is currently at $709.81 per share. The worst closing price on the monthly chart since May 2021 was $625. This bearish run might push the price down towards $600 per share. RSI has indicated that the price has been overbought on both the weekly and monthly charts since November 2021.

Monthly Chart

Some of these ideas are in our clients’ portfolios. To understand if this one can work for you or for help to invest your own wealth, talk to our advisors at FM Capital Group. Would you like more information on how to get stocks in your portfolio? Schedule a meeting with us here

Netflix To Rally Despite Sudden Price Dip

Netflix reached its all-time high at $701 in November 2021. Since then, the price has plummeted dramatically over the last 5-6 months. This huge slump has taken the price to $218, making it the worst fall ever. This fall is about a 70% loss from the all-time high of $701. As a result of the price fall, Netflix investors are yet to make a profit this year.

Daily Chart

On the daily chart, a gap down occurred on January 21, 2022, from $507 to $399 and the price is yet to retrace. In the process of the price falling during this gap down, it hit a target we forecasted in an article we published in August 2021. Another gap down occurred on the daily chart on April 20, 2022, from $333 to $246. As of April 21, 2022, the price closed at $218 as a consequence of this last gap down, thereby making $218 the most recent support. Price last hit this point in January 2018.

Weekly Chart

In the last few days, $NFLX reported a loss of over 200,000 subscribers in Q1 2022. There are speculations that Netflix will lose over 2million customers in Q2 2022. Despite speculations, we foresee a price rally and we expect both gap-downs to be filled. This price rally should take the price to $387.

Some of these ideas are in our clients’ portfolios. To understand if this one can work for you or for help to invest your own wealth, talk to our advisors at FM Capital Group. Would you like more information on how to get stocks in your portfolio? Schedule a meeting with us here.

Procter & Gamble To maintain Bullish Trend

The consumer goods giant has been listed on the NYSE for over 40 years and has accrued huge gains over the decades. Looking at the monthly charts since the IPO, there have been several higher lows and higher highs which is a fundamental characteristic of a bull market. Analyzing the monthly chart, there have never been indications on the RSI that the price has been oversold.

Monthly Chart

Generically speaking, fast-moving consumer goods are low-cost and often affordable which typically makes FMCG companies record-high revenues. Also, consumer goods are products that the population “consumes” and uses up very fast hence the name “fast-moving”. This makes consumer goods sell very quickly and inevitably increases the revenue made by the FMCG companies. Since 1978, the world’s population has increased by over 3 billion people. This data corroborates the success of FMCG firms particularly a firm like P&G which has been in the industry for decades and is considered a global leader in the FMCG industry.

Like other stocks, $PG experienced a fall in 2020 as the price moved from the pre-Covid price of $128 to $94 during the lockdown. Post-Covid price was able to rise to a new all-time high in December 2021 at $164. But then, it rose again to another new all-time high at $165 in January 2022. After this all-time high in January 2022, the price fell to $142 in March 2022 which currently serves as the year’s support. 

Daily Chart

Price has been able to bounce from the support to the current price at $160. This rally is expected to continue and the price could break out of the current resistance level at $165 which will invariably lead to a new all-time high.

Some of these ideas are in our clients’ portfolios. To understand if this one can work for you or for help to invest your own wealth, talk to our advisors at FM Capital Group. Would you like more information on how to get stocks in your portfolio? Schedule a meeting with us here.

Investors To See Share Price Increase As Delta Airlines Makes New Policy

Since Delta Airlines hit its all-time high in July 2019 at $63, the bears have been significantly active as price plummeted to $17 in May 2020. The global lockdown played a huge role in this nosedive as it did for other airlines like Virgin Atlantic and Southwest Airlines. Following the global roll-out of vaccines and the subsequent ease of the lockdown in the last quarter of 2020, the $DAL share price got a reasonable boost that pushed the price above $50.

Weekly Chart

Recently, Delta Airlines announced a New Policy Shift that was targeted at easing travel fares for flights with high price tags. This loyalty program was run all through 2021 and still continued this year but it was meant to be temporary. However, the airline has now announced that the benefits from this loyalty scheme will become permanent. According to the announcement, Delta Airlines will be the first airline in the industry to announce this type of benefit.

Daily Chart

This year, the resistance for $DAL has been maintained at $45.20 while the support level is at $29.84. This new policy is expected to influence the movement of the share price to the upside. Although there are several Dojis in the upper region of the Bollinger Bands, the bulls could steal the trend and as a result, the price could rally. This rally might push the price above $50 which is over a 35% increase from the current price of $37.

Some of these ideas are in our clients’ portfolios. To understand if this one can work for you or for help to invest your own wealth, talk to our advisors at FM Capital Group. Would you like more information on how to get stocks in your portfolio? Schedule a meeting with us here.