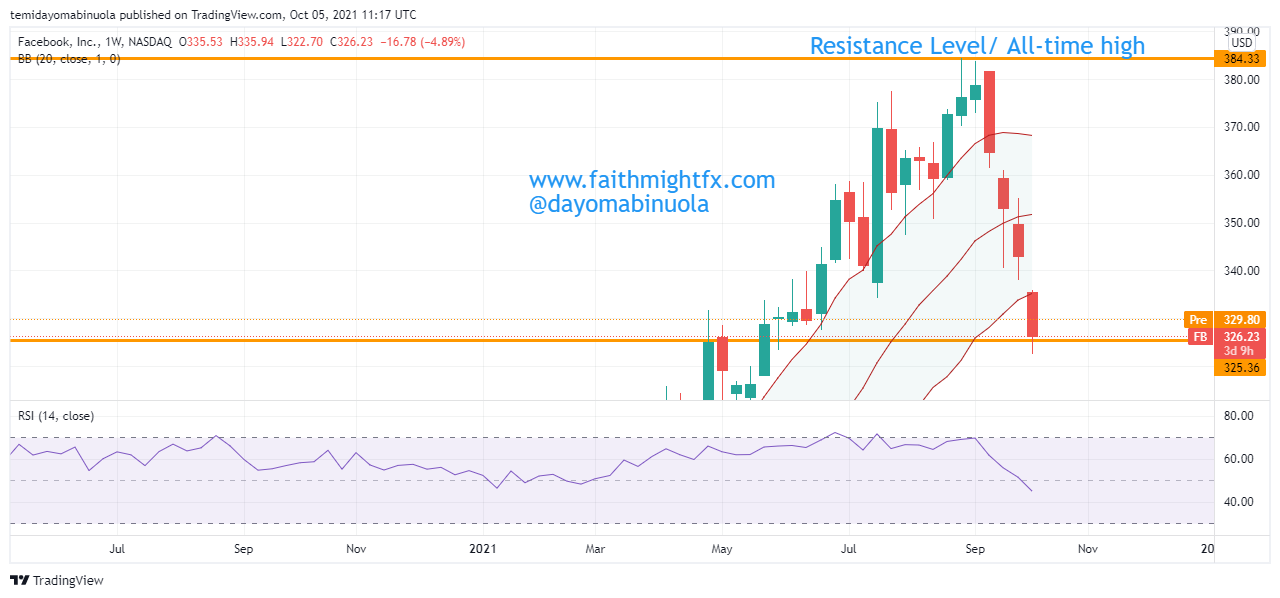
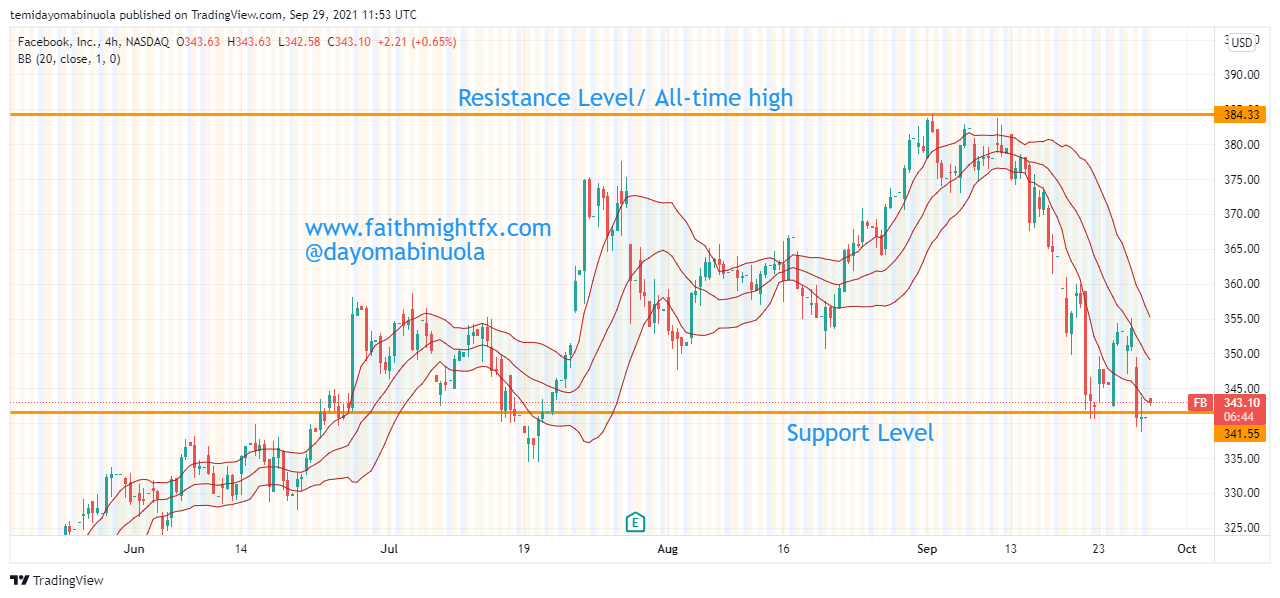
The Facebook share price has been enjoying a smooth ride as the bulls were able to take the price to an all-time high in September. After the all-time high was reached at $384.33, the price fell to $338.90. For the past 4 trading days, the price has been consolidating around the support level at $338.90, but the unusual happened yesterday as there was an outage. This outage affected the three-platform owned by Mark Zuckerberg i.e. Whatsapp, Facebook, and Instagram for about 6hours. Bloomberg gathered that the global service outage that kept its social media apps offline for much of Monday on a problem with its network configuration, adding that it found no evidence that user data was compromised during the downtime.
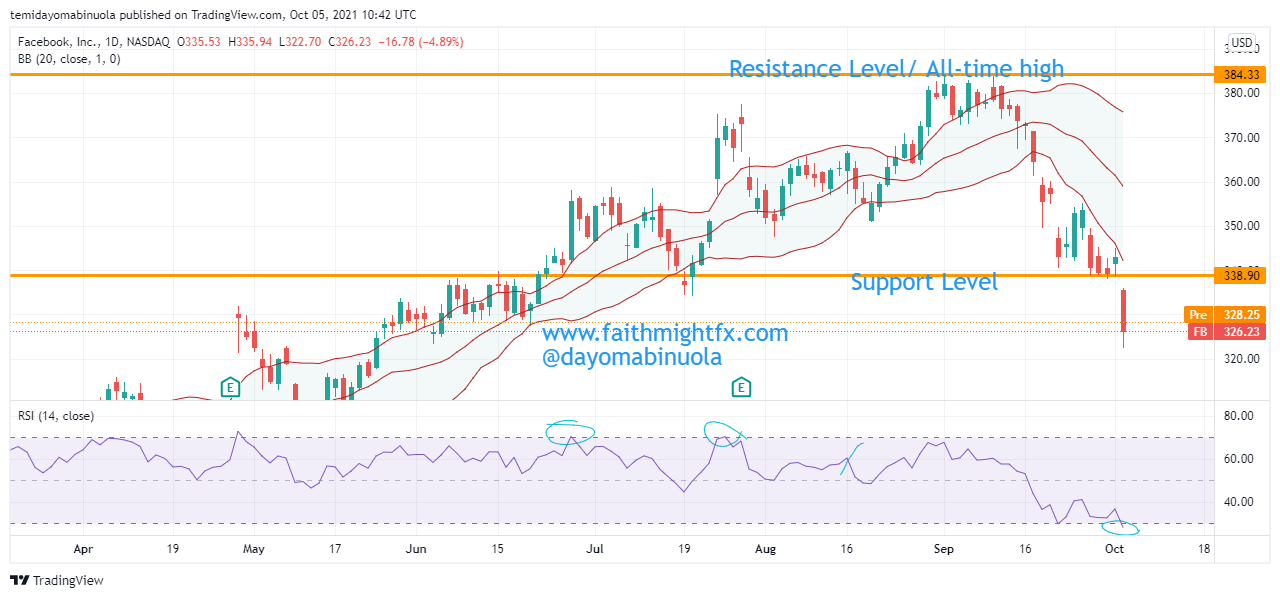
The $FB market opens at $335.75 yesterday and the price went as low as $322.25, but the market closed at $326.23. There is a rise in the pre-market price as the price is currently at $328.25. Taking a looking a weekly chart, the price was already overbought on the RSI, the outage only brought about a correction in price. The last 3 trading weeks show the price of $FB has been falling prior to the outage. A gap down occurred at the end of the second trading week in September, price is yet to retrace to the gap down. Also, yesterday’s opening price was after a gap down. Investors should be hopeful, as the price could retrace in the coming weeks to the second, then the first gap down.
The share price of $FB is currently at the lower region of the Bollinger bands. As normalcy is restored to the various platforms owned by Facebook Inc, we hope the price of $FB will begin to rise.