fbpx

Facebook Bears Might Be Getting Out Of The Market

The second half of 2018 went sour for Facebook investors when a long dip began in July. Share price moved upward to reach 218.11 and fell to 123.25. $FB has enjoyed a smooth ride in the past few years without much hassle until the dip. The fall was at 43.5% which was the worst fall in the history of $FB shares. Most of the stocks in the market fell towards the end of 2018. Technically, an M sign has been formed holding on to a strong support at 123.25.


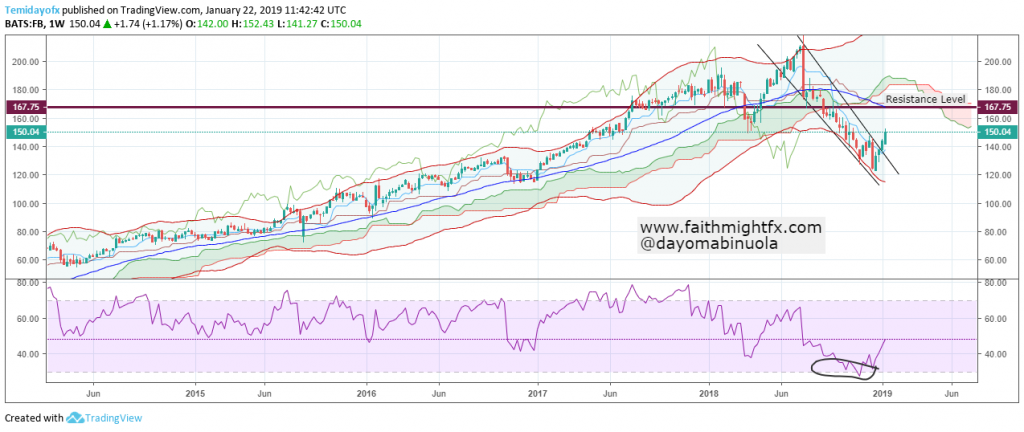
RSI is currently showing oversold. This oversold position was last reached in 2012. If $FB bulls get into the market amass, this could lead to a change of trend in the bullish direction. The share price of $FB might reach 160 from its current 145.97 when the bulls take charge fully. A breakout of the resistance level might make the bullish movement to continue. Though Ichimoku is yet to give a change of trend, price might also get into range before the uptrend begins.

Hope For Apple Bulls

$AAPL lost all its gains in 2018 starting in November. This might be due to the on-going trade wars. Since this fall in price, $AAPL shares reached 145.82. Before the huge fall in $AAPL share price, it had been overbought a few times. Using the weekly chart, price of $AAPL has been in the upper region of the Bollinger bands since August 2016 before it changed to the lower section of the bands in November 2018. $AAPL reached an all time high of 228.39 in September 2018.


The fall in $AAPL share price made the RSI show an oversold position. The trendlines are already broken showing a bullish reversal. Though price sits comfortably in the lower region of the Bollinger bands, it is yet to fully reverse. From now, the activities of buyers might make the $AAPL shares to rise to 188.07 from its current 155.17. Ichimoku’s future still shows price is on the downtrend. However, the support level 145.82 is yet to be broken downward despite price retesting the level in the past four weeks. This could be an indication that $AAPL bulls are about to launch their efforts.

Wells Fargo Could Be On The Rise

The share price of $WFC went down in 2018 for about 2100 points. It was not really a good year for investors of $WFC. A support level at 43.46 was last reached in October 2016. In the last month of 2018, it was all bearish for the $WFC shares though the bears have been in charge since September. An oversold position has been reached which might give room for investors to take charge. 2019 began with an obvious movement of the $WFC shares in favour of the bulls. Though, there are a few signs that the bulls have been active in the market in the last days of 2018.

Wells Fargo stock daily chart


The oversold levels were reached in December 2018 using the RSI. The quest for the $WFC shares to go bullish might have begun already because about 400points have been gained on the $WFC shares so far this year. Price is currently at 48.70. Stocks are beginning to gather momentum generally for bullish movements. There are very high tendencies that the price of $WFC will touch the resistance level 1 at 50.13 and eventually breaks the resistance.

Apple Gaining Momentum For A Rise

The face-off between the $AAPL bears may soon come to an end due to trade wars. In September, we saw a future fall in $AAPL shares. The fall in price was about 4500points before finding a new support at 170.48. The fall between October and November made $AAPL to lose 78.89% of its gain made in 2018. The second half of the year has been full of volatility in the $AAPL shares price movement.

Price undoubtedly has been oversold on the RSI, showing that sellers have been relentless. But this may be a good time now for $AAPL bulls. Price has broken out of the trendlines, and might likely reach 210.60 from 178.19. Before the end of the year, about 3000points might be gained back out of the total points lost if more buyers become active. $AAPL has been considered one of the cheapest stocks now after the oversold position was reached. This might be the right time for investors to take a position in $AAPL.

Source: These 3 Value Stocks Are Absurdly Cheap Right Now.  (NASDAQ)

Exxon Mobil Finding A New Resistance

The Exxon Mobil shares in 2018 has been of low volatility with several higher lows and lower highs. Price of $XOM had initially broken support in February leading to a fall in price. The highest point of $XOM price in 2018 was at 89.32 which was in February; then the bearish movement made price to reach 72.71, the lowest level in the year. The highest rate of volatility of $XOM shares was in the first quarter of the year. Price action shows a long range in price from April to mid September. Both the bullish and bearish movement within the range period were between 700points. The second resistance level in the year, 87.51 was only reached once in September after a bullish movement broke out from the range.

In September, when the price of $XOM reached an overbought position on the RSI, a reversal began. This reversal gave rise to price breaking the support level at 81.88. Price has since then been in the lower region of the Bollinger band. Price tried to retest back to the middle Bollinger band line which also stands as the resistance level. Price of $XOM is currently at 78.45, showing a trace of a bullish movement from the last 3 trading days. A breakout of the resistance level 1 at 81.88 could lead to a continuous bullish movement which might eventually reach 87.51. Investors might decide to go long on the $XOM since price is around a major support level in the year.


General Electric Shares Might Begin A Bullish Trend

In 2018, General Electric has suffered a setback in its share price. The highest point $GE reached this year was at 19.27 in the first two weeks in January. Since then, the bears have secured about 1200points in the year. We previously analysed a fall in share price of $GE. It has since found a new support. The fall between October and November alone was at an average of 25.69% of the total fall in the year.


Taking a good look at the $GE daily chart, there is a breakout of price from the trendlines as price consolidates. RSI shows an oversold position. Ichimoku is yet to show a reversal from the bearish trend. As the year comes to an end, the bulls might want to resume active roles. In over two decades, $GE has maintained a support around 7.92. If the support level holds again, price might reach 11.23. A breakout of the resistance level above 11.23 might lead to a continuous uptrend.

IBM Bulls Are Being Pressurised

Price movement of IBM for the most part of 2018 has been ranging. A major downtrend began in September to the last week of October. In October, price of $IBM shares reached 114.05, the lowest level in the year. The last time priced reached this level 114.05 was in May 2010. The highest level $IBM stock reached this year was in January at 170.25 level. Since then, RSI has never been overbought like it did in January. Since the beginning of November, the price has only moved from 115.58 to 124.98. This little bullish movement has given hope to the IBM bulls.


A new CEO will resume office in December 3. This was announced by Nielsen Holding Plc. The new CEO has been a member of IBM. Price is currently around 118.26 and might go upward to reach 129.27. RSI has shown an oversold position on the platform giving a signal for a possible buy. A breakout upward also occurred from the trendlines. All these indicators except the Ichimoku show that the bulls might take charge soon. As the year is coming to an end, and as the new CEO resumes office, share price might just maintain a bullish movement till the New Year. $IBM stock in 2018 has not been too favourable to the bulls but the latter part of the year might change the case.

Source: Nielsen Names IBMs David Kenny New CEO (MarketWatch)

FedEx Bears Take Over

The market value of $FDX showed a trace of reversal this week after maintaining a bullish movement for the past two weeks. Price touched the support level in the latter days of October since August 2017. Just like many stocks had a bearish turn in October, $FDX also had. The all-time high this year was in January when price was at 274.69. Price movement of $FDX in 2018 is between 274.69 and 208.02.


Since September, price has maintained the lower section of the Bollinger bands. Ichimoku shows the future is also on a downtrend. But RSI shows despite being on a downtrend, it is oversold, preparing for a bullish turn which temporarily occurred. A bearish breakout also occurred from the trendlines showing the continuation of the downtrend. News reaching me shows $FDX is about to raise ground and home delivery rates starting from January 7, 2019. The new shipping rate will increase by an average of 4.9%. Price is yet to cross over to the upper region of the Bollinger bands. Therefore, the bears are still in control of the $FDX stock.
Source: MarketWatch-(Fedex To Raise Ground, Home Delivery Shipping Rates Starting January 7)

Are The Wal-Mart Bears Trying To Overpower The Bulls?

In the year 2018, $WMT share price has been stable for the most part with a few volatile moments occurring in price movement. The all-time high of $WMT was in January when price was at level 109.79. Price had dropped since then to around 81.82 which stands as a major support level for the year. Unlike other stocks in October, $WMT broke out of a ranging market to begin an uptrend. Before the upward breakout in October, there was a bullish signal in August.


The RSI on the daily chart showed an initially overbought position and now in November, showing another overbought position. Since price crossed over to the upper region of the Bollinger band in June, it is yet to cross to the lower region. In the early days of October, price touched in the middle line of the Bollinger bands. If the support level is broken, it might trigger a major sell off for $WMT stock. The bearish movement might reach 88.94 from 101.33. Indications show a strong bearish movement might occur. For now, we will wait to see what price will do.

Google Retesting Support

$GOOG has found support at 1001.23 on the 29th of October. The bears have been in charge of this stock since the first week of September. Price action this year shows support level at 1001 was not broken. Share price of $GOOG fell about 3.5% this week. Since a major downtrend began in October, share price of $GOOG has dropped 14.2%. Price has maintained the lower region of the Bollinger bands since September. It’s like all the gains of $GOOG in 2018 were lost between September and October.


RSI on the daily chart signals an oversold region. Taking a look at the trendlines And B, price closedabove the trendline B on the 7th of November. Presently, price is retesting at a major support indicating a reversal. Price might touch the resistance level at 1123.23 this month. Ichimoku shows a downtrend and no trace yet. If price retraces but holds the expected resistance level at line C, $GOOG may continue the downward trend.