fbpx

The Yen About To Appreciate Against The American Dollar

As the Yen is yearning for a rise in price against the US dollar, the US dollar was able to gain more than the Yen in the last one week. For the most part of 2019, the American dollar has gained about 4.914% against the Japanese yen, which signifies a bullish movement for the $USDJPY. Price of $USDJPY has failed to touch the upper line of the Bollinger bands despite the bullish movement. We have seen at two different instances that price of $USDJPY touched the resistance level line on the chart. Technically, it shows a double top, a strong indication of a reversal.
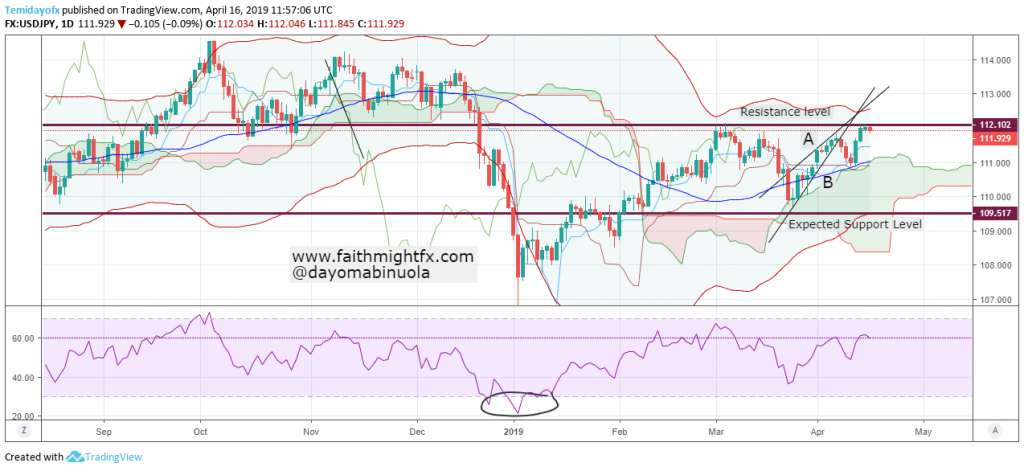
USDJPY Daily Chart

A doji has been formed after price touched the resistance level. Before the correction occurred on the 11th of April, price of $USDJPY touched the Bollinger band’s middle line. On the RSI chart, the price of $USDJPY did not show the overbought position on the daily chart. Also, the Ichimoku’s future still shows bullish strength, meaning the bulls are stil very much active. However, the trendlines have been broken to the downside on the 8th of April before a correction occurred. The expected support level is 109.517 from its current 111.932.

The Dollar Might Continue The Uptrend Against The Yen

The Japanese yen gained so much against the dollar with over 500pips in December 2018. During this time, most of the American stocks took a dip and are yet to recover fully. $USDJPY peak price in 2018 was in October at 114.404. In the second half of the year in 2018, $USDJPY was overbought at two instances. Price touched level 104.718 level in the early days of January 2018 with much volatility in the 2nd trading day.

After the dip in December, price of $USDJPY is already oversold on the RSI indicating a reversal for an uptrend. Price has currently moved upward 300pips in 2019 and shows a very high tendency of a continuous uptrend to 113.96 in the long run. For a short while, price of $USDJPY could rally up to 111.823 from its current 110.480. The future of Ichimoku shows a trace of reversal which might attract an additional 300pips in the long run. Though price is currently in the lower region of the Bollinger bands, price might cross upwards to the upper region of the band in a short while.

Overbought Positions, Yet USDJPY Price Remains Bullish

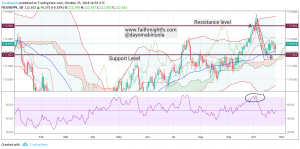
A major Bullish trend began in March 2018. About 800 pips have moved in favour of the USD pushing the $USDJY higher. The USD remains quite strong in 2018. There has been a major break in the uptrend in May, price only moved downwards from 111.149 to 108.412 before the uptrend continued to new highs at 114.488.

Price action disobeyed the rules of RSI: price has shown overbought positions three times between May and October, and each time the upward movement continued. Could this be the monetary policies made this year, that has favoured the USD? Price is around 112.631 hoping to touch 114.30, which is on the upper band line. Price might begin a downtrend soon but it may touch the upper Bollinger band line before a trace of downtrend. Ichimoku on the daily chart shows no trace of downtrend. We might be expecting 200 pips movement upward.

What I Wish I Said

I was honored today to be on @spz_trades’s last show on BFTD.tv with @NicTrades. @NicTrades is a superwoman who chatted markets in the middle of a power outage. She rocks. Some of her key observations for 2014 that I took away:

  • $AUDUSD to 0.9000 off the double bottom
  • $USDJPY to 112
  • USD lower and USD pairs higher
  • $EURUSD to 1.43
  • Correction in $SPX, $DAX and $FTSE
  • Stocks will have to rally on their own merit, not QE

I was clearly the student in the room and now in hindsight there are a number of thing I WISH I could say now. SMH. Face plant. So I’ll say them here.

  • I do see $EURGBP higher to 0.8600. I also still see heading lower in 2014 to 0.8000. It might happen way sooner than I imagined if current price action is any indication.
  • $GBPAUD is due a correction lower. Much lower. But if it were to correct to 1.7670 the 50% Fibonacci level, hold, and rip to new highs at 2.10, it would be the trade of the year.
  • Other great follows right now on Twitter for new traders that I didn’t mention: my traders list

I love that this blog gives me the opportunity to reflect on myself and remain true to who I am. I don’t know if it was nerves (Nic is a rock star!) or because I had company the night before, but I don’t feel like I came off myself today. Hopefully, you all can enjoy listening in on this chat about markets and trading for 2014.

Europe Contagion Hits Japan

chart of Japan trade balance with EU

Europe hit Japan right where it hurts – in the wallet – for the first time in 38 years. We all know that Europe is hell bent on carrying out austerity-driven policies. That drop in exports above is vicious. The following recovery has been tepid at best. It looks like the recession that has gripped Europe since 2009 is spreading beyond its borders.

As its second largest trading partner, Japan needs European business to help inflate its economy. Decreasing trade, however, leads to decreasing price hikes which leads to more deflation which equals a strong yen. Currencies from low-inflation countries are always in favor with investors. With $USDJPY around 80.00 and the $EURJPY having traded to record lows, the BoJ has quite a fight on their hands as Europe only gets worse still.

But who cares? Interesting chart, nonetheless.

Source: Reuters