fbpx

Is The Weak GBP Trade Crowded?

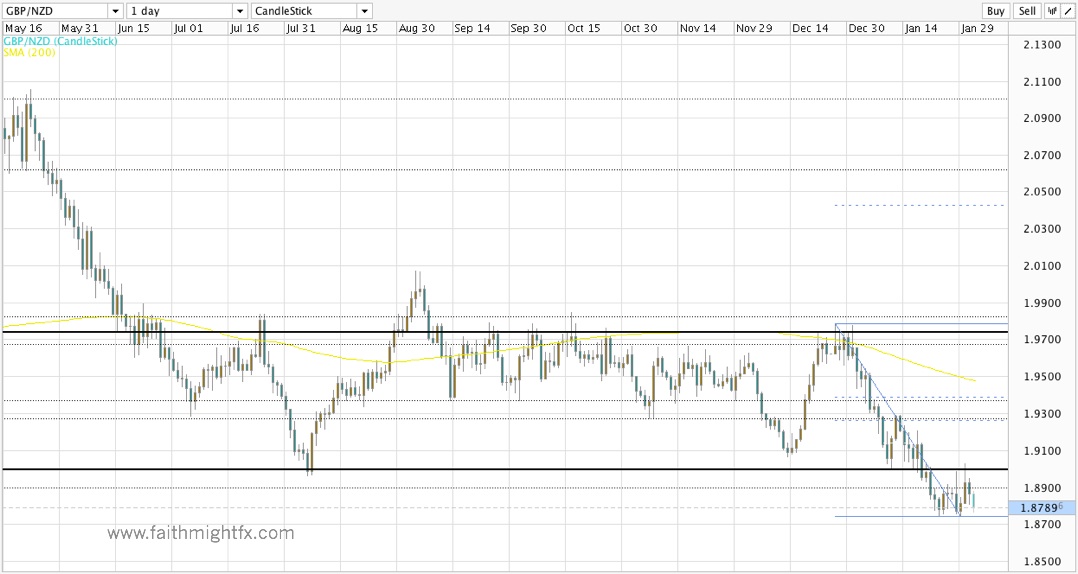
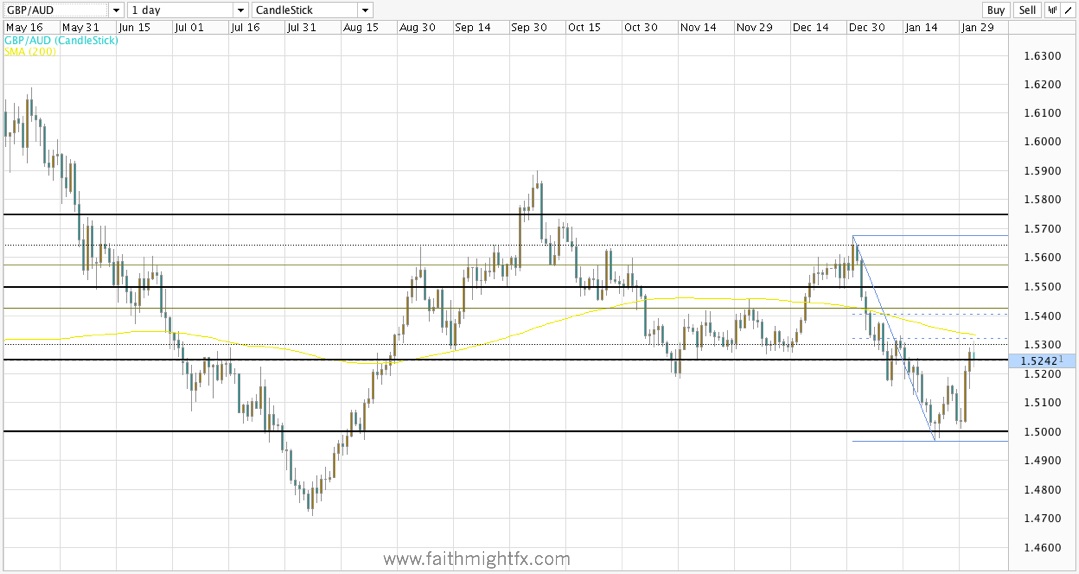
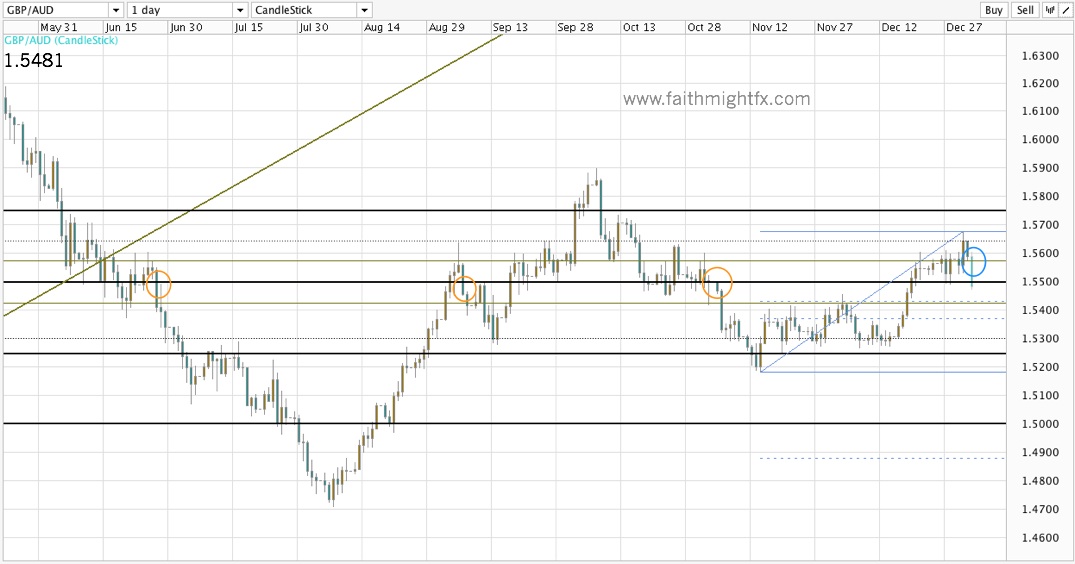
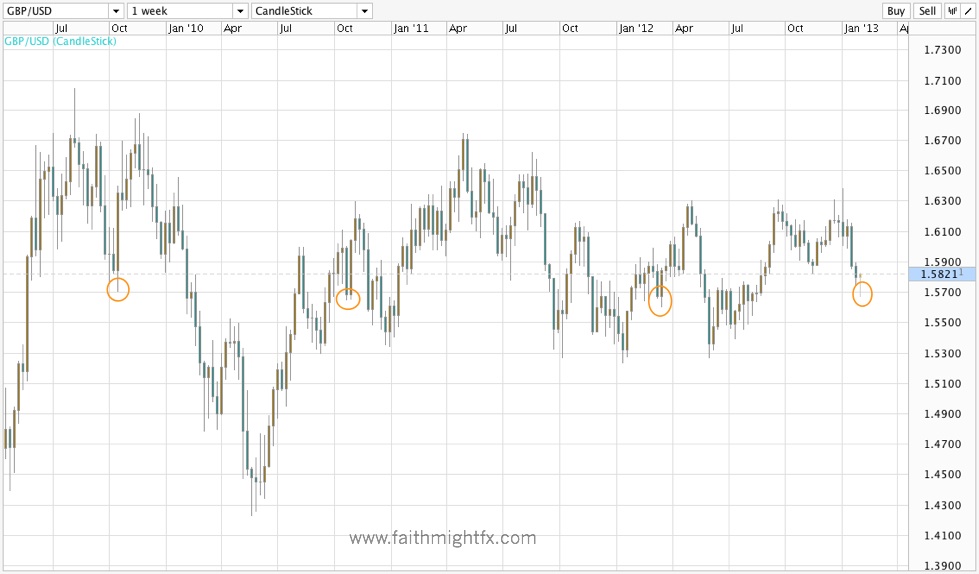
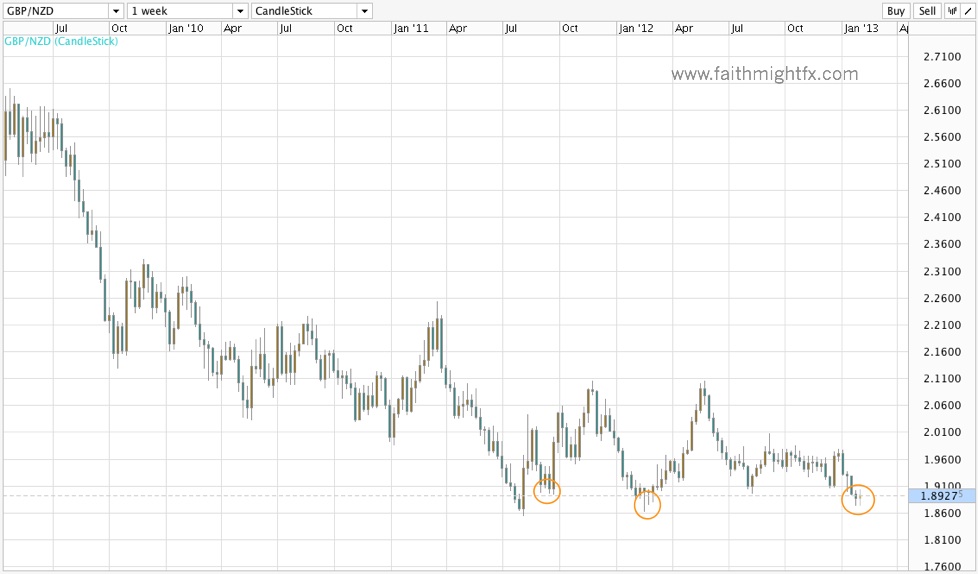
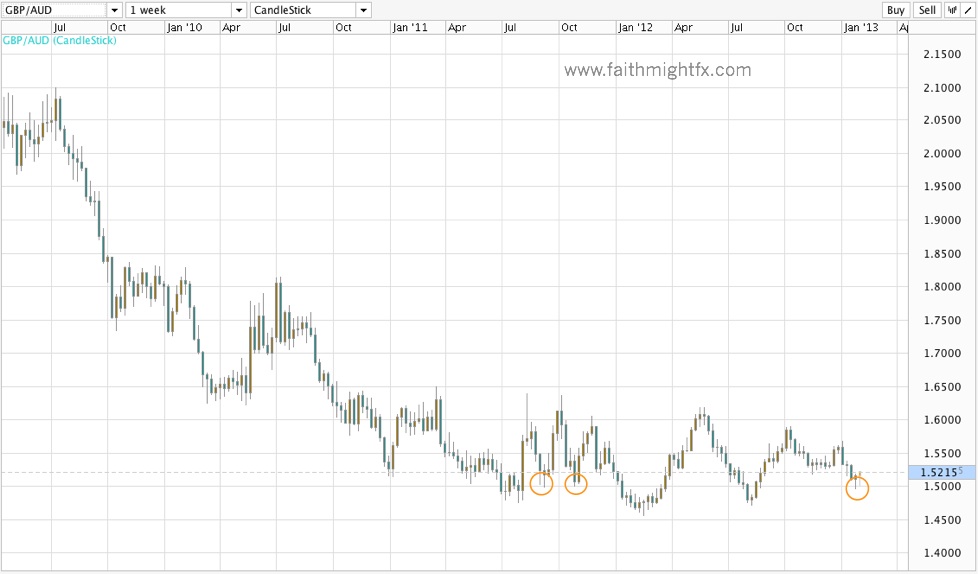
Sterling has spent most of the new year in the dog house. It has tumbled against every major currency with the exception of the Japanese yen. $GBPUSD, $GBPNZD, $GBPAUD have broken 2012 lows to reach new lows and are building breakouts to the downside.

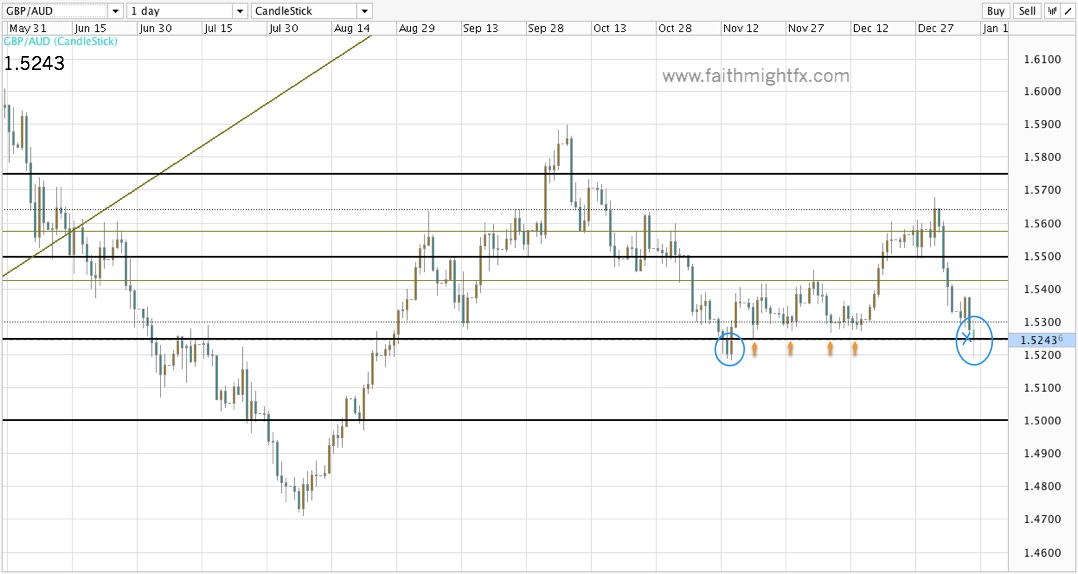
Everyone is well aware of the poor fundamentals underlying the weak GBP story. Triple-dip recession looms. A dovish incoming central bank governor spouting his rhetoric before he even takes the helm. Unwinding of the “safe” haven flows that sterling enjoyed while the European Union was imploding. Traders piled in short GBP. Analysts made recommendations to sell sterling. However, even after hitting new lows this week, GBP bears have not been able to gain additional ground lower.

GBPUSD WEEKLY CHART

GBPNZD weekly chart

GBPAUD weekly chart

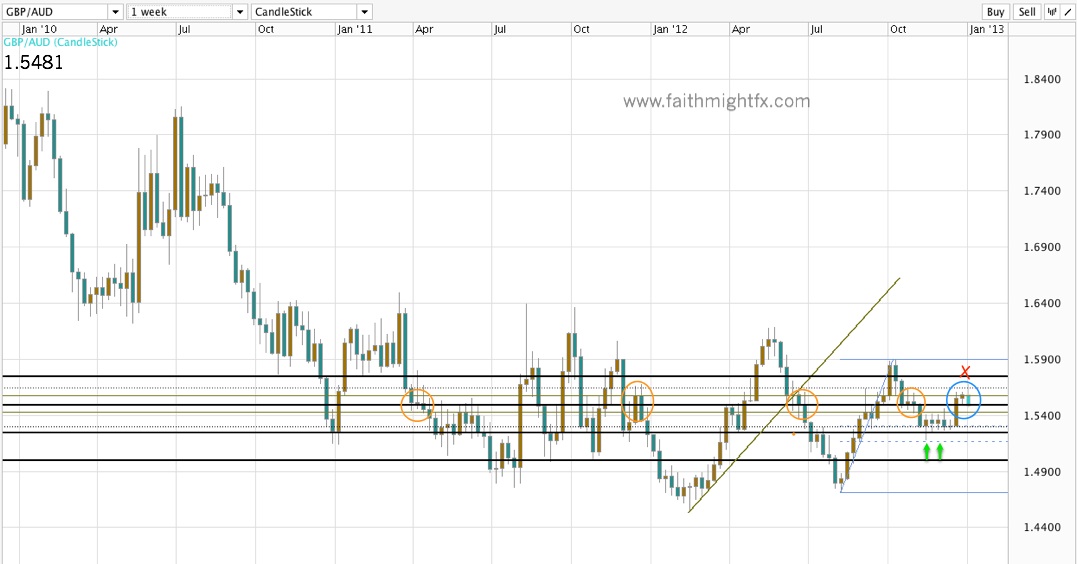
A crowded trade does not mean a change in sentiment. It is important to understand that the fundamentals definitely favor a weaker sterling. However, GBP has dropped considerably in just a month’s time without significant correction. Nothing moves in 1 direction forever. Profit-taking can be brutal in this environment as swing and position traders who caught the trend early become more cautious with these price stalls at lows. Also, perhaps more importantly, is that the fundamental landscape has become a bit more optimistic in just the past week. UK economic data has surprised on the stronger side. Carney sounded far less hawkish than he did a few weeks ago in his testimony today. While I still think GBP has further to fall in these highlighted currency pairs, it may be more prudent at these levels to wait on the more significant pullback before reloading the swing short sterling trade.

Sterling Digest, February 4 2013: week of the central banker

Bank of England at Night - Arsat 30mm Fisheye lens on Flickr
BoE at night – What happens behind closed doors?

This is the week of central banks as the market looks ahead to 3 central bank announcements from the Bank of England, the European Central Bank and the Reserve Bank of Australia. After consolidating most of last week, sterling diverged in Friday’s price action weakening against every major currency except the JPY. While the USD weakened on a NFP miss against the EUR and NZD, it gained against the GBP. The reason is a fundamental one. The US economy is in better shape than the UK. While both were surprisingly disappointing, US GDP contracted by less than the UK GDP. UK manufacturing PMI missed expectations; US ISM exceeded expectations. The $FED is on hold; the BoE is dovish and likely to enact another round of QE. Following the announcements already from the BoJ, RBNZ, and FOMC, this week’s announcements should complete the fundamental differences in the major currencies. With the forex market now trading on fundamentals (and not risk appetite), the best trades now become the ones that exploit the stark differences in fundamentals.


Image credit


The NFP Dollars

As the market awaits the first non-farm payrolls (NFP) release of 2013, the Australian and New Zealand dollars have wildly diverged in price action this week. Historically, the 2 currencies move together given their geographical proximity and relation to commodities. But this past week, the AUD has weakened considerably versus the USD while the NZD continues to rally against the USD. The fundamentals have supported this divergence as the RBA is considering interest rates cuts while the RBNZ remains much more hawkish.

As such, I think any interesting GBP trade idea is one that takes advantage the way the USD reacts to the non-farm payrolls report. If the USD weakens, the better play would be the $GBPNZD as the kiwi will advance more rapidly versus a weak USD as it has all week.

GBPNZD daily chart

A weak USD supports a weak $GBPNZD down to 1.85. On the other hand, if the USD strengthens, then taking advantage of the already weak AUD would make the $GBPAUD the better opportunity.

GPBAUD daily chart

A decline in the $AUDUSD would see the AUD also weaken versus the GBP and extend the rally in $GBPAUD to 1.54, the 61.8% Fibonacci retracement level on the daily chart.

NFP in due to be released in 30 minutes. Given how the aussie and kiwi have traded already this week versus the USD, we can take advantage of either a hit or a miss in NFP expectations without direct exposure to the USD volatility.

Sterling Digest, January 27 2013: follow the trend

KAL Cartoon in The Economist
Can the British economy really afford to abandon the EU?

Last week was epic for sterling. The $EURGBP rallied to new highs above the psychologically important 0.8500 level. The $GBPUSD, $GBPNZD, $GBPAUD, and $GBPCAD all fell to fresh 2013 lows early in the week heading to the Bank of England minutes release. However, when the BoE minutes revealed that it was ready to end quantitative easing and unemployment in the UK fell to new lows, sterling rallied off the lows. In fact, thank in large part to the Bank of Japan, the $GBPJPY rallied to its highest levels in over 2 years. Despite policy makers in the BoE calling for an end to QE, the economic realities of the UK may not allow that to happen. And since BoE meeting minutes are backward looking, sterling may not be able to sustain its Friday gains in this new week of trading. With a very light economic calendar from the UK this week, expect sterling to trade very technically and at the whims of the USD with the $FED rate decision looming mid-week.


Image credit


Sterling Digest, January 20 2013: Safety issues

Goodbye Europe. The Economist cover

Sterling has weakened considerably to kick off 2013 with several themes at play here. One is the fundamental fact that the British economy stands to enter a triple dip recession having ended 2012 with no growth. Secondly, the EU is looking  much more attractive to investors. While 2012 will be remembered as the year investor fled euros and parked their money in sterling and swiss francs, 2013 sees these same investors putting their money back in euros. Lastly, I have noticed that sterling is correlating to the USD much differently than it had in 2012. While a strong GBP saw a strong USD (and visa versa), that correlation is no longer. Now sterling is weak across the board with currencies of the stronger economies (CAD, AUD, NZD) leading the charge.

Image credit

AUD Finds Its Legs

Looking to the left of the chart, we can see that previous breaks lower that closed the week below 1.55 saw momentum carry price lower.  Even on a smaller time frame, the daily chart, a candle close below 1.55 followed by a subsequent candle close below 1.55 saw a price drop as low as 1.5250.

This was how I closed my new year post on the $GBPAUD. In today’s Wednesday session, the pair actually broke that support at 1.5250 to reach a low of 1.5191 before bouncing back to the 1.5250 to end trading just below the former support level.

GBPAUD daily chart
Minutes before Chinese data released

Now China has just released its trade balance numbers (9:00pm EST) and they beat market expectations by a wide margin. As such, the AUD is rallying big time in reaction to the positive news. Already down 70 pips in 20 minutes, the $GBPAUD has made new lows than the previous 1.5190 lows and is still falling. With no real support until the 1.50 major psychological level, $GBPAUD is on track to test its 2012 lows at 1.4700.

Sterling Digest, January 5 2013: Trust the crosses

Cover artwork from The Economist 2012 Christmas double issue
Happy new year?

To kick off the new year, the global fundamentals still stink. Currency wars still rage across the globe. American politics continue to debase the world’s reserve currency. And after entering recession in 2012, the British economy is poised for depression in 2013. As terrible as the fundamental landscape seems, I agree with @kathylienfx (read her articles below). The trades that make the most sense in 2013 are the currency cross pairs. While the majors are mired in USD murkiness (fundamentals vs. risk appetite), the crosses more clearly reflect the fundamentals. And as such, these currency pairs seem to have the best trading opportunities in the current forex market environment.


Image credit


End of Year Breakout Fizzles In 2013

Not long after writing on the bearish outlook of the $GBPAUD, the pair staged a breakout above 1.5425 resistance:

Pops higher, however, should be met by sellers at or ahead of 1.5425 resistance level aiming to take price towards 1.50 in the coming weeks. Only a close above 1.55 changes the short term momentum to bullish.

It seemed as if the pair was turning bullish as it based at 1.50 even ahead of the 61.8% Fibonacci retracement level of the latest bullish wave. When a pair respects its Fibonacci levels on a correction lower, we expect that pair to make a new high higher than the previous high. The $GBPAUD failed to do so. Instead, the breakout fizzled at 1.5676 and has since turned lower.

GBPAUD weekly chart

Despite closing the year above 1.55, the $GBPAUD started off the 1st full day of 2013 trading dropping below that major 1.55 level. Looking to the left of the chart, we can see that previous breaks lower that closed the week below 1.55 saw momentum carry price lower.

GBPAUD daily chart

Even on a smaller time frame, the daily chart, a candle close below 1.55 followed by a subsequent candle close below 1.55 saw a price drop as low as 1.5250.

So despite closing the year above 1.55, the $GBPAUD still looks bearish. It remains to be seen if this is the year the pair resumes its long term bear trend to new lows below 1.4700.

Happy 2013

Sterling leaves 2012 with its larger trends still very much in play. Of course, the $GBPUSD is the outlier as the USD enters 2013 embroiled in political rubbish. However, all the pairs highlighted in November 2012 enter 2013 with the long term trends still largely in play.

  1. GBPAUD False Break Short-lived
joypeace
Happy 2013!

The GBPAUD PreMarket

In the forex markets, premarket is really only early Sunday morning. With charts frozen until the afternoon open, this can be the best time to find insights before charts start ticking again.

The $GBPAUD is in a long term consolidation pattern with price currently hanging out in the middle of the weekly chart channel. So when the lows held at 1.5182 2 weeks ago, it is worthy to note that price still means to head to the bottom of the channel when price failed higher last week again at 1.5425.

 GBPAUD weekly chart

GBPAUD weekly chart

Despite bearish momentum, price managed to close above 1.5300 support level and 50% Fibonacci level. So to start the week the possibility for spikes higher remains at the market open. Pops higher, however, should be met by sellers at or ahead of 1.5425 resistance level aiming to take price towards 1.50 in the coming weeks. Only a close above 1.55 changes the short term momentum to bullish.