Not long after writing on the bearish outlook of the $GBPAUD, the pair staged a breakout above 1.5425 resistance:
Pops higher, however, should be met by sellers at or ahead of 1.5425 resistance level aiming to take price towards 1.50 in the coming weeks. Only a close above 1.55 changes the short term momentum to bullish.
It seemed as if the pair was turning bullish as it based at 1.50 even ahead of the 61.8% Fibonacci retracement level of the latest bullish wave. When a pair respects its Fibonacci levels on a correction lower, we expect that pair to make a new high higher than the previous high. The $GBPAUD failed to do so. Instead, the breakout fizzled at 1.5676 and has since turned lower.
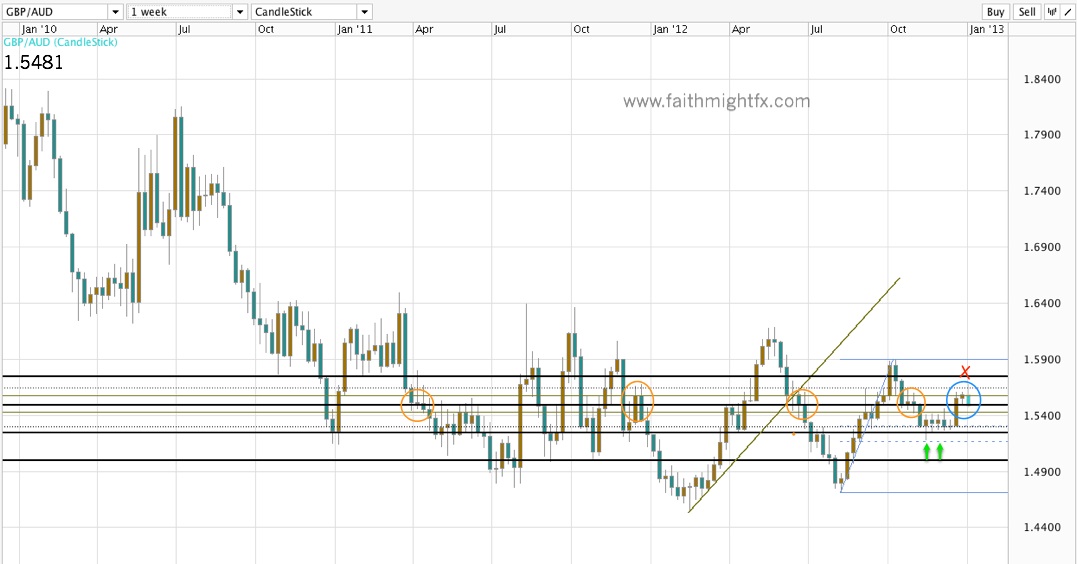
Despite closing the year above 1.55, the $GBPAUD started off the 1st full day of 2013 trading dropping below that major 1.55 level. Looking to the left of the chart, we can see that previous breaks lower that closed the week below 1.55 saw momentum carry price lower.
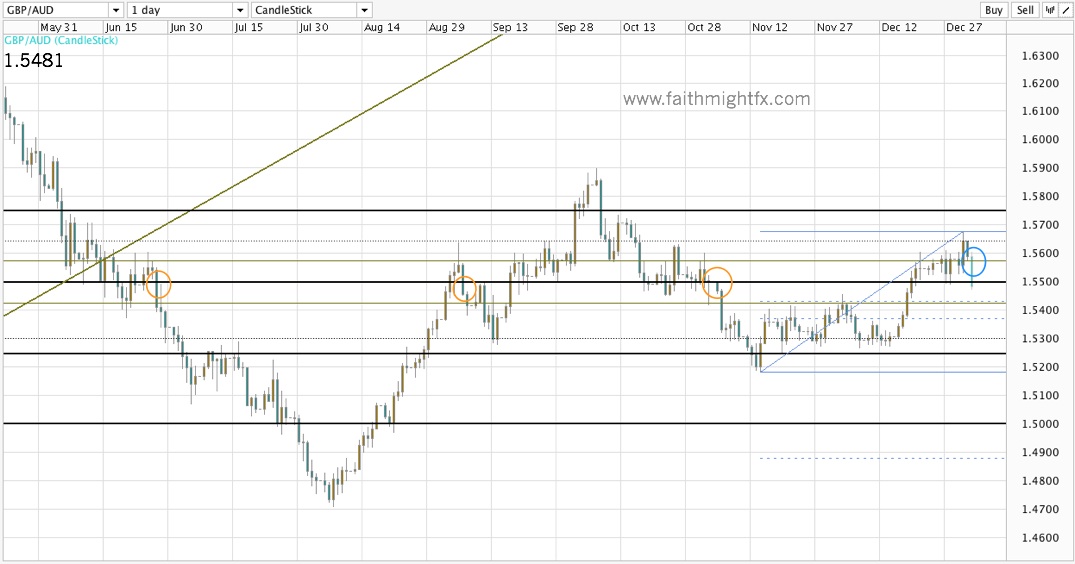
Even on a smaller time frame, the daily chart, a candle close below 1.55 followed by a subsequent candle close below 1.55 saw a price drop as low as 1.5250.
So despite closing the year above 1.55, the $GBPAUD still looks bearish. It remains to be seen if this is the year the pair resumes its long term bear trend to new lows below 1.4700.