Analysing the monthly chart of USDJPY between the years 1999 and 2016, an inverted head and shoulders was formed which could have been the determinant for the rally of the pair that began in January 2011. The all-time low of the USDJPY was reached in October 2011 at 75.513. Only six candlesticks on the monthly chart have closed bearish since the rally began in January 2021.
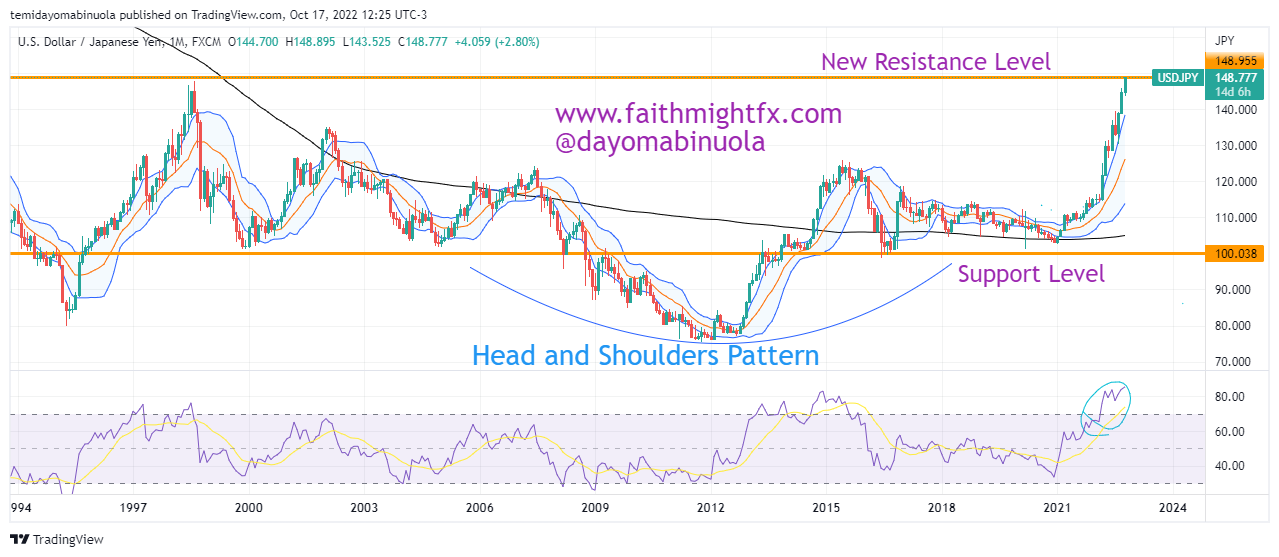
The candlesticks in the last two months on the monthly charts have closed bullish. USDJPY’s opening price in October 2022 was 141.672. The bullish momentum that has gathered in the last two month has been able to push the pair to a high in this month at 148.887 which was last hit in August 1990.
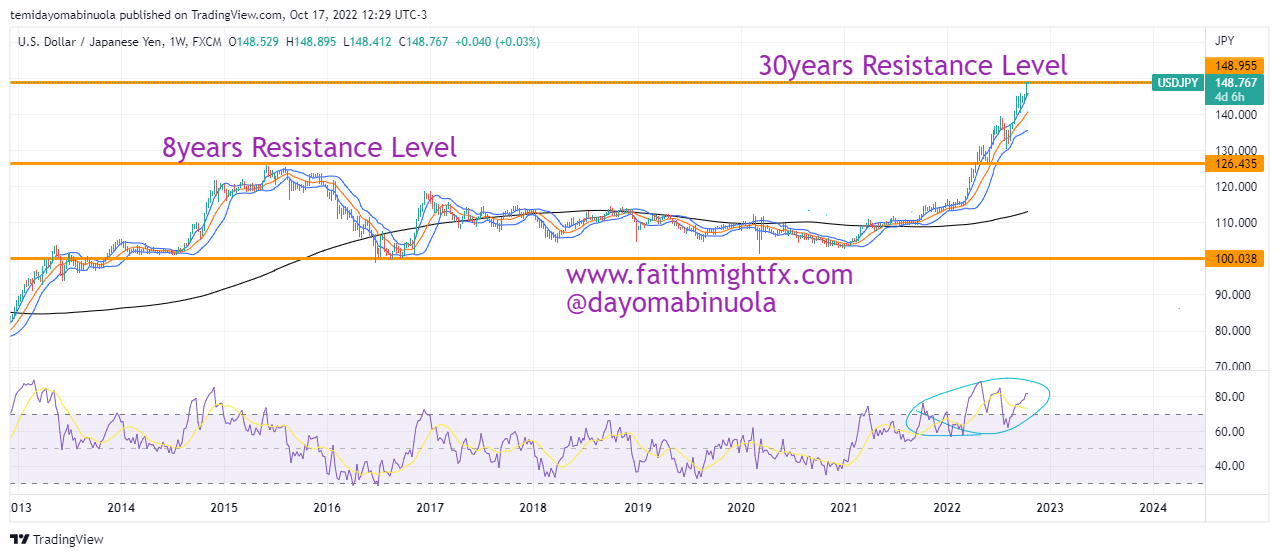
We might be seeing a price correction to 145 as RSI shows price has been overbought on the weekly chart.
Some of these ideas are in our clients’ portfolios. To understand if this one can work for you or for help to invest your own wealth, talk to our advisors at FM Capital Group. Would you like more information on how to get currencies in your portfolio? Schedule a meeting with us here