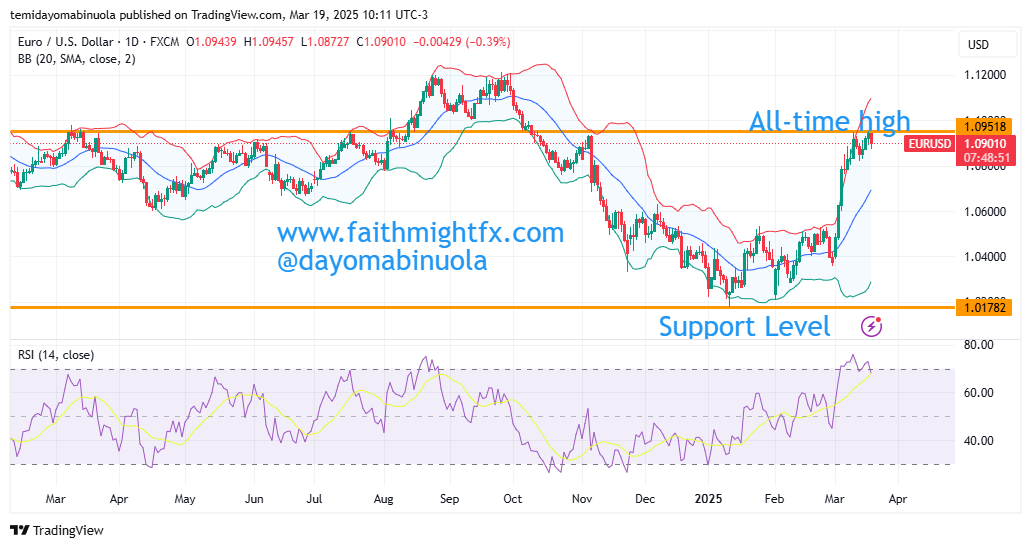
The year started on a positive note for the euro as the European economy showed resilience amid global uncertainties. Increased defence and infrastructure spending in Germany, coupled with improving economic indicators across the Eurozone, provided strong support for the euro. This led to the EUR/USD pair experiencing its largest weekly gain since 2009. The exchange rate hovered around 1.08-1.09, marking a significant appreciation from the previous year’s close.
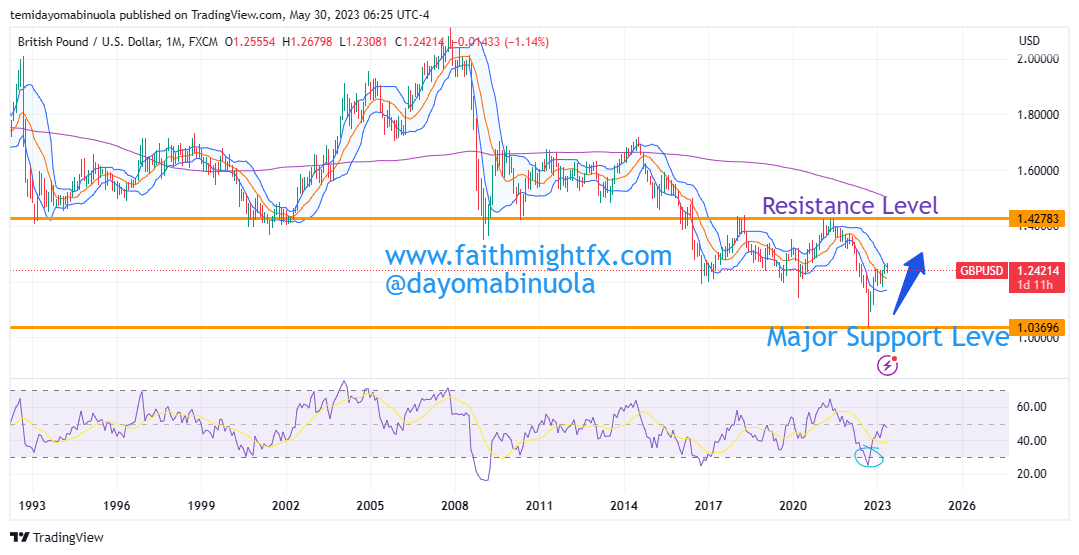
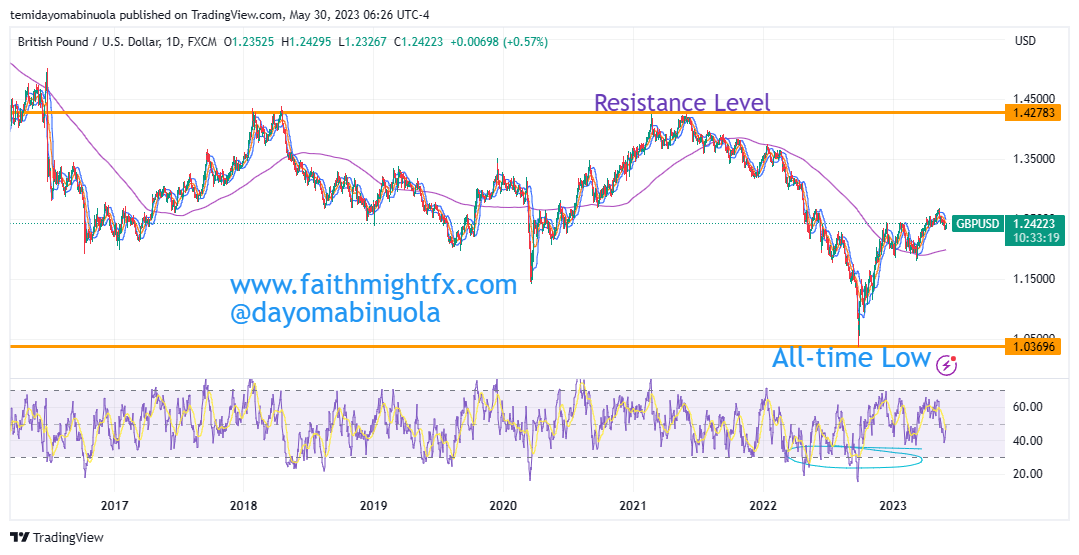
The year began with the British pound showing signs of recovery following a period of uncertainty in late 2024. Investor sentiment improved as the UK economy displayed resilience despite concerns over fiscal policy`. GBP/USD started the year around 1.26 and gradually gained momentum, buoyed by expectations of a more measured pace of monetary easing compared to other major economies.
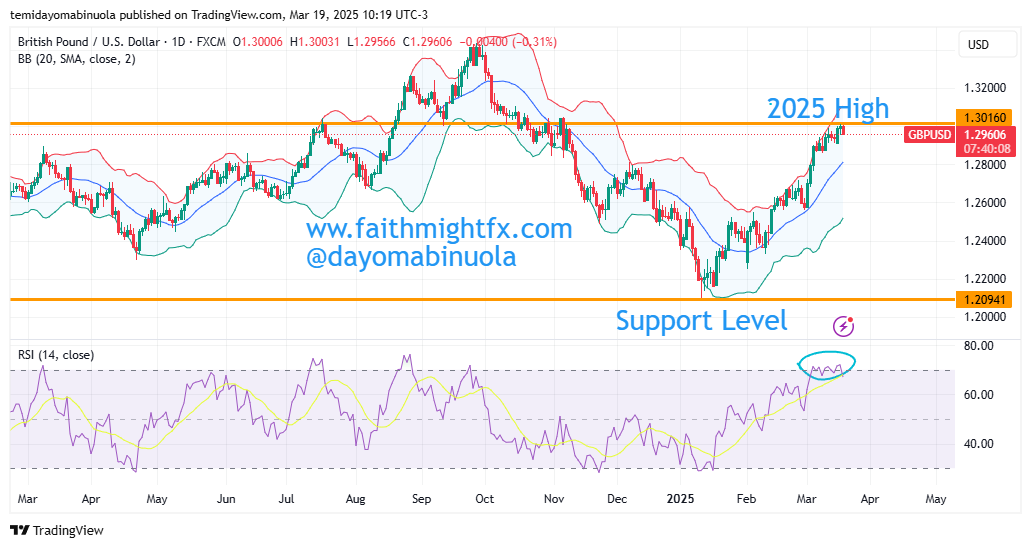
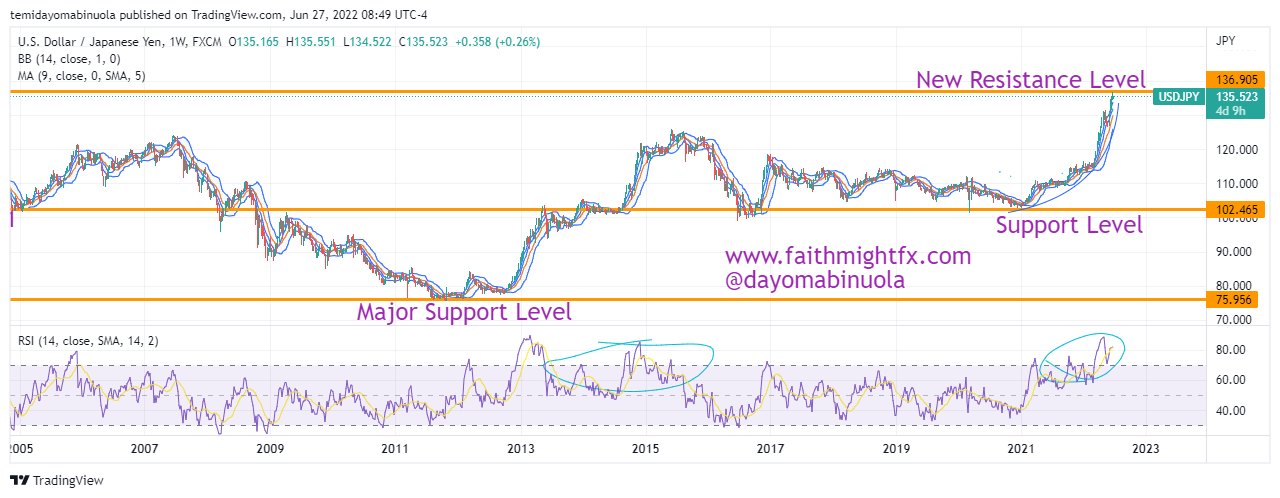
EURUSD has been rallying since the beginning of 2025 just as GBPUSD. In March, both pairs rallied, gaining over 400pips each. Price could continue to rally as we might reach a new price level for both pairs this year. We might see EURUSD reach 1.1213 from the current price of 1.0897 and GBPUSD might reach 1.33775 from the current price at 1.29644.
Some of these ideas are in our clients’ portfolios. To understand if this one can work for you or for help to invest your own wealth, talk to our advisors at FM Capital Group. Would you like more information on how to get currencies in your portfolio? Schedule a meeting with us here