fbpx

Facebook is Done

I love Facebook. I connect with my tribe there every day and it is fabulous. But I am completely over $FB, for a few reasons:

  1. People are leaving Facebook. While people are always leaving Facebook for one reason or another, the exodus never eclipsed the number of new people and businesses that signed up every day. Last quarter, Facebook reported a decline in users for the first time ever. And they warned that they expect that decline to continue. With 2 billion users on Facebook and a population of 7 billion on the Earth, how many more users can it really get at this point?
  2. History has shown that election season tends to be very lucrative for Facebook. But thanks to Cambridge Analytica, don’t be surprised if they see an actual decrease in revenue during this election cycle. If the market is surprised, it won’t be in a good way.
  3. I’ve been side eying $FB stock since the Cambridge Analytica fiasco anyway. But $FB hit $200 twice after that. So when the stock started to dip again, I knew there was real weakness. But thinking of all the mutual funds and hedge funds that hold this stock, I thought it would get back to $200 as they buy more shares on this dip too. With stock markets moving higher and higher all year despite trump and tariffs, I didn’t foresee rising interest rates to be the eventual catalyst for a decline in equity markets. I’m paying more attention to that as rates will go higher.

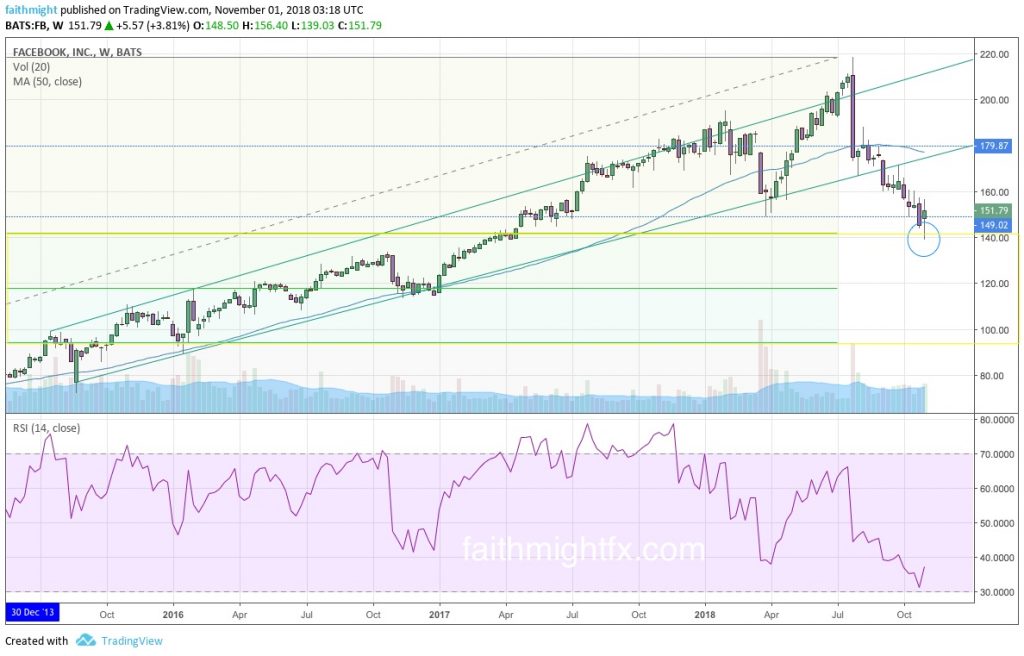
FB WEEKLY CHART AS OF TODAY

Read our work on $FB this year. We have been skeptical all year and current price action continues to confirm our sentiment.  Before the earnings report was released yesterday, $FB made new lows for the year at $139.03. While this may be new lows, it is also a 38.2% Fibonacci retracement so the post-earnings bounce is a move we were watching for. The question is now the follow through higher, which is expected on a Fibonacci move. However, the aforementioned reasons could see a failed high before we see a new high.

There are ebbs and flows to every market. Trade what you see. Or learn with me. And invest with a pro. [sponsored]

Sources: What’s behind Wednesday’s market selloff?
(NPR)
FB Looks Vulnerable

This is the first time that $FB has ever revisited lows on the monthly chart. Here, on the weekly, this is nothing new. The contrasting price action in these timeframes suggests that if September ends the month, and quarter, at new lows, $FB becomes very vulnerable heading into election season and the last quarter of the year.

Ever since $FB broke above $55 after a brief pullback at the then-highs, there has not been a dip that revisited after the recovery. The fact that price is not only below $200 after making the new all-time high at $218.62 back on July 25th, it is back at the previous lows. Price stands less than twenty dollars shy of those Cambridge Analytica lows of 149.02, as of this writing.

FB WEEKLY CHART

Price is also sitting on the 38.2% Fibonacci retracement. It could hold here. Or break lower. The real question becomes what do you below $149 or above $200? My answer to you: what is your timeframe?

A Few Thoughts On Nike

Nike just stunned the world with its latest campaign to celebrate its 30-year anniversary in business:

Nike Colin Kapernick campaign

Because of the controversy that surrounds Colin Kaepernick’s stand for the social justice of Black people in America and his blackballing by the NFL, many have forgotten (or overlooked) Nike’s past bold moves. Just last week, after the French Federation of Tennis instituted a dress code against Serena Williams, Nike dropped this ad campaign:

Nike Serena Williams campaign

And anyone remember this bold move with Michael Jordan in the 1980s:

So what has all this boldness done for the stock? Well, $NKE hit all-time highs just  last week at $83.68. The news about the Kaepernick campaign came on a Sunday before U.S. equity markets were open. So, of course, traders on social media immediately became interested in how $NKE would perform on Monday when the stock market opened. And it did not disappoint.

NIKE DAILY CHART

$NKE opened with a huge gap down when markets opened Monday as Wall Street proved to be racist AF.  While price dropped towards the zone given by the Fibonacci retracement levels off the last support level at $75, I’d love to see price move even lower to fill that gap after its latest earnings report.

So if you’re shorting $NKE just because of its latest campaign, you just might be….nevermind. I’ll just say, find a better reason.


There are ebbs and flows to every market. Learn how to trade what you see. Or invest with a pro. [sponsored]

The SchizoGBP

Summer trading comes to an end this week as traders around the world head back to the trading desks en masse. But the Great British pound (GBP) has had quite an exciting summer. In what is usually a tame season for GBP price action, markets saw the $GBPUSD tumble just over 700 pips this summer. The main culprit has been Brexit or the lack thereof depending on the day and headline.  Brexit has caused the GBP, to not only move but to RIP in any direction and at any given moment.

“Brexit won’t happen” and GBP rips higher hundreds of pips.

“Brexit will be hard and concrete” and GBP crashes hundreds of pips.

This has been the case for the GBP all summer long. Despite the clear trend to the downside, markets have been looking for any reason to rally in the absence of a real upside correction.

A hawkish Bank of England (BoE), despite the political confusion surrounding Brexit, has also been a source of volatility in the $GBPUSD. While witnessing more hawks voting for an interest rate hike in June and July, it was the August meeting that finally saw the BoE deliver its second interest rate hike in over a decade. And yet this central bank action only extended the trend further to the downside.

GBPUSD DAILY CHART

Now that the $GBPUSD has found a bottom after falling all summer, it is long overdue for a correction. Despite the 400-pip bounce off the bottom so far, the $GBPUSD has still hardly corrected its downside trend move. While 1.3050 could very well hold as resistance, I am still of the mind that there is more upside correction due. I believe that a true correction happens into the Fibonacci retracement levels. Therefore, as the markets open this new and first trading week of September, the $GBPUSD finds itself having the potential to move at least 500 pips higher.

As always, trade what you see, not what I think!

Sources: Stuck Brexit negotiations point to a GBP/USD retest of 1.1946 (FXStreet)
GBP/USD: Bearish Technicals and No-Deal Brexit Threats Weigh on the Pair (Trade Captain)
British Pound Set To Weaken Further, But Some Hope On The Horizon (Seeking Alpha)
US Dollar Jumps to July High, GBP/USD Folds on Inflation Data (Nasdaq)
GBP/USD – British Pound Slips Over White Paper Blues (Seeking Alpha)
GBP in the Spotlight as Brexit Tensions Flare up (DailyFX)


There are ebbs and flows to every market. Learn how to trade what you see. Or invest with a pro. [sponsored]

ON THE AIR with F.A.C.E.

It’s always a treat joining Dale Pinkert live in the Forex Analytix Community Experience. This is the premier trading room on the internets right now. So it is honor to speak to this audience. To hear, today, how much value I bring to them is humbling. It makes my day to help people in their journey to successfully navigating these markets:

Take a listen below to our masterclass lesson in the GBP in real time after 4 straight months of decline against the USD and new lows versus the JPY. What’s in store for the rest of 2018?

Disney Has Lit Up #BlackTwitter

#BlackTwitter is the collective of influential tweeps who have given us memes upon memes, social justice movements across the world, and influenced global culture in profound ways through the power of the Internet. So when the release of Black Panther by Disney Studios was announced back in 2014, #BlackTwitter became aflame with excitement and anticipation of the next Ryan Coogler masterpiece. In fact, #BlackPantherSoLit became a trending hashtag for over 2 years before the movie finally opened in 2018 as the production progress strategically leaked to the world.

Then A Wrinkle In Time was announced. And #BlackTwitter blew up with excited anticipation yet again! So I started to pay attention to the market. With #BlackTwitter so hype, I got interested in the stock.

DISNEY stock DAILY CHART

While #BlackPatherSoLit became the top trending topic on social media, the $DIS stock bottomed at $90 and soared to a high in 2017 just above $116. Don’t tell me #BlackTwitter isn’t powerful! Then $DIS took a beating as price crashed at the beginning of the year. In early February, I left an early release screening of Black Panther with a new love for cinematography, set design and costume design in film. Not to mention the acting is good too. Black Panther is just a damn good movie. The box office has born that out with over $1 Billion in ticket sales and it is still 2018. And Disney won a new fan in me that day. I watched Avengers Infinity Wars beforehand so I would have proper context for Black Panther. And that was great too. I don’t think sequels are not out of the question here.

The chart above is from over 12 months ago. Here is the $DIS chart in April 2018 when the saw the movie.

$DIS weekly chart

And here is how $DIS closed the trading week on Friday.

DIS WEEKLY CHART

With a weekly close above $110, $DIS has not been at these levels since the new year and I believe it is not done rallying higher. And Disney is not done releasing hit movies. But it’s not that I like $DIS because the of the hit movies. Long term, I like Disney’s audacious move to launch its own streaming service. Given its vast archive of content and the hit films that are released just this year in 2018, it’s looking more and more like those dips in the stock price have developed into real opportunity.

ON THE AIR with F.A.C.E.

I was back on F.A.C.E. early this month on July 5th to chat about the summer trends in the major GBP currency pairs. Since I didn’t post the video here on the blog at that time, I thought it would be an interesting and fun exercise to backtest some of the forecasts I made with Dale at that time.

I spoke about the current downtrend in the $GBPUSD which needed to move higher and close above 1.3350 to reverse the sentiment. Well, we got to 1.3350 last week but sellers came in swift to push the $GBPUSD to new 2018 lows at 1.2956.

At the top of the month, the $EURGBP, after being stuck in a tight range, had just broke above the key 0.8850 resistance level. I spoke about the potential for the $EURGBP to establish a new range between 0.8800 and 0.8950 depending on the market reaction to Brexit news and non-farm payrolls. This week, the $EURGBP reached 0.8950.

The $GBPJPY and the $GBPNZD moved exactly as expected off their failed lows and highs, respectively. The $GBPJPY did break above the major 148 resistance level to new highs last week. The $GBPNZD did break lower too but it moved 300 pips lower I than expected.

So all in all, not bad. Three out of 4 calls is actually quite excellent in this business.


There are ebbs and flows to every market. Trade what you see. Learn how. Or simply invest with a pro. [sponsored]

ON THE AIR with FUTURES with Ben Lichtenstein

Yesterday, June 25th, was my 3rd time on this show. And it was my 1ST time feeling comfortable in front of the camera. A huge THANK YOU to Ben, Alex and the folks at TD Ameritrade Network. They kept asking me back, ha! That was a good sign after my initial appearance (which still makes me cringe lol). Thanks for giving me chance after chance.

My discussion with Ben focused on this week’s fundamental outlook. However, investors should watch these themes, not just for this week, but for this entire summer. Our investors spent the spring getting in position to take advantage of the summer opportunities brought about by active central banks, trade wars and risk aversion. Investors must always stay position to take advantage of developments as they come in markets. I talk to Ben about a few of them. Click the screenshot of my segment below to listen to the show.

CLICK TO WATCH THE FULL SHOW


There are ebbs and flows to every market. Trade what you see. Learn how. Invest with a pro. [sponsored]

ON THE AIR with Limit Up!

I had the immense pleasure of speaking with Eddie Horn of TopstepTrader. Eddie is host of a weekly podcast, “Limit Up!” where he talks with traders about their process and paths to success in trading markets. It has been several years since I spoke about my humble beginnings as an investor and forex trader and I really enjoyed the questions Eddie posed. The older I get, I realize my 10+ years in this business has been a roller coaster ride that many other people can, in fact, learn from.

My episode dropped Friday just after the market close. I love how the interview was put together. Eddie (and Mark Meadows, the show producer) make me look good here! I hope you enjoy it!


There are ebbs and flows to every market. Trade what you see. Learn how. Invest with a pro. [sponsored]

ON THE AIR with F.A.C.E.

This week, Wednesday, I had the pleasure to be back on the air with Dale Pinkert of Forex Analytix Community Experience. If you didn’t catch it live, you missed the opportunities I pointed out in the $GBPAUD and $GBPJPY.

Weakness has seized the GBP this morning after the recent UK GDP miss on top of the weakness in retail sales and inflation. There is no way the Bank of England raises rates in May or June. And that shift in sentiment now threatens to completely undo the recent GBP rally. See my thoughts ahead of this selloff.

There are ebbs and flows to every market. Trade what you see. Learn how. Invest with a pro. [sponsored]