fbpx

Facebook Share Price Sets To Appreciate Beyond $300 Psychological Level

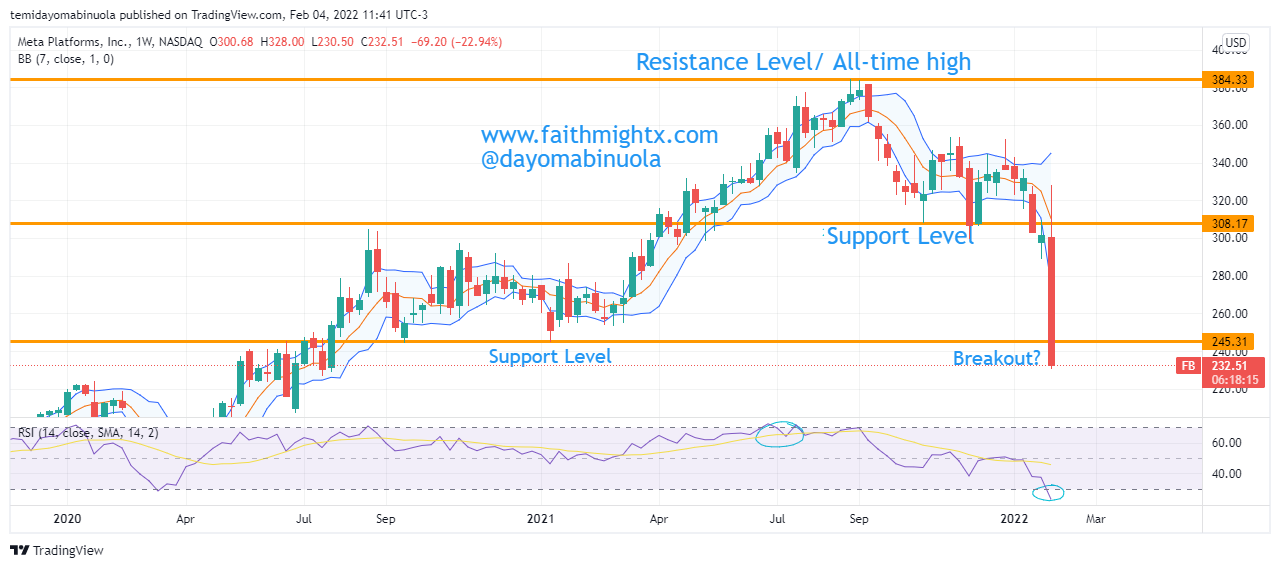
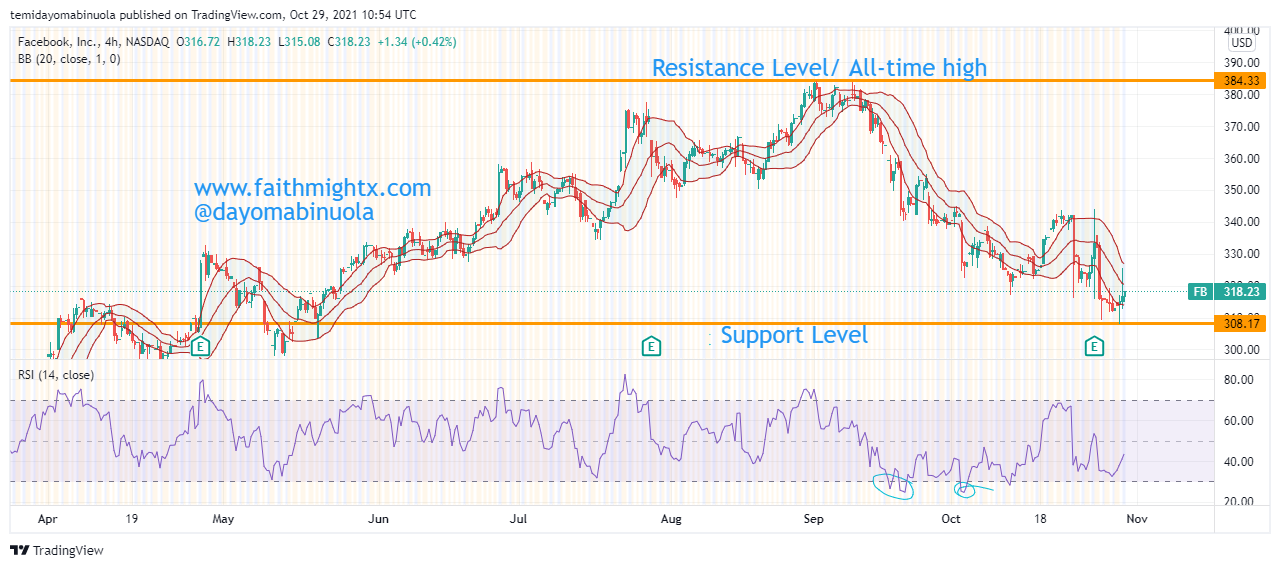
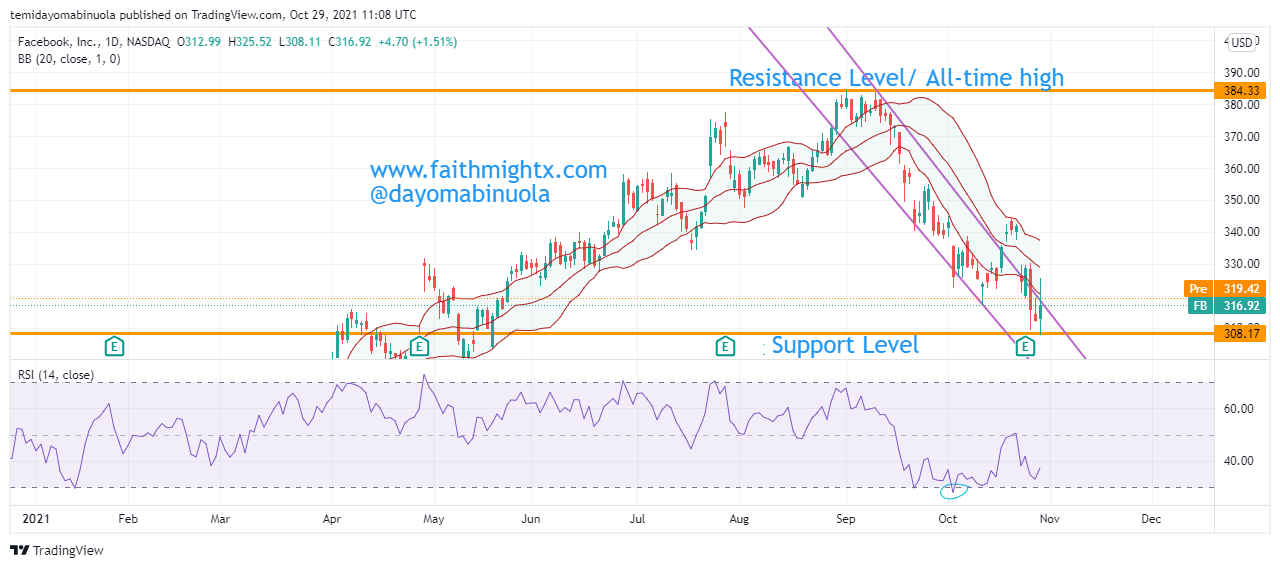
Facebook opened the year 2022 with a share price of $337, after it ranged for the most part of Q4 2021. Through the last quarter of 2021, the price ranged between $299 at the lower end and $353 at the upper end. The first breakout to the downside occurred on January 24, 2022. This breakout only lasted for a few days and the price found its way back into the range. On February 2, 2022, the price closed at $323 which was still in the range.

Daily Chart

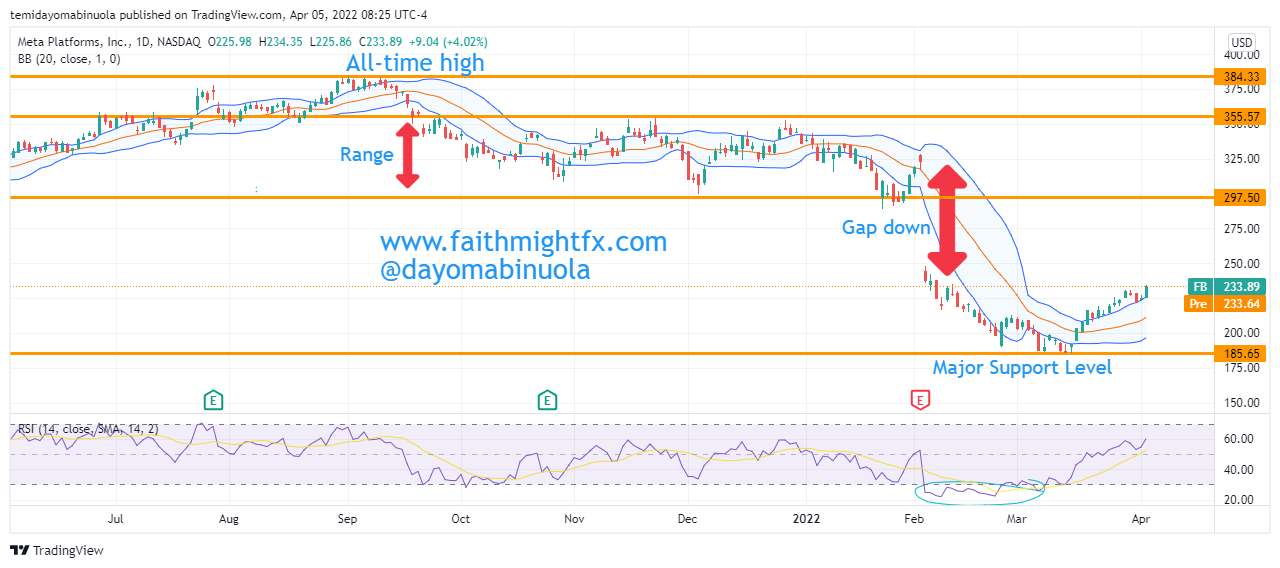
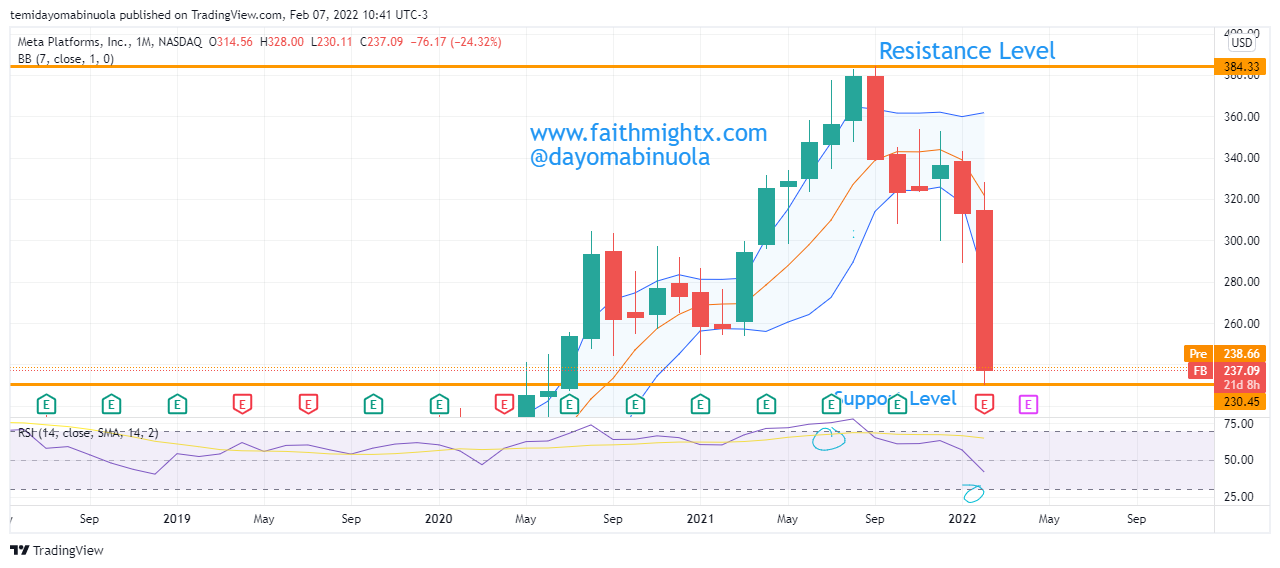
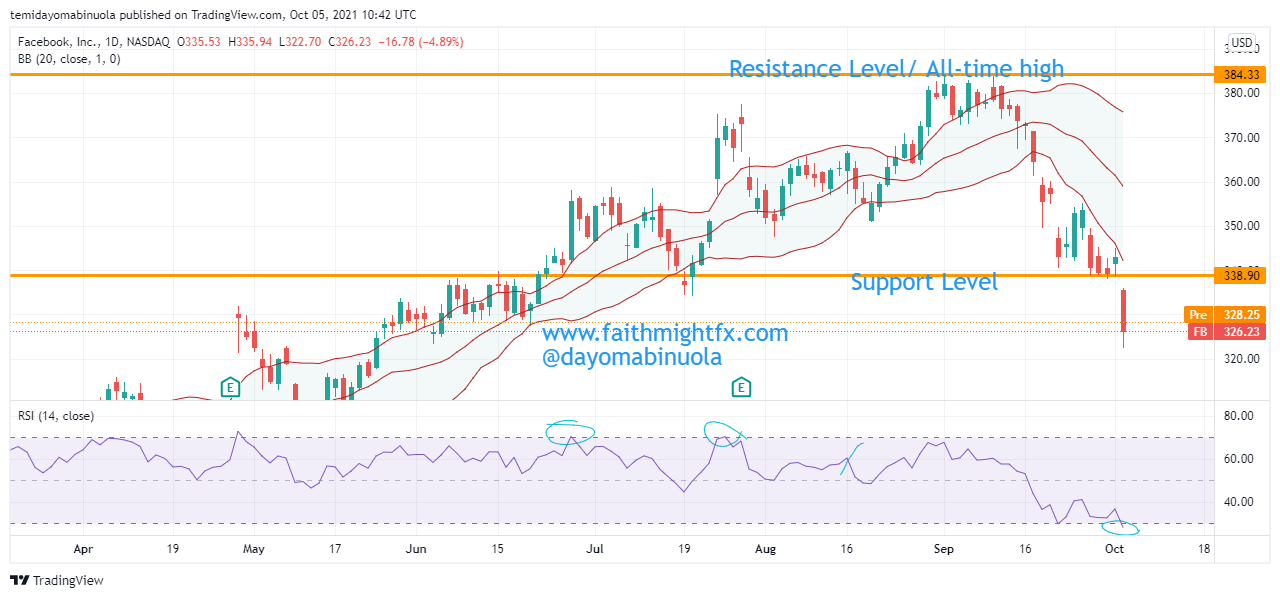
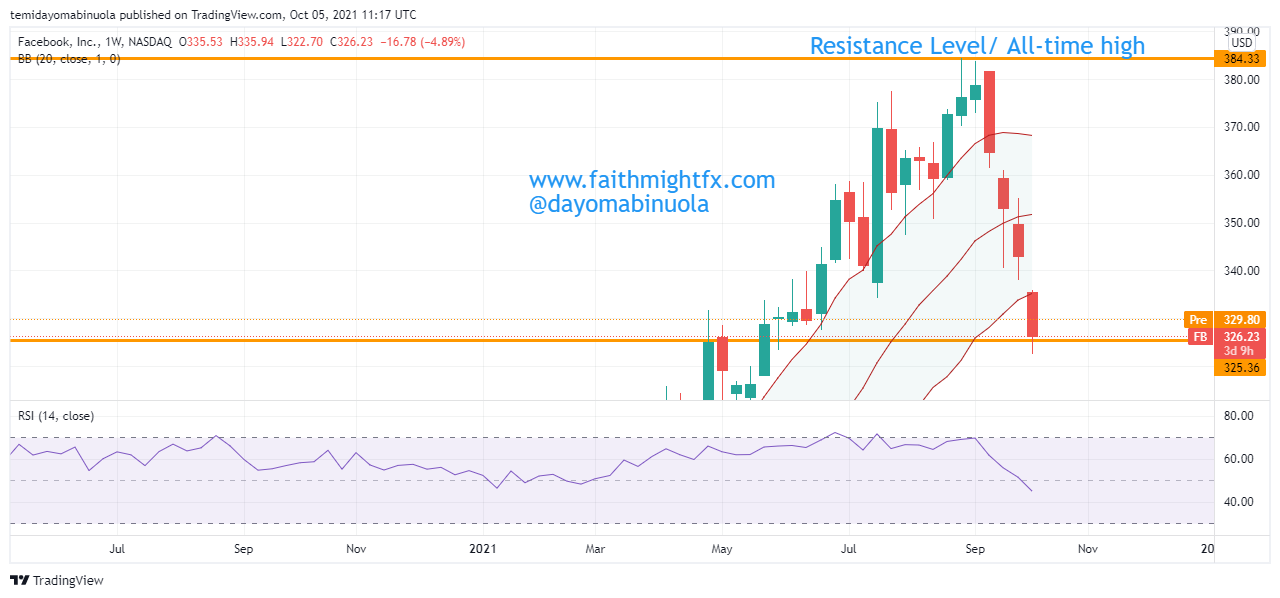
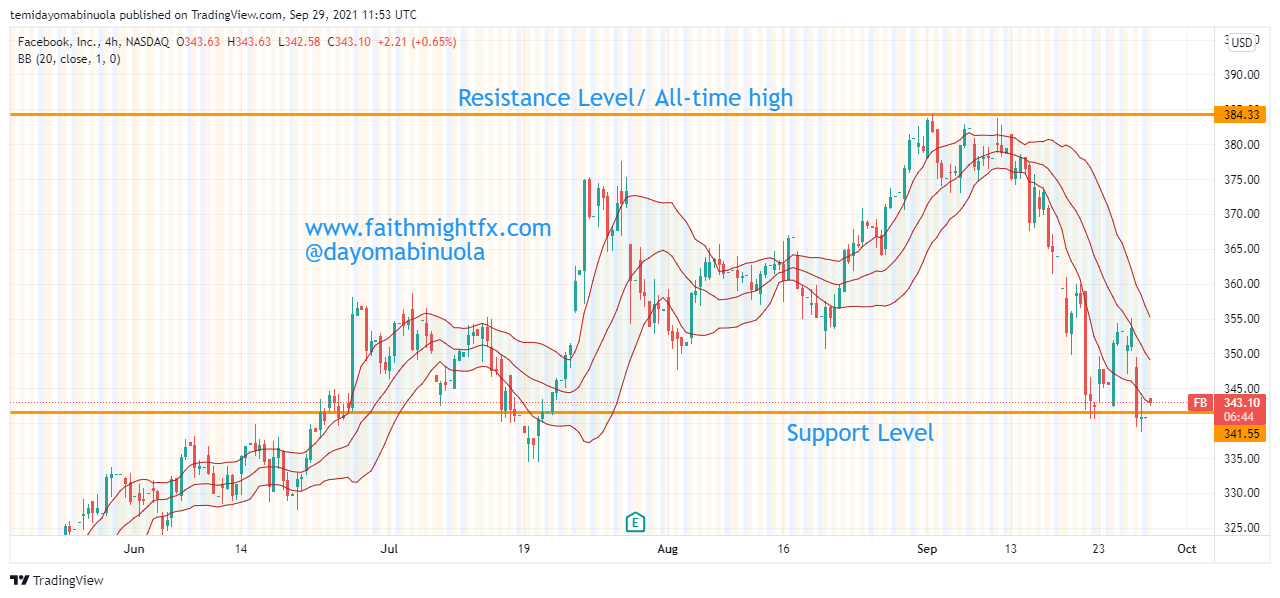
However, on the next trading day (February 3, 2022), a gap-down occurred which made the share price open at $244. At this point, the price was outside of the range and a bearish movement had kicked in as a result of the gap-down. The price kept falling till it hit a new support level at $186. This fall wiped out the profit that was made between June 2020 till September 2021 (the month when the price reached an all-time high at $384). The last time the tech giant’s share price got this low was in April 2020.

Weekly Chart

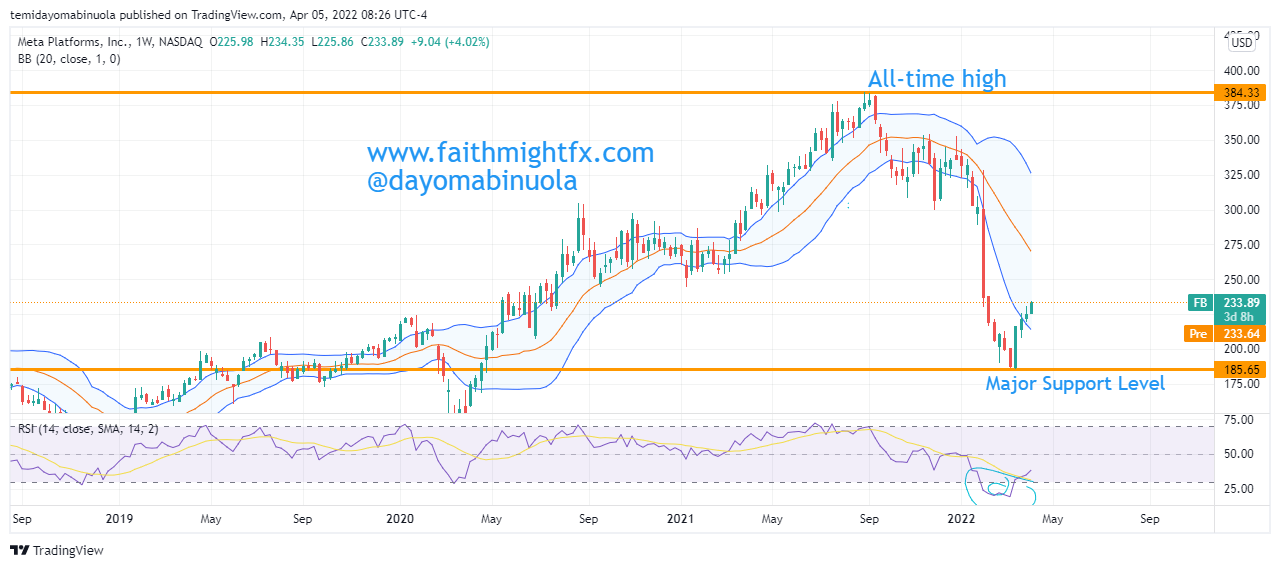
On March 16, 2022, the price bounced off the support line. RSI indicates oversold positions on the weekly timeframe. Could this be the bull run investors in $FB have been waiting months for? If this bull run continues, the share price could go beyond a psychological level of $300 and hit $368.

Some of these ideas are in our clients’ portfolios. To understand if this one can work for you or for help to invest your own wealth, talk to our advisors at FM Capital Group. Would you like more information on how to get stocks in your portfolio? Schedule a meeting with us here.

Meta Share Slumps, The Worst Day Fall For Any Stock

The Facebook parent company, Meta Platform Inc plunged 26% last week Thursday after the release of poor earnings results. About $251.3 billion in market value was wiped out, making it the biggest daily loss for any U.S. company ever. As a result of this fall, Mark Zuckerberg lost over $30 billion. This massive fall of Meta made other tech stocks fall, the likes of Twitter, Snap, and Pinterest.

Weekly Chart

In the year 2021, the opening price of Meta was $274.79 and closed at $332.46. The appreciation in price put smiles on the faces of investors. Now, the reverse is the case this year. The opening price of the Meta stock was $338.26 but now the price is at $237.01, which is a 30% loss from the year’s opening price. Long-term investors have nothing to fear about the most recent dip in the price of Meta. In the coming weeks, the price could rally to $381, which will eventually lead to a new all-time high.  There was a gap down when the market opened last week Thursday as a result of the earnings report. On Friday, Meta’s loss increased because of the continued bearish turn, but at the end of the trading day, there was a rally that formed a Doji. RSI using the daily time frame shows that price has been oversold, which could lead to a possible reversal.

Monthly Chart

Some of these ideas are in our clients’ portfolios. To understand if this one can work for you or for help to invest your own wealth, talk to our advisors at FM Capital Group. Would you like more information on how to get stocks in your portfolio? Schedule a meeting with us here.

Facebook Changes Name, Share Price Might Rise

Facebook Inc has been in the middle of a crisis for a while, which has negatively affected the share price since the beginning of September. On the 28th of September, Facebook Inc changed its name to “Meta Platform Inc”. There is a new technology named metaverse, which is termed surround-yourself technology, the CEO is committed to developing the technology, which I believe must be one of the reasons for the name change. The social network name is still called Facebook. Also, the leadership of Facebook Inc remains unchanged.

4hour Chart

The metaverse brings the internet to life or is rendered in 3D. Zuckerberg has described it as a “virtual environment” you can go inside of, instead of just looking at it on a screen. People can meet, work and play, using virtual reality headsets, augmented reality glasses, smartphone apps, or other devices. It has been said that Facebook will spend $10billion this year on the new technology. RSI has shown two oversold positions in September and October on the 4hour chart, after the dip in September. An upward breakout of the trendline occurred this October before the dip continued to reach new support at $308.17. The price movement shows the bulls broke the trendline again. With the introduction of the metaverse, Facebook might begin a major bullish movement back to the all-time high at $384.33

Daily Chart

The Daily chart shows it clearly that all profits made in the second half of this year have been lost as a result of the recent dip in September. Yesterday ended a bullish note as the Facebook name was changed to Meta.

Facebook Share Price Broke The Support Level

The Facebook share price has been enjoying a smooth ride as the bulls were able to take the price to an all-time high in September. After the all-time high was reached at $384.33, the price fell to $338.90. For the past 4 trading days, the price has been consolidating around the support level at $338.90, but the unusual happened yesterday as there was an outage. This outage affected the three-platform owned by Mark Zuckerberg i.e. Whatsapp, Facebook, and Instagram for about 6hours. Bloomberg gathered that the global service outage that kept its social media apps offline for much of Monday on a problem with its network configuration, adding that it found no evidence that user data was compromised during the downtime. 

The $FB market opens at $335.75 yesterday and the price went as low as $322.25, but the market closed at $326.23. There is a rise in the pre-market price as the price is currently at $328.25. Taking a looking a weekly chart, the price was already overbought on the RSI, the outage only brought about a correction in price. The last 3 trading weeks show the price of $FB has been falling prior to the outage. A gap down occurred at the end of the second trading week in September, price is yet to retrace to the gap down. Also, yesterday’s opening price was after a gap down. Investors should be hopeful, as the price could retrace in the coming weeks to the second, then the first gap down.

The share price of $FB is currently at the lower region of the Bollinger bands. As normalcy is restored to the various platforms owned by Facebook Inc, we hope the price of $FB will begin to rise.

Facebook Share Price Dips

Facebook is an American online and social media and social networking service owned by Facebook Inc. In Facebook’s 17years of launch, the social networking site has about 2.85billion users as of 31st March 2021. $FB’s investors have had a rewarding year as the opening price was at $259.20. The price was able to reach $384.33 this September before a correction began. The correction has pushed the price lower to $340.65 at the close of the market yesterday. After the price reached a new all-time in June 2021 at $341.74, $FB share price has continued to rally. The new support level is around $341. The bears were able to push the price lower in July, but it was a fake-out of support at $341.

Despite RSI showing that the price has been overbought at three different times on the 4hr chart, there was an oversold indication in the past few days. The candlesticks still maintain the lower region of the Bollinger bands. There are tendencies the bulls might become very active soon, thereby appreciating the price of $FB. Since the acquisition of Whatsapp in 2014, Facebook has increased its price by a 5X growth rate. Also, price appreciated furthermore after the dark mode was launched on mobile devices. The share price might be boosted as Facebook expands the metaverse initiative with $50million.

Facebook Share Price To Fall

On the 25th of January, we released an article stating Facebook bears are getting out of the market. At this point, our expectation for $FB share price to reach 160 has been met, which could pave way for the bears to resume trading. A breakdown from the trendlines A and B occurred in the last two trading days of last week. A double bounce in price touched the resistance level at 174.14 in the last 2 months, technically indicating a possibility for a reversal.

On the 31st of January, there was a jump in the price of $FB from 150.61 to 165.36. Ever since the jump occurred, a range in price resumed. Price of $FB is beginning to touch the middle Bollinger band line, which might likely indicate a weak bullish trend. Though the future of Ichimoku shows no reversal, price of $FB might begin to fall. A fall in price might make the $FB shares to drop to 139.06. Taking a further look at the RSI, price of $FB has been overbought, preparing for a reversal.

Facebook Bears Might Be Getting Out Of The Market

The second half of 2018 went sour for Facebook investors when a long dip began in July. Share price moved upward to reach 218.11 and fell to 123.25. $FB has enjoyed a smooth ride in the past few years without much hassle until the dip. The fall was at 43.5% which was the worst fall in the history of $FB shares. Most of the stocks in the market fell towards the end of 2018. Technically, an M sign has been formed holding on to a strong support at 123.25.


RSI is currently showing oversold. This oversold position was last reached in 2012. If $FB bulls get into the market amass, this could lead to a change of trend in the bullish direction. The share price of $FB might reach 160 from its current 145.97 when the bulls take charge fully. A breakout of the resistance level might make the bullish movement to continue. Though Ichimoku is yet to give a change of trend, price might also get into range before the uptrend begins.

Facebook is Done

I love Facebook. I connect with my tribe there every day and it is fabulous. But I am completely over $FB, for a few reasons:

  1. People are leaving Facebook. While people are always leaving Facebook for one reason or another, the exodus never eclipsed the number of new people and businesses that signed up every day. Last quarter, Facebook reported a decline in users for the first time ever. And they warned that they expect that decline to continue. With 2 billion users on Facebook and a population of 7 billion on the Earth, how many more users can it really get at this point?
  2. History has shown that election season tends to be very lucrative for Facebook. But thanks to Cambridge Analytica, don’t be surprised if they see an actual decrease in revenue during this election cycle. If the market is surprised, it won’t be in a good way.
  3. I’ve been side eying $FB stock since the Cambridge Analytica fiasco anyway. But $FB hit $200 twice after that. So when the stock started to dip again, I knew there was real weakness. But thinking of all the mutual funds and hedge funds that hold this stock, I thought it would get back to $200 as they buy more shares on this dip too. With stock markets moving higher and higher all year despite trump and tariffs, I didn’t foresee rising interest rates to be the eventual catalyst for a decline in equity markets. I’m paying more attention to that as rates will go higher.

FB WEEKLY CHART AS OF TODAY

Read our work on $FB this year. We have been skeptical all year and current price action continues to confirm our sentiment.  Before the earnings report was released yesterday, $FB made new lows for the year at $139.03. While this may be new lows, it is also a 38.2% Fibonacci retracement so the post-earnings bounce is a move we were watching for. The question is now the follow through higher, which is expected on a Fibonacci move. However, the aforementioned reasons could see a failed high before we see a new high.

There are ebbs and flows to every market. Trade what you see. Or learn with me. And invest with a pro. [sponsored]

Sources: What’s behind Wednesday’s market selloff?
(NPR)

FB Looks Vulnerable

This is the first time that $FB has ever revisited lows on the monthly chart. Here, on the weekly, this is nothing new. The contrasting price action in these timeframes suggests that if September ends the month, and quarter, at new lows, $FB becomes very vulnerable heading into election season and the last quarter of the year.

Ever since $FB broke above $55 after a brief pullback at the then-highs, there has not been a dip that revisited after the recovery. The fact that price is not only below $200 after making the new all-time high at $218.62 back on July 25th, it is back at the previous lows. Price stands less than twenty dollars shy of those Cambridge Analytica lows of 149.02, as of this writing.

FB WEEKLY CHART

Price is also sitting on the 38.2% Fibonacci retracement. It could hold here. Or break lower. The real question becomes what do you below $149 or above $200? My answer to you: what is your timeframe?

COULD FACEBOOK SHARES BE SINKING?

Facebook shares sank in the month following the Cambridge Analytica revelations, and they remain down more than 2 percent in 2018 against the S&P 500’s 7 percent climb.

The stock was set to add to the year’s losses Wednesday morning, down 0.3 percent in pre-market trading. In the last one year, facebook shares has grown by 3.52%, In the last 3 months, it went down at an average of -6.61%; In the last 1 month, it went down by -1.49%; In the last 5 days, it went down, -0.61%. Facebook shares has been ranging ever since its share price dropped towards the end of the market day on the 25th of July, 2018. Its fall might continue since there are unresolved issues around the brand, Facebook.

The senkou span(purple colour) of the Ichimoku kinko Hyo shows the future of the market to be a downtrend or on a sell region. The RSI is above 70 which shows it is overbought for a long time and now in the sell region. It has not been oversold on the daily time frame. There are tendencies there will be more selling of the facebook shares.