Davita is a US healthcare service provider with a focus on kidney dialysis services. Davita has over 2800 outpatient dialysis centers in the United States which serves over 200,000 patients. They also have 321 outpatient dialysis centers in 10 other countries serving 3200 patients.
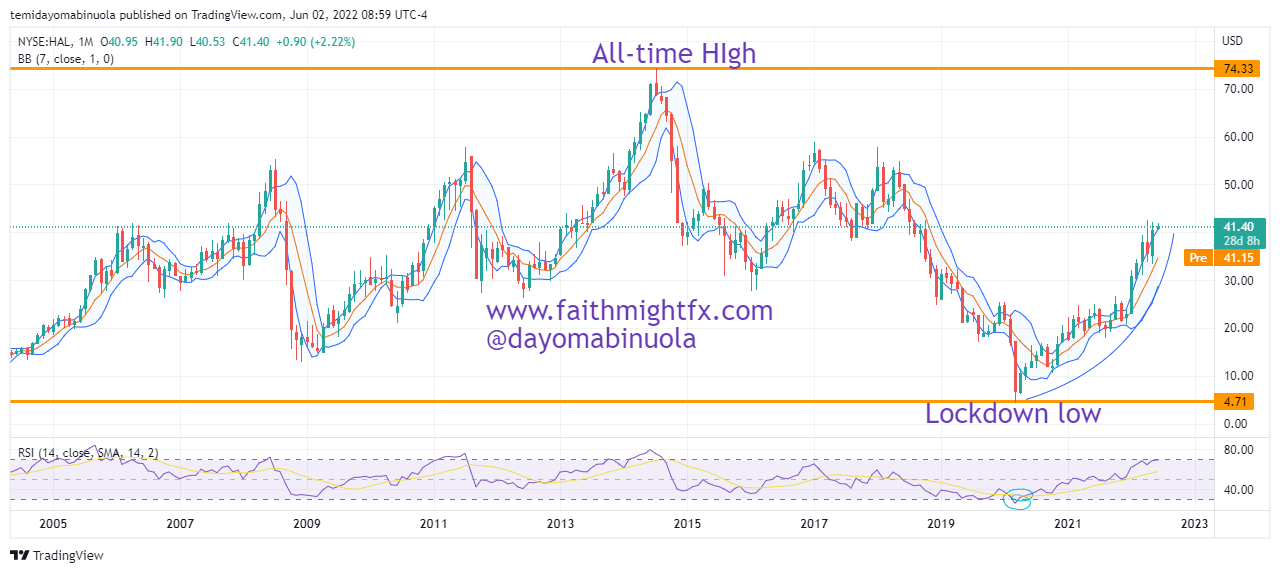
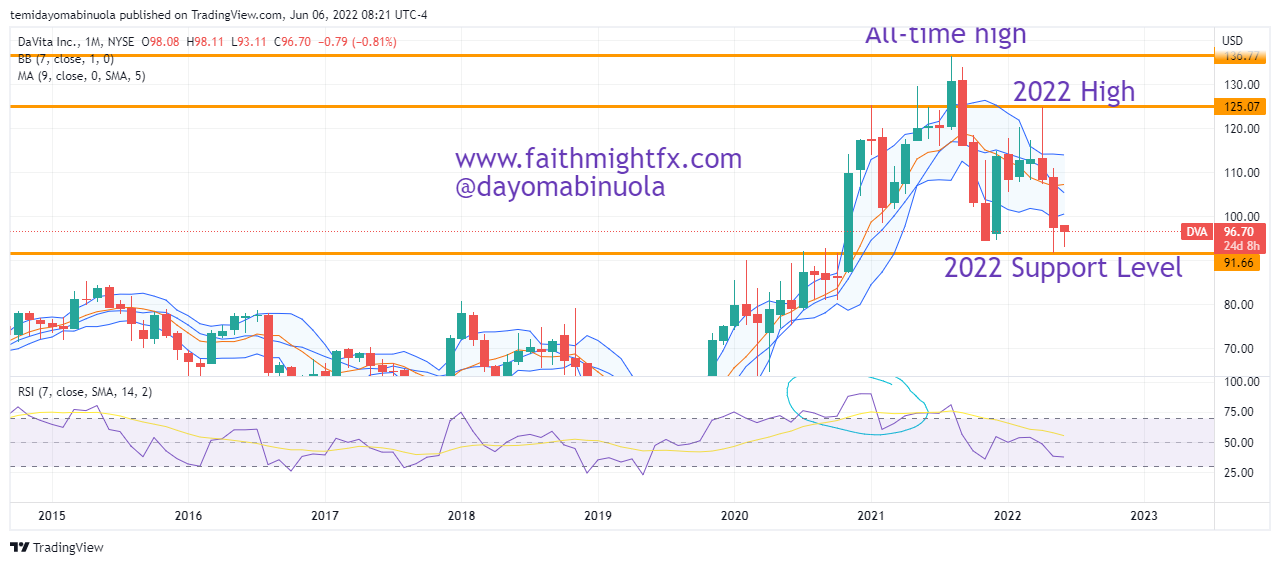
Davita was founded in 1979 and it got listed on the New York Stock Exchange in 1995 at $3.50 IPO price. Price rallied for a few years after the IPO but in the year 2000, price fell to $0.72 per share which is Davita’s worst share price ever since it launched on the NYSE. Since then, Davita’s share price has rallied to an all-time high at $136.62 in August 2021. This is over 100X of the lowest ever price.
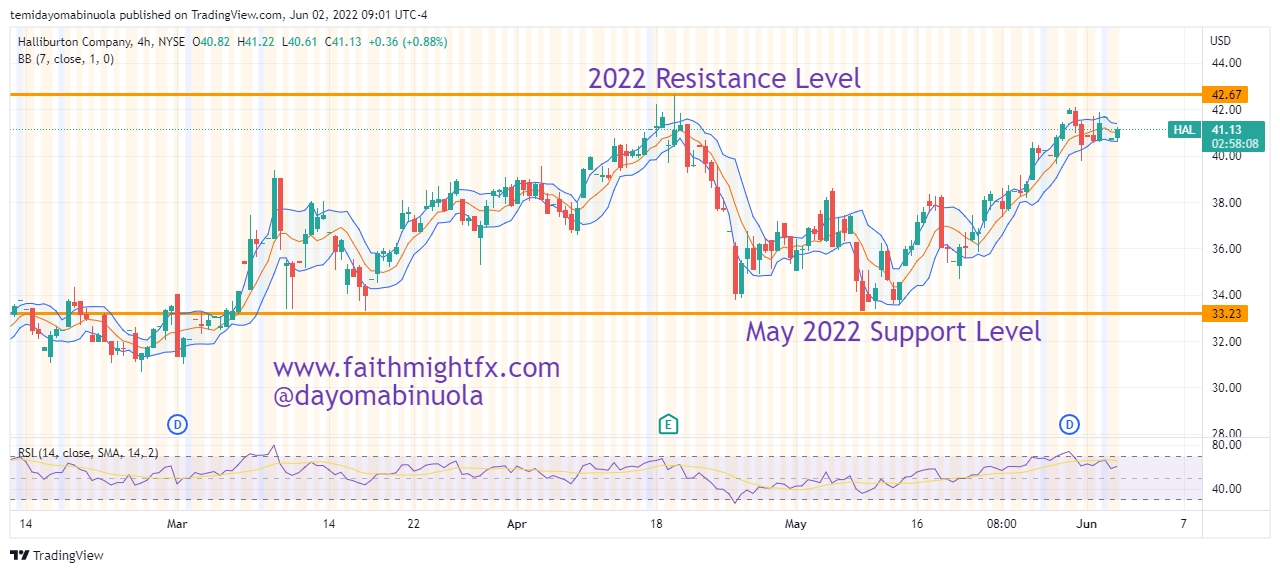
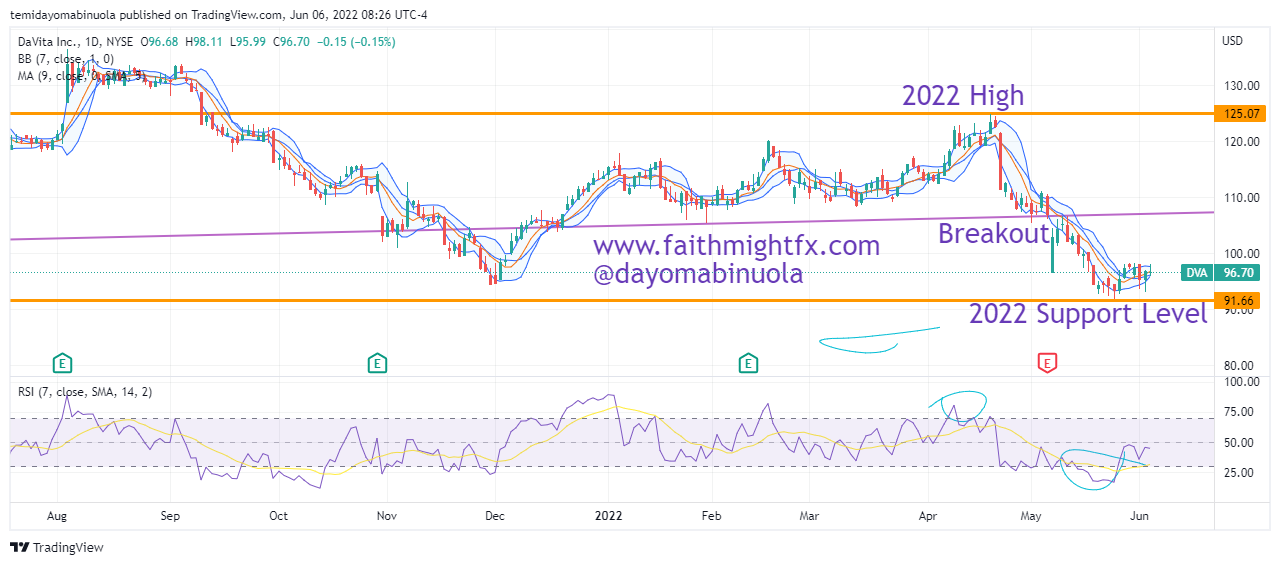
When price reached an all-time high, RSI also showed that price had been overbought on the monthly time frame. Price fell shortly afterwards to $94.34 in November 2021. The opening price of Davita at the start of the year 2022 was $114.10. Price rallied to the current year’s high at $124.85. However, the bears are back in action as Davita’s share price closed below $100 at the end of May.
As price consolidates in the next few weeks, we might be seeing a price rally above $100. Our analysts are seeing the price of Davita rise to $120 in the coming months. The recent news of Davita’s partnership with Medtronic to form a new kidney tech company worth about $200million could also trigger a rally from a fundamental analysis standpoint. We’ll see!
Some of these ideas are in our clients’ portfolios. To understand if this one can work for you or for help to invest your own wealth, talk to our advisors at FM Capital Group. Would you like more information on how to get stocks in your portfolio? Schedule a meeting with us here