Looking at the monthly time frame over the last two decades, NZD has continuously gained against the USD. The highest price within this time span was at 0.88396 which occurred in September 2011. After this time, NZDUSD consolidated for another 3 years after which it began to dip leading to the US Dollar gaining against the New Zealand Dollar.
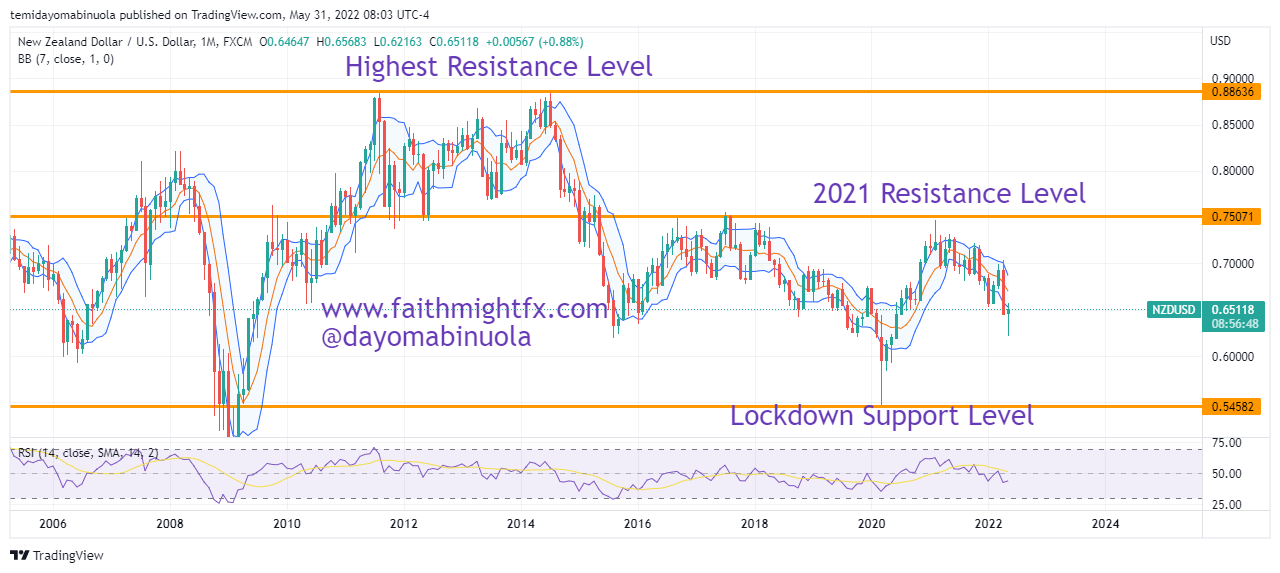
The first major drop in price brought NZDUSD to 0.61967 in July 2015. There was a bounce in Q4 2015 that initiated a bullish run that lasted till Q3 2017. This upward trend took the price to 0.75525 in July 2017 which was the highest price for that year. After this high, the New Zealand Dollar began to lose against the US Dollar. On the downward trend, price went as low as 0.54704 which occurred during the lockdown, in March 2020 precisely.
There was a jump in price in April 2020 and a bullish run ensued for the next 12 months, shooting price to 0.74678 in April 2021 – a gain of about 2000 pips. This price will be the highest in the year 2021. The bears kicked in again, forming an inverse head and shoulder on the monthly time frame.
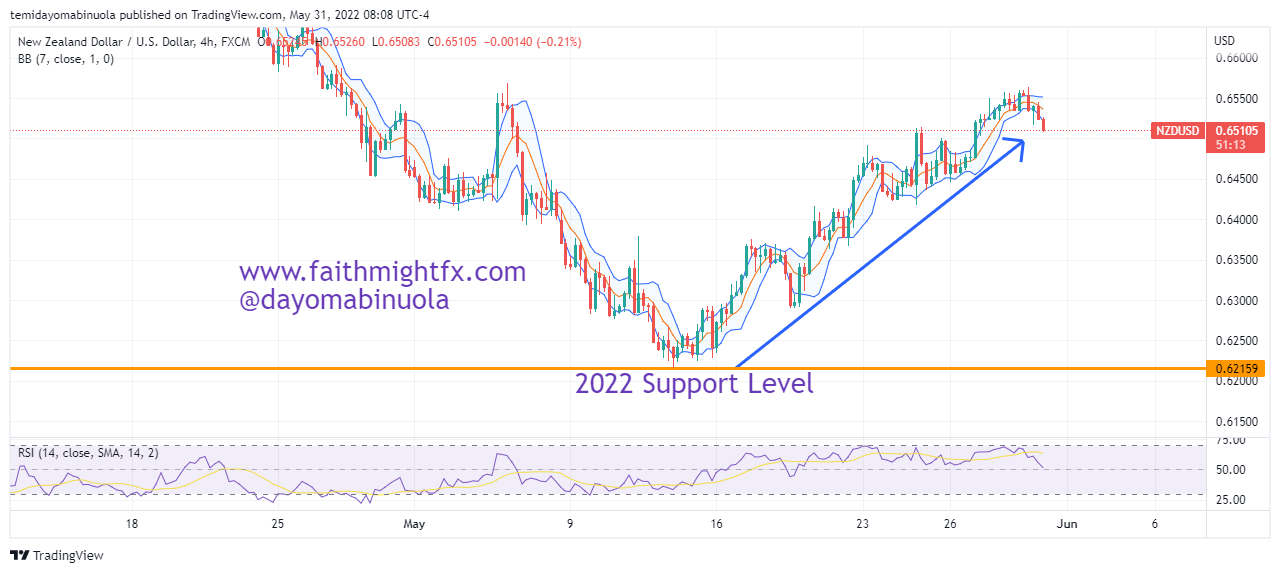
Since May 2022, NZD has been rallying against the USD and as a result, the price reached 0.65610 which stands as May’s resistance level. The USD in the coming days or weeks might gain against NZD as price might fall below 0.64271 which is about a 100 pips gain in favor of the US Dollar.
Some of these ideas are in our clients’ portfolios. To understand if this one can work for you or for help to invest your own wealth, talk to our advisors at FM Capital Group. Would you like more information on how to get currencies in your portfolio? Schedule a meeting with us here