Since the beginning of the year, the US dollar has gained against the British Pound. The opening price at the beginning of the year was at 1.35307. On the 13th of January, the British Pound rallied against the USD to hit 1.37490 which currently stands as the year’s high.
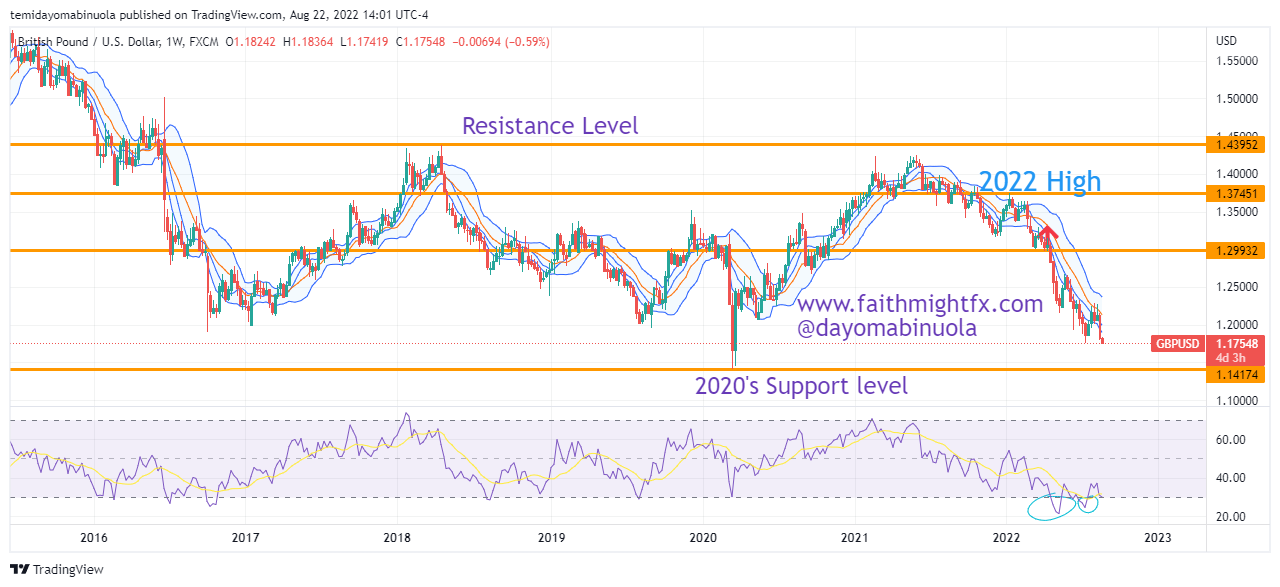
In a turn of events, the US dollar began to gain massively. Although the US inflation is hitting record highs, the US dollar is still stronger when the effect of inflation on the US economy is compared to the effect of inflation on the economies of other nations. On the 7th of March 2022, the bears that have been pushing the GBPUSD downwards succeeded in getting the pair to break the 2021 support level of 1.31637.
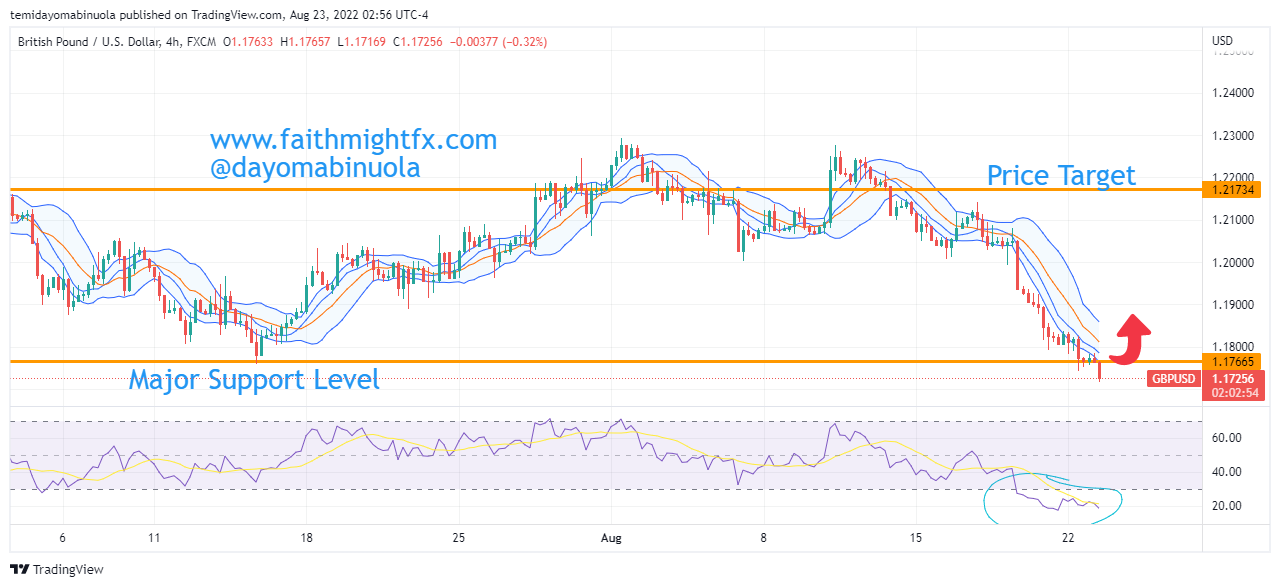
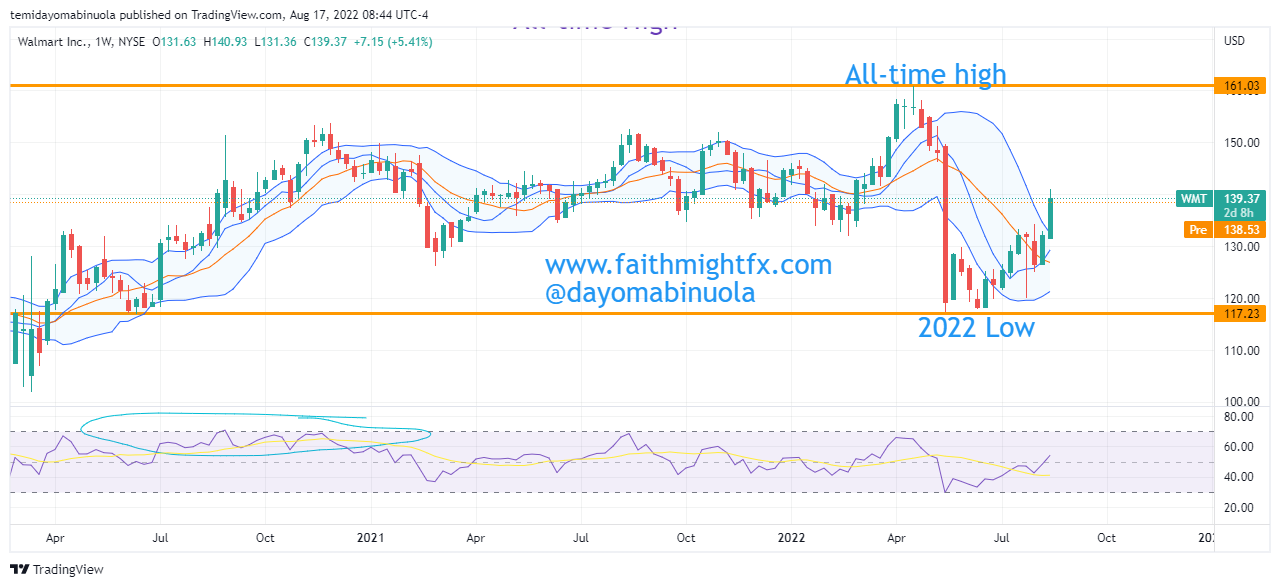
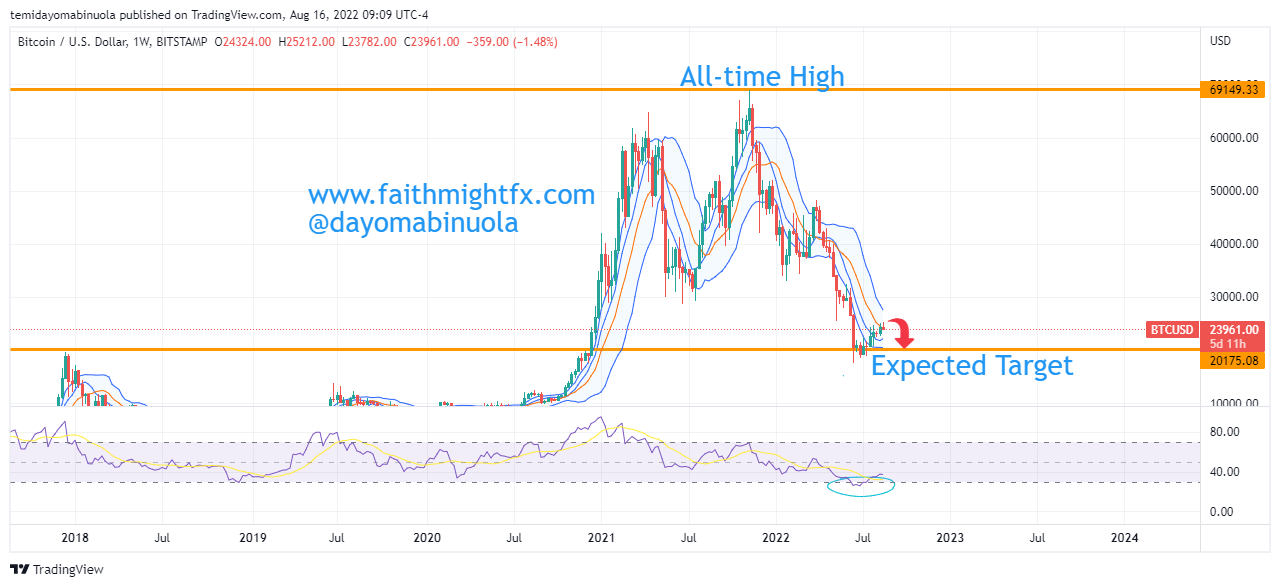
Price is currently at 1.18049. In the next few days, we might be seeing price consolidating around the 2020 support level at 1.14135. This consolidation could last for days and eventually, GBPUSD might see its next bull run to 1.21699. Previously in May 2022 and July 2022 on the weekly chart, RSI indicated that price had been oversold.
Some of these ideas are in our clients’ portfolios. To understand if this one can work for you or for help to invest your own wealth, talk to our advisors at FM Capital Group. Would you like more information on how to get currencies in your portfolio? Schedule a meeting with us here