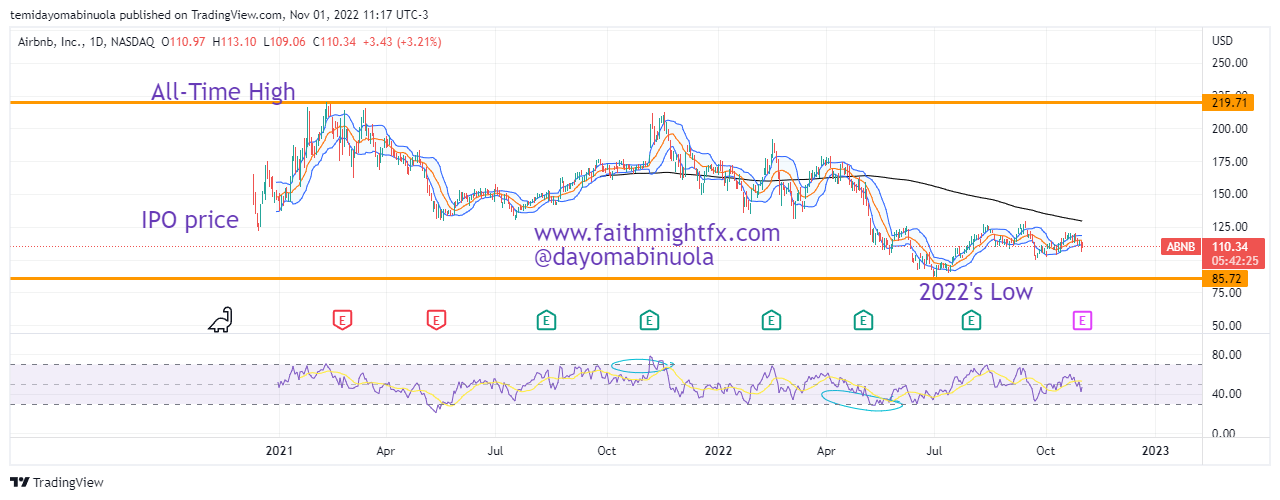
AirBnB had its IPO in December 2020 at $145 per share. This IPO was done a few months after the ease of lockdown globally. Price rallied to $219, an all-time high, on February 11 2021. The rally was short-lived as price fell to $129.49 in May 2022, which was below the IPO price. There is a report that indicates that travel around the world is starting to slow because of high energy prices, and consumers are having a second thought before going on vacation. The housing market is currently in turmoil, which could spill over to the AirBnB market.
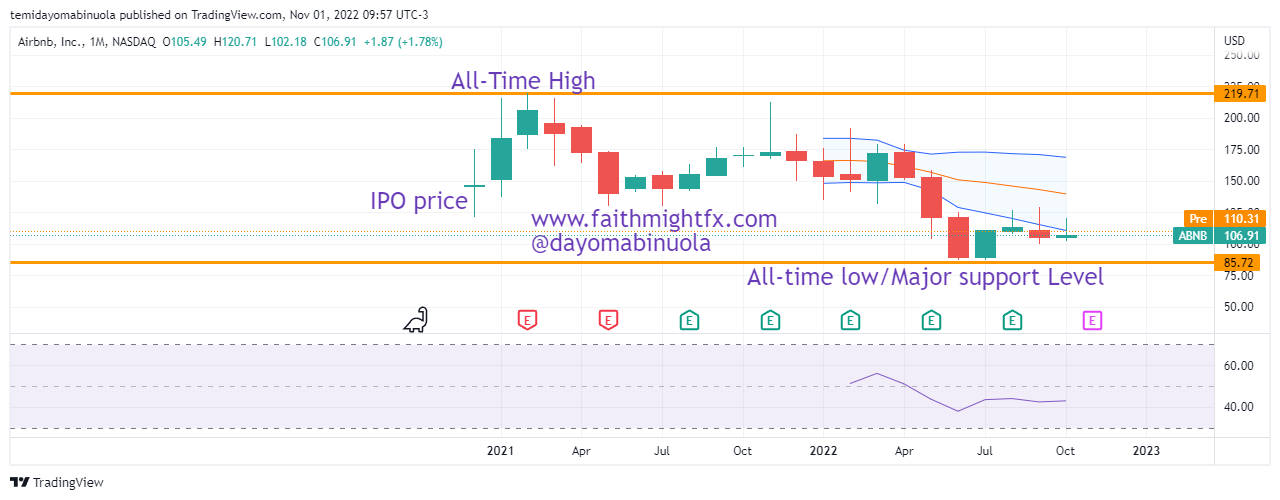
Since the beginning of the year, AirBnB has been down by 32.46%. As a result of the fall, price crossed the $100 psychological level for the first time as it hit $85 in July 2022. Price is consolidating on the weekly chart, as the price of $ABNB is currently at $110.30. A rally to $196 might occur in the coming months.
Some of these ideas are in our clients’ portfolios. To understand if this one can work for you or for help to invest your own wealth, talk to our advisors at FM Capital Group. Would you like more information on how to get stocks in your portfolio? Schedule a meeting with us here