Shopify is a multinational e-commerce company headquartered in Ottawa, Canada. As of 2021, the revenue of $SHOP was $4.61 billion with a total number of 10,000 employees. Shopify’s IPO took place on May 21, 2015, on TSX and NYSE at $17 per share. Right from its IPO, Shopify investors have enjoyed a rather smooth rally for years up until its all-time high at $176 in November 2021. After the month of the all-time high, the next 7 months closed bearish on the monthly charts.
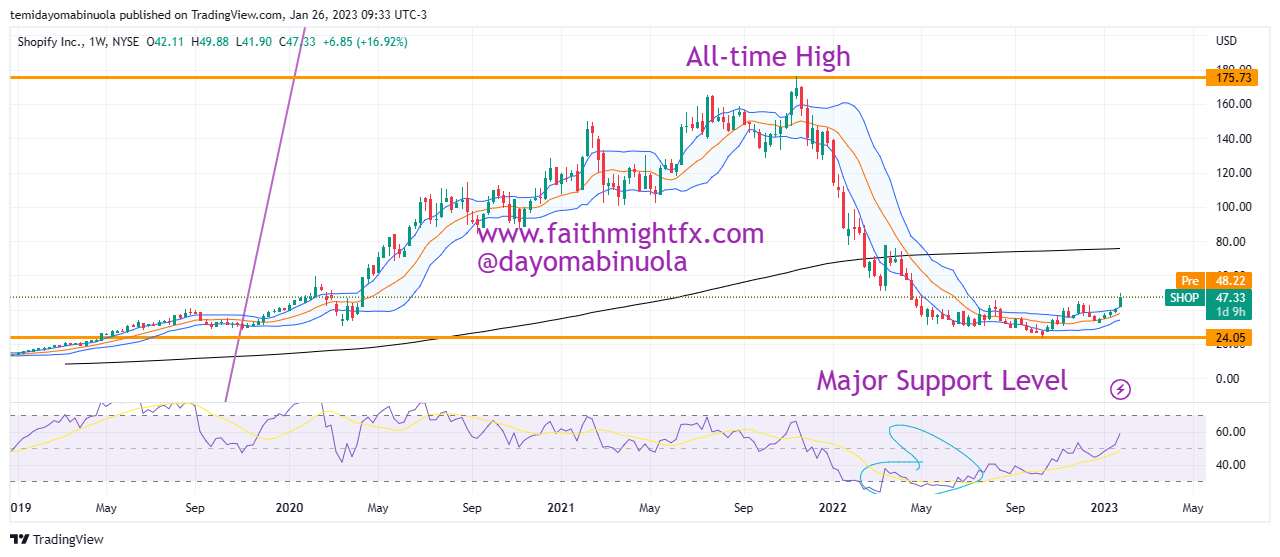
Weekly Chart
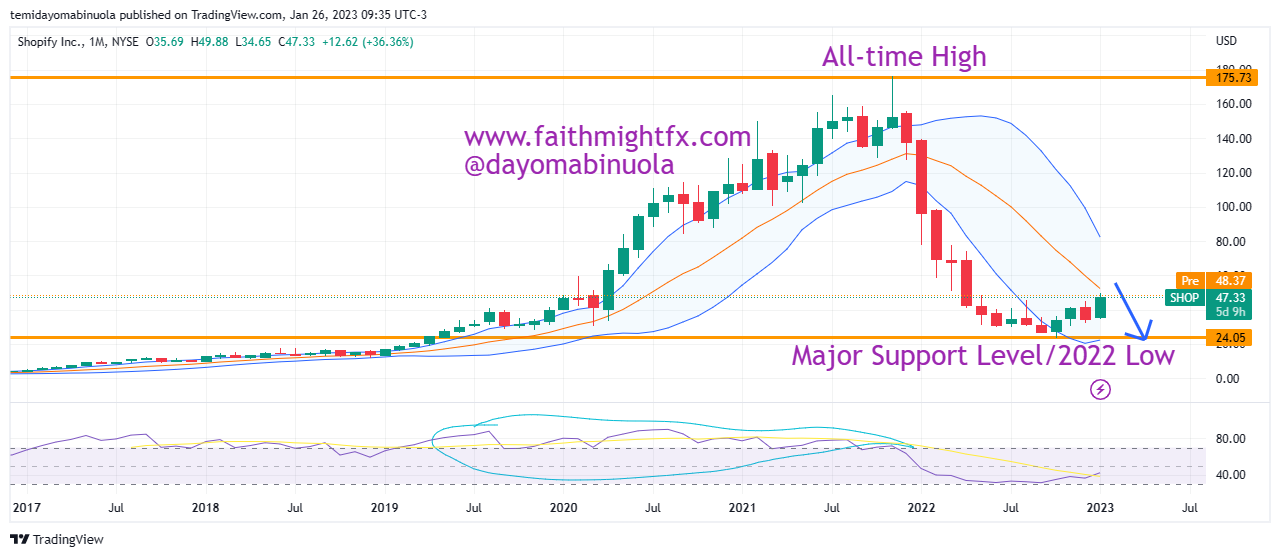
In October 2022, price had dipped as low as $24.05 as a result of the bearish run from the all-time high. That was over 86% decrease in value. Since 2023 opened, Shopify’s share price has been rallying. This rally has taken price up to a 9-month high. Currently, price is at $47.33. This rally might be for a short period of time as the bears might push price lower below $23 in the coming months. The weekly chart shows price is oversold but the monthly chart shows price has been overbought. The bullish momentum might be counteracted with an aggressive bearish turn.
Monthly Chart
Some of these ideas are in our clients’ portfolios. To understand if this one can work for you or for help to invest your own wealth, talk to our advisors at FM Capital Group. Would you like more information on how to get stocks in your portfolio? Schedule a meeting with us here
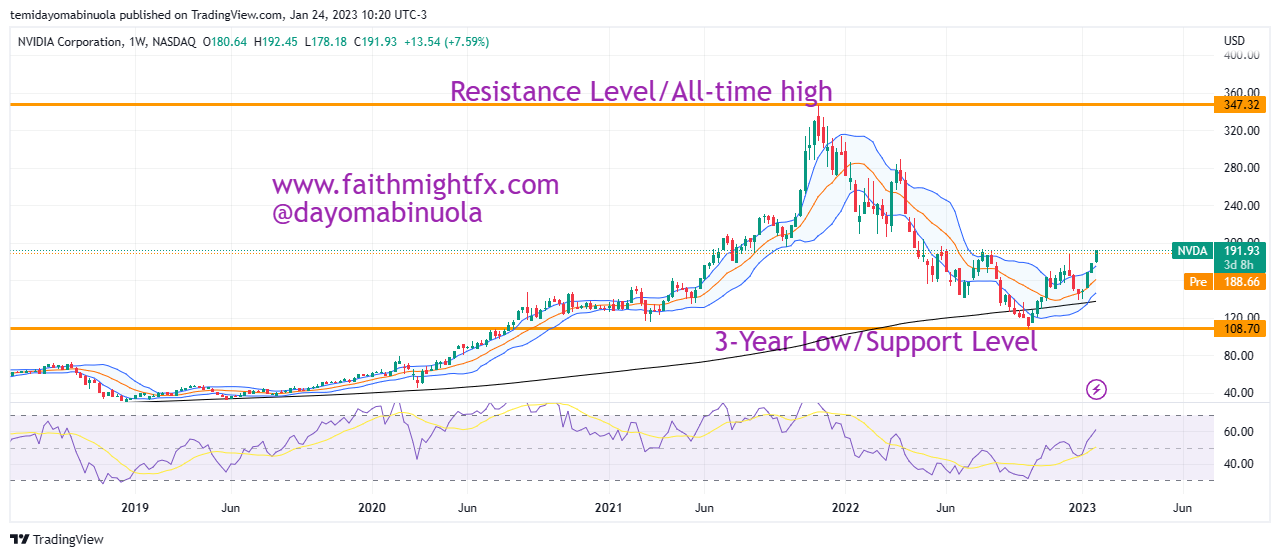
NVIDIA is an American multinational technology company based in California, USA. The company designs graphics processing units. It was founded on the 5th of April, 1993 by Jensen Huang, Curtis Priem, Chris Malachowsky. As of 2022, NVIDIA made a yearly revenue of $26.91 billion. As of that same year, NVIDIA had a staff strength of 22,473.
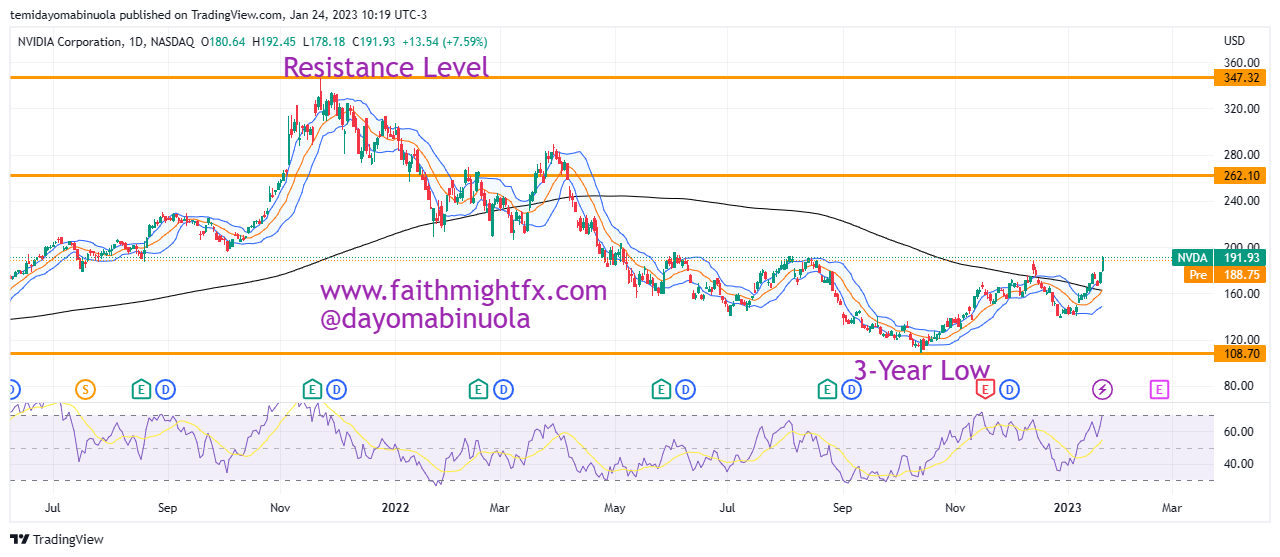
Daily Chart
The lowest value of NVIDIA since August 2020 stands at 108.70, which also stands as the support level of 2022. The year 2022 was not a good year for NVIDIA investors as price opened at $298.12 and closed at $146.03 – a 39% loss. There seems to be relief as price began to rally after a bounce from support in the last quarter of 2022. 2023 opened at $147 and price has rallied to $191.93, a 30.5% increase in about a month. The last time price of $NVDA was at $191.93 was in August 2022, which was the previous resistance level.
Weekly Chart
We might be seeing the price of $NVDA reaching $200 per share in the coming weeks.
Some of these ideas are in our clients’ portfolios. To understand if this one can work for you or for help to invest your own wealth, talk to our advisors at FM Capital Group. Would you like more information on how to get stocks in your portfolio? Schedule a meeting with us here
Global economic activity is experiencing a broad-based and sharper-than-expected slowdown, with inflation higher than it’s ever been in several decades. The cost-of-living crisis, tightening financial conditions in most regions, Russia’s invasion of Ukraine, and the lingering COVID-19 pandemic all weigh heavily on the outlook. Global growth is forecasted to slow to 2.7 percent in 2023 from 3.2 percent in 2022. This is the weakest growth profile since 2001 except for the global financial crisis and the acute phase of the COVID-19 pandemic.
Taking a look at a few of the markets in 2023:
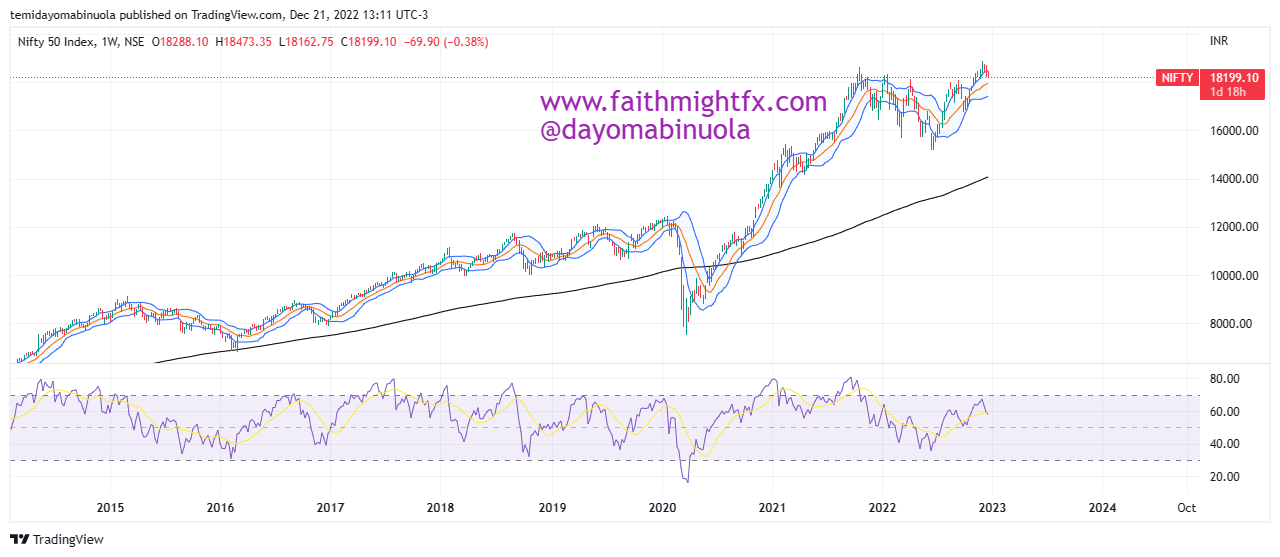
1. Nifty 50: This is a benchmark Indian stock market index that represents the weighted average of 50 of the largest Indian companies listed on India’s National Stock Exchange. Nifty 50 had a bounce from the lockdown lows in 2021. This appreciation continued in 2022 as price reached an all-time high at 18900 in the last week of November. The first half of 2022 was dominated by the bears until July when the bulls pushed price to a new all-time high. in 2023, we might see Nifty 50 below 15000.
NIfty 50
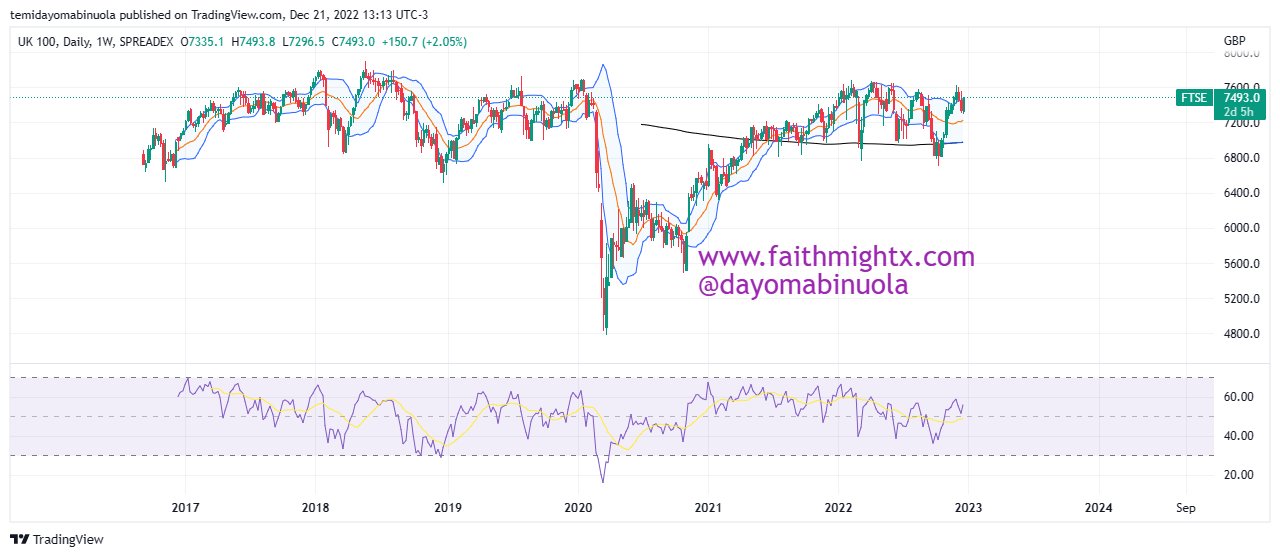
2. FTSE 100: This is a share index of the 100 companies listed on the London Stock Exchange with the highest market capitalisation. Just like Nifty 50, the FTSE 100 bounced from the pandemic lows. The FTSE 100 ranged between 7600 and 7682 in 2022. We might see a breakout of the resistance level of 7682 in 2023.
FTSE 100
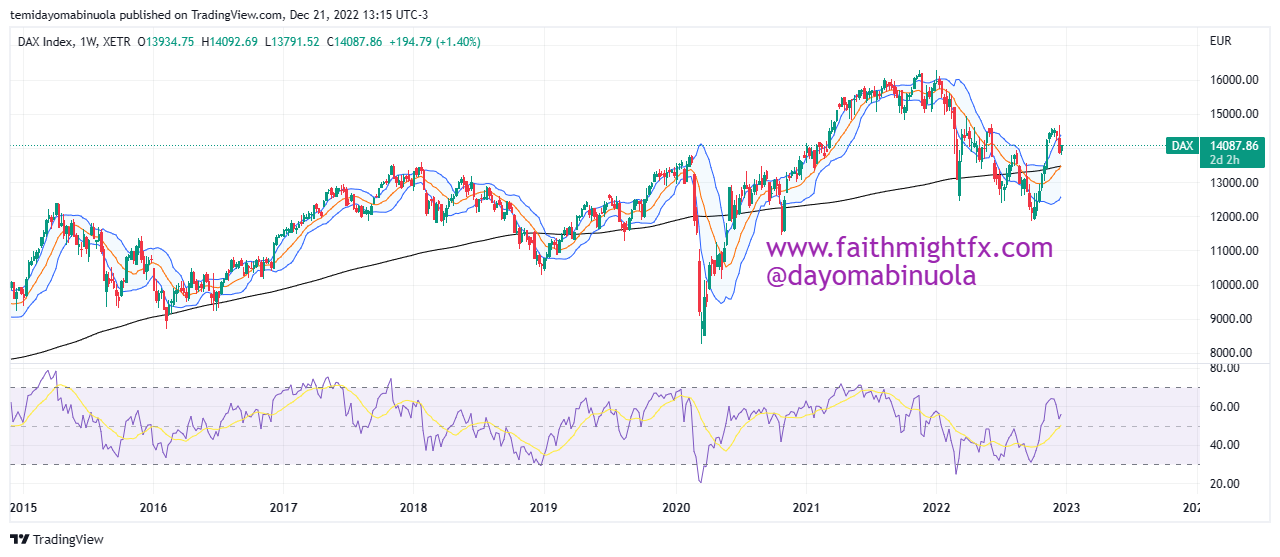
3. DAX: The DAX is a stock market index consisting of the 40 major German blue-chip companies trading on the Frankfurt Stock Exchange. The DAX rallied in 2021 from a 2022 low of 8288 to an all-time high at 16278. The first three quarters of 2022 were bearish until October as the bulls pushed the price of DAX upwards. The price of DAX could reach a new all-time high in 2023.
DAX
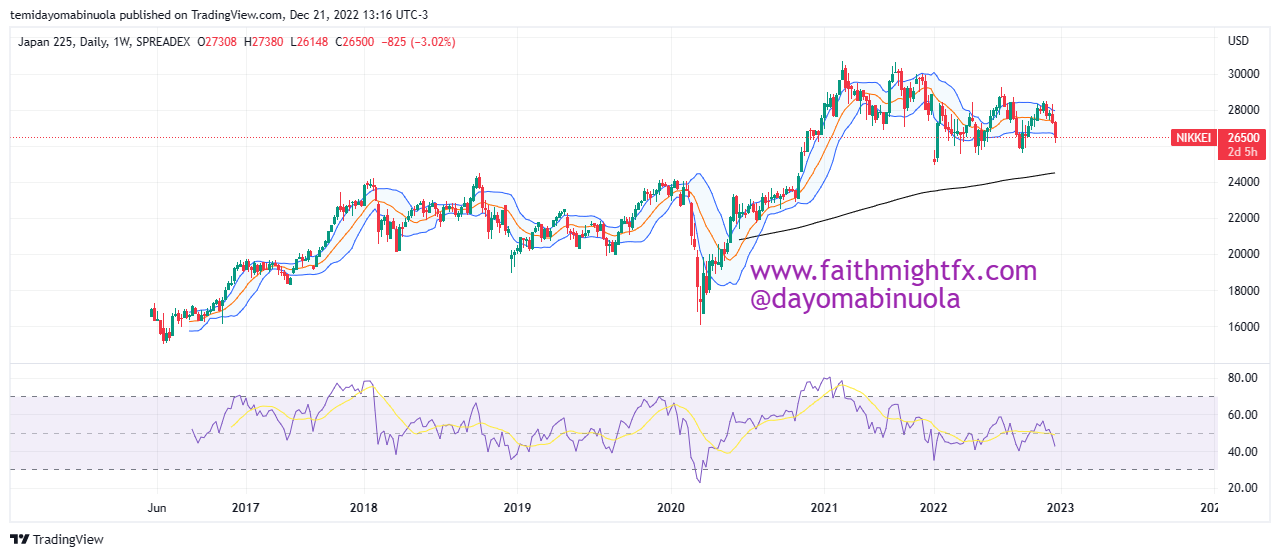
4. NIKKEI 225: The Nikkei 225 is the stock market index for the Tokyo Stock Exchange. The Nikkei measures the performance of 225 large and publicly owned companies in Japan from a wide array of industry sectors. The Nikkei 225 shows that it could reach a new all-time high in 2023. 2023 might just be a year to recover losses incurred in 2022 as a result of the activities of the bears.
Nikkie 225
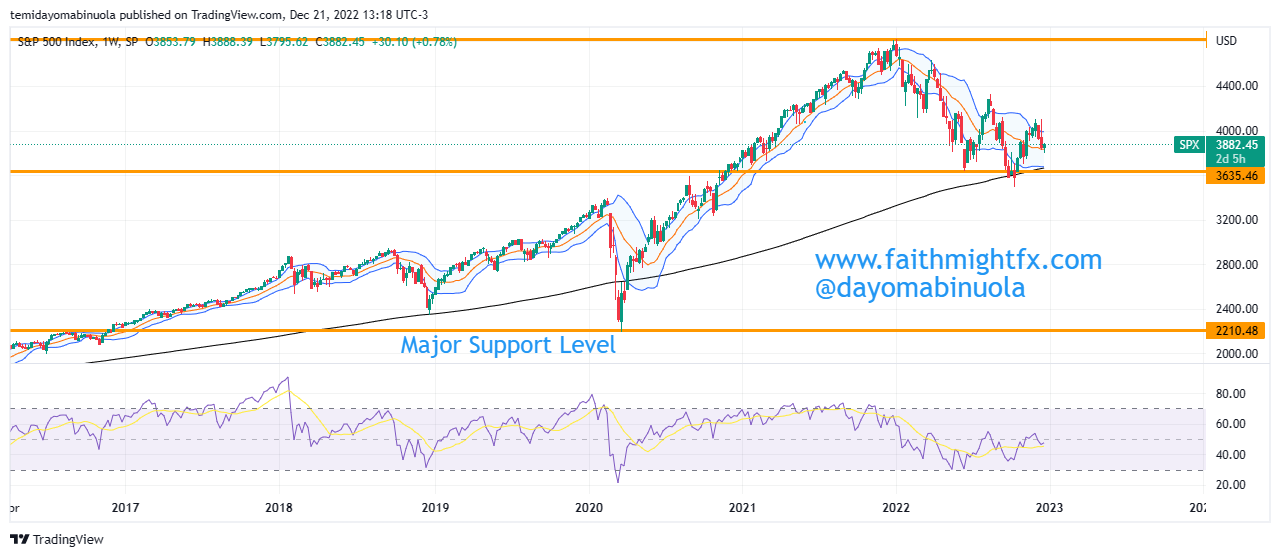
5. S&P 500: The S&P 500 is a stock market index tracking the performance of 500 large companies listed on the stock exchanges in the United States. The year 2021 ended as the SPX reached an all-time high at 4822. The year 2022 was not a good year for the SPX investors. The year 2023 could be a year of recovery and SPX could reach a new all-time high.
SPX
Some of these ideas are in our clients’ portfolios. To understand if this one can work for you or for help to invest your own wealth, talk to our advisors at FM Capital Group. Would you like more information on how to get stock indices your portfolio? Schedule a meeting with us here
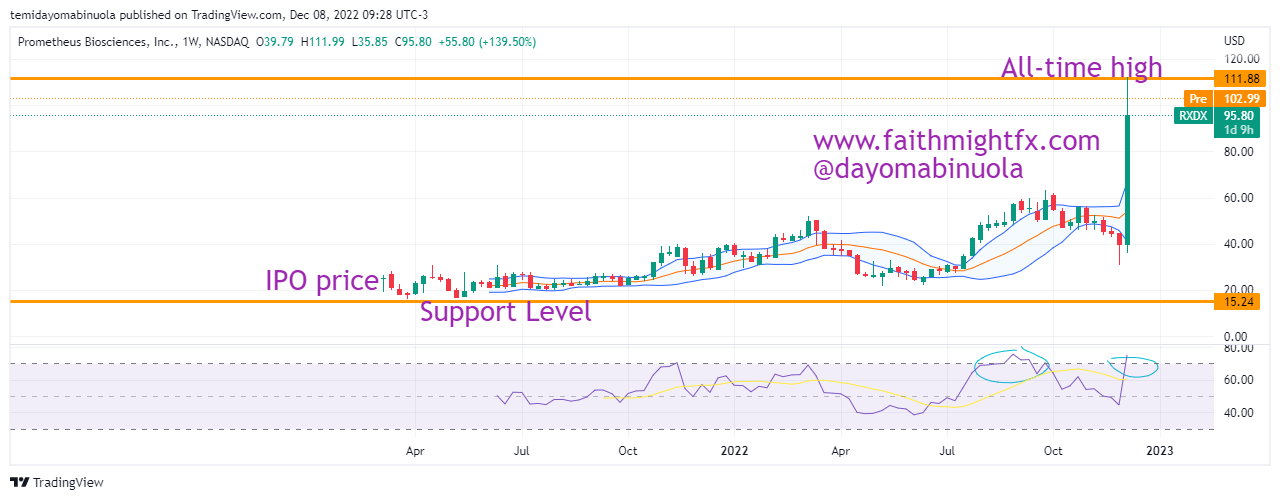
Prometheus Biosciences is an innovative biotech firm aiming to develop novel therapeutic and companion diagnostic product candidates for the treatment of immune-mediated diseases.
Prometheus ($RXDX on NASDAQ) had its IPO on March 12, 2021, at $25 per share. $RXDX has a market cap of $2.01Billion and generates $3.13Million in revenue annually. On Wednesday, the 7th of December, the company released a result of treatment in the development for ulcerative colitis (UC) and Crohn’s disease (CD). The result from this study showed it was effective as a treatment and safe for use.
Weekly Chart
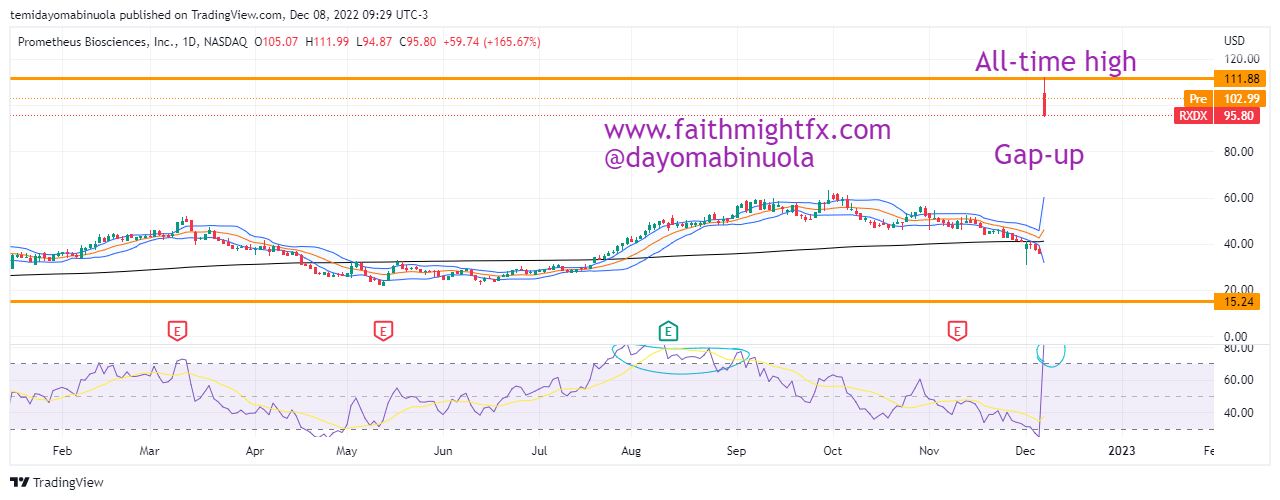
On the 6th of December, $RXDX closed at $35.32 per share. By the opening of the following trading day, there was a gap up as a result of the release of the aforementioned report. This gap up made price open at $105.20 which was over 200% appreciation of the stock as of the time price opened on the 7th of December.
Daily Chart
That same day, price kept rallying to about $112 before it reversed. At the end of the trading day, price closed at $95.80. We might be seeing a price fall to $64 in the coming weeks. In September, RSI indicated price was overbought on the weekly time frame. Right now, RSI is also indicating on the weekly time frame that price is overbought due to this recent rally.
Some of these ideas are in our clients’ portfolios. To understand if this one can work for you or for help to invest your own wealth, talk to our advisors at FM Capital Group. Would you like more information on how to get stocks in your portfolio? Schedule a meeting with us here
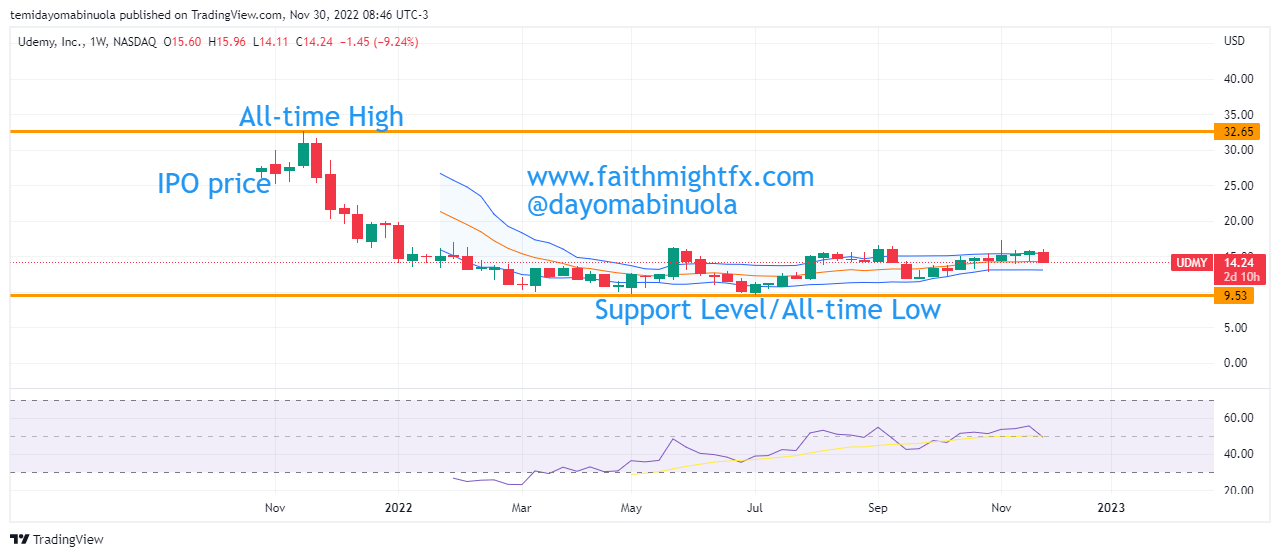
Udemy is a massive American open online course provider. It was founded in 2010 and by April 2021, the platform had recorded more than 40million students, 155,000 courses and 70,000 instructors in over 65 languages. As of 2022, Udemy has over 52milion users. Between 2011 and 2020, Udemy made some series of fund raising. The last funding before the IPO in 2021 was for $50million at $3.2billion valuation led by Tencent Holdings.
Weekly Chart
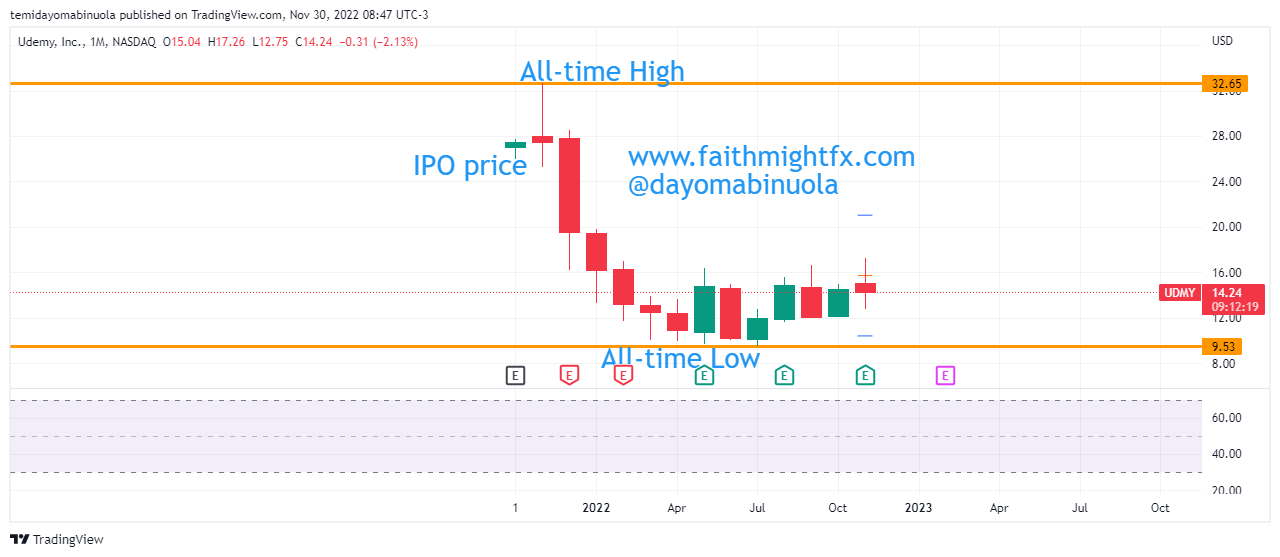
On October 29, 2021, Udemy held their IPO with a price of $27 per share. Price of $UDMY rallied only for a few weeks from its IPO to reach an all-time high at $32.68 on the 19th of November 2021. The next trading day after the all-time high was reached, the bears took full control and price began to dip and closed below the IPO price even before the end of November 2021.
Monthly Chart
The opening price of this year was at $19.51. as price, it has also been a year of low volatility, though the first four months closed bearish. The price of $UDMY in 2022 has been between $19.84 in January, which is the highest price level in the year and $9.47 in July, which also stands as the all-time low. Udemy share price right now is at $14.24 and we might be seeing a price fall to $11.79 in the coming weeks.
Some of these ideas are in our clients’ portfolios. To understand if this one can work for you or for help to invest your own wealth, talk to our advisors at FM Capital Group. Would you like more information on how to get stocks in your portfolio? Schedule a meeting with us here
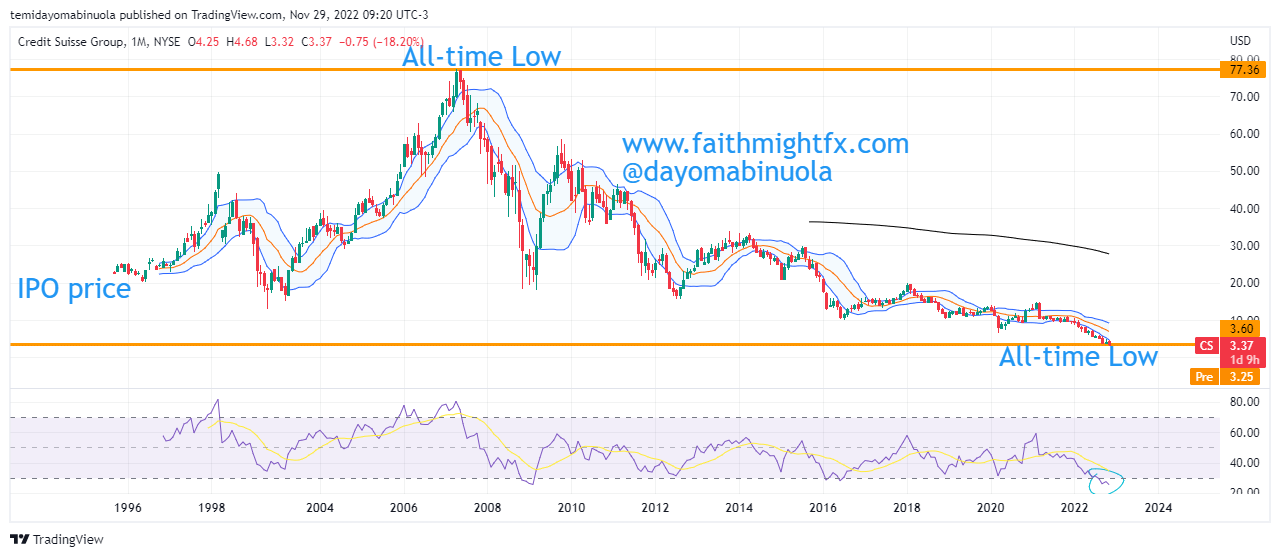
Founded in 1856, Credit Suisse Group AG, Credit Suisse for shorts, is a global investment and financial services firm based in Switzerland. It is not only listed locally on the Swiss Stock Exchange, and it is also listed on the London Stock Exchange and New York Stock Exchange.
Monthly Chart
In September 1995, Credit Suisse Group AG got listed on NYSE at an IPO price of $22.93. Since the IPO, Credit Suisse bulls have been able to push price to an all-time high at $77.38 in April 2007. Since this all-time high, the bears have steadily gained control of the price movement as price dipped to $17.94 i.e. below IPO, in March 2009.
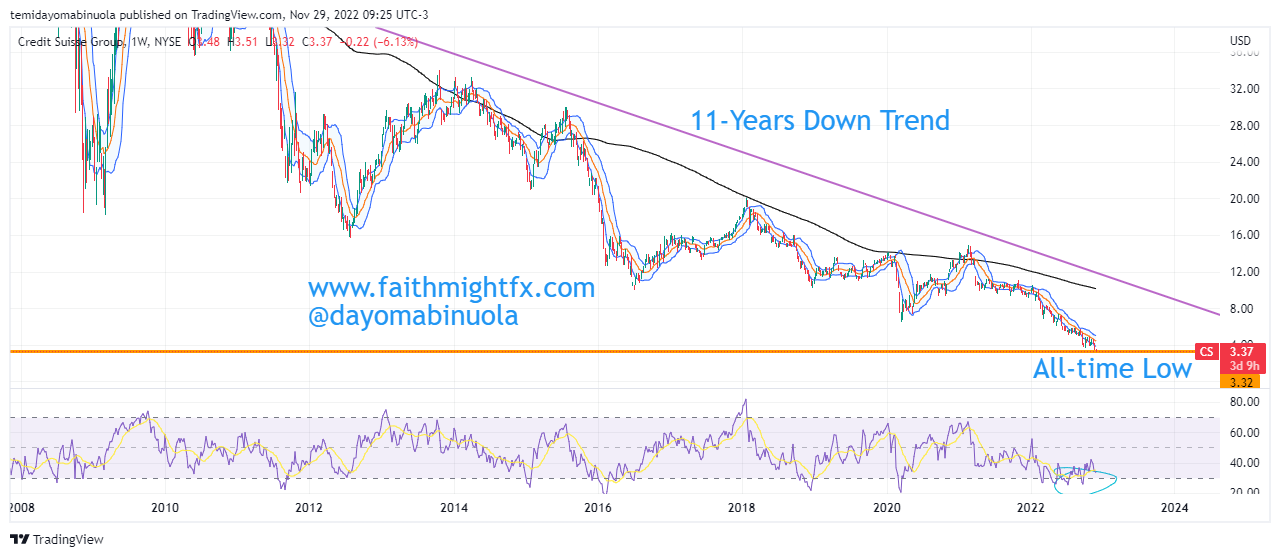
Weekly Chart
From March 2009, there was a rally to October of that same year that took price to $58.69. However, since then, Credit Suisse has nosedived as share price hit a record low of $3.37 yesterday, November 28, 2022. According to Bloomberg, this is the investment bank’s worst bearish run ever. According to our analysts, Credit Suisse share price is expected to bounce from this point to $6 soon.
Some of these ideas are in our clients’ portfolios. To understand if this one can work for you or for help to invest your own wealth, talk to our advisors at FM Capital Group. Would you like more information on how to get stocks in your portfolio? Schedule a meeting with us here
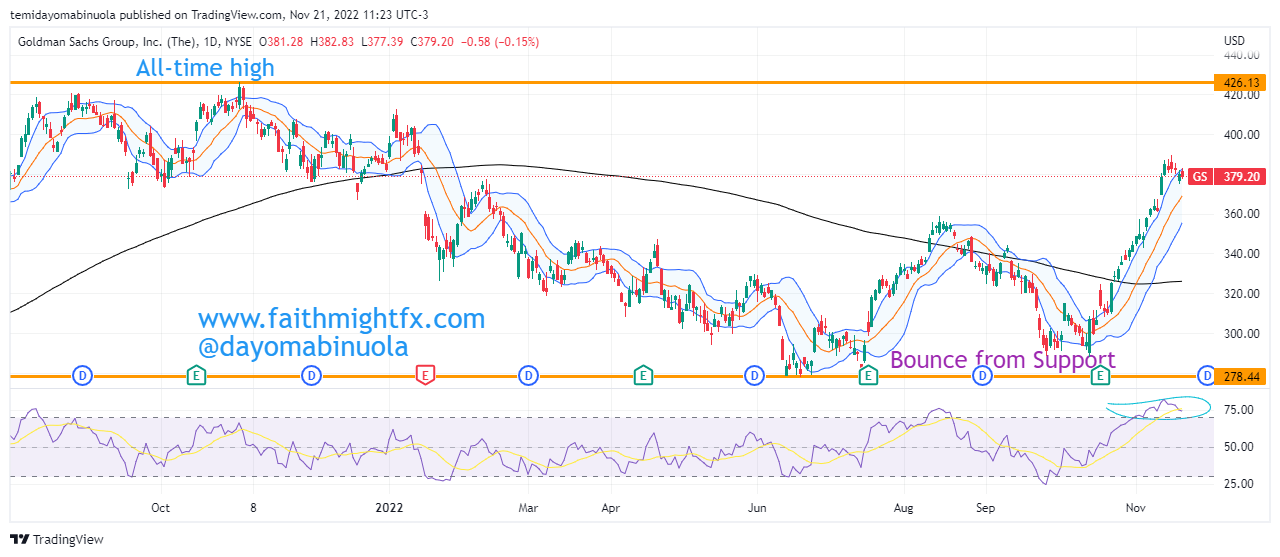
On the first trading day of the year 2022, Goldman Sachs share price opened at $387.10. The bulls only enjoyed a few days of rally as price reached the year’s high at $413.33. This mark was hit on the 5th of January which was the third trading day of the year.
Daily Chart
Following this rally that took price to the year’s high, the bears have been in control of the price movement causing a dip in price. This dip has seen Goldman Sachs’ price sink to hit the year’s low at $278.19 in July 2022. The last time price went this low was in January 2021. It is worthy of note that Goldman Sachs hit its all-time high in the same year 2021 at $426.50.
In the second half of this year, the bulls have become more active. There was a bounce from the year’s low to $359.50 in August 2022, which was also the initial resistance for the second half of 2022. When this resistance was hit, there was a correction on the weekly chart which caused price to fall below $300 for the second time in the year.
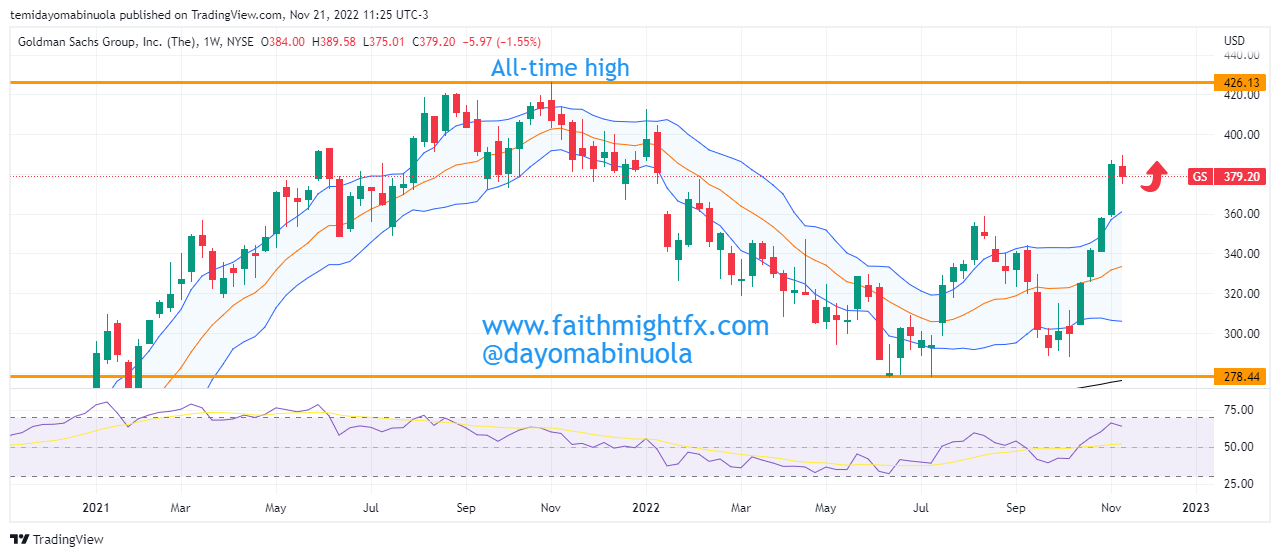
Weekly Chart
In October 2022, the bulls regained control of the price movement sending Goldman Sachs’ share price on a 6-week jolly ride upward. Price is currently at $379.14, which is the resistance level on the weekly chart. Although, RSI indicates price is overbought on the daily chart, it does not indicate that it is overbought on the weekly chart. Our analysts believe that this rally is strong enough to take Goldman Sachs’ share price to a new all-time high.
Some of these ideas are in our clients’ portfolios. To understand if this one can work for you or for help to invest your own wealth, talk to our advisors at FM Capital Group. Would you like more information on how to get stocks in your portfolio? Schedule a meeting with us here
Robinhood Markets, Inc. is an American financial services company, with her headquarters in California. It’s a FINRA-regulated broker-dealer, registered with the U.S. Securities and Exchange Commission. As of March 2022, Robinhood had 22.8million funded accounts and 15.9million monthly active users. In April 2022, Robinhood introduced a cryptocurrency wallet to more than 2 million users.
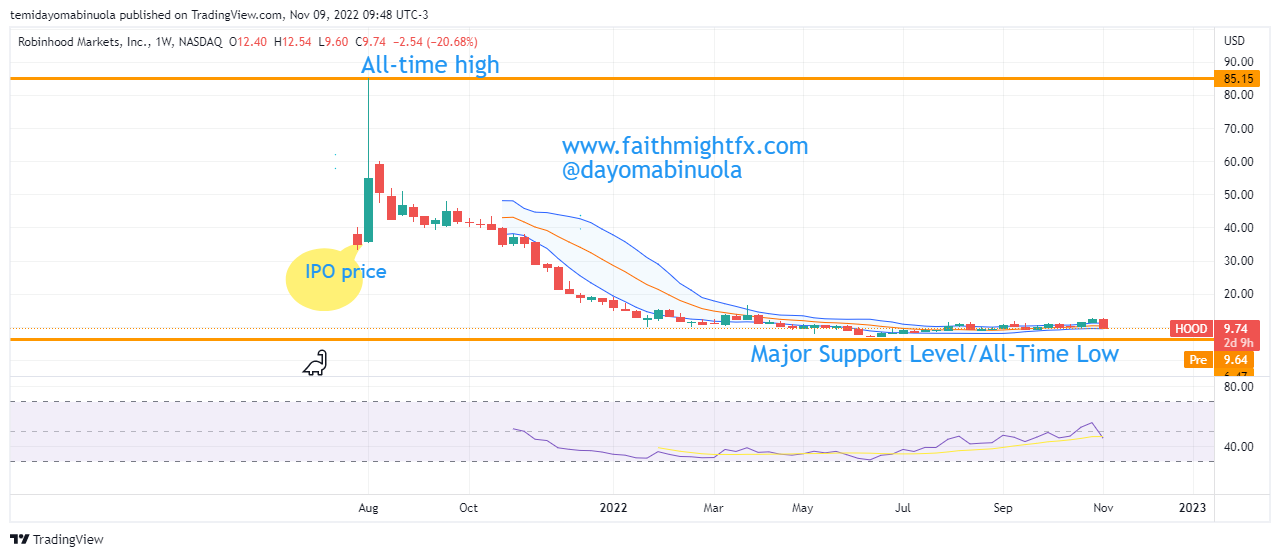
Weekly Chart
Most Robinhood investors would be in losses, except for those investors with new entries from June 2022. Robinhood had its IPO at $37.87 in July 29, 2021. The stock rallied for just few days, as price eventually reached an all-time high at $85.15 on the 4th of July, 2022. Since its IPO, only the first five trading days were in favor of the $HOOD bulls. Since November 17, 2021, Robinhood has been trading below the IPO price at $37.87.
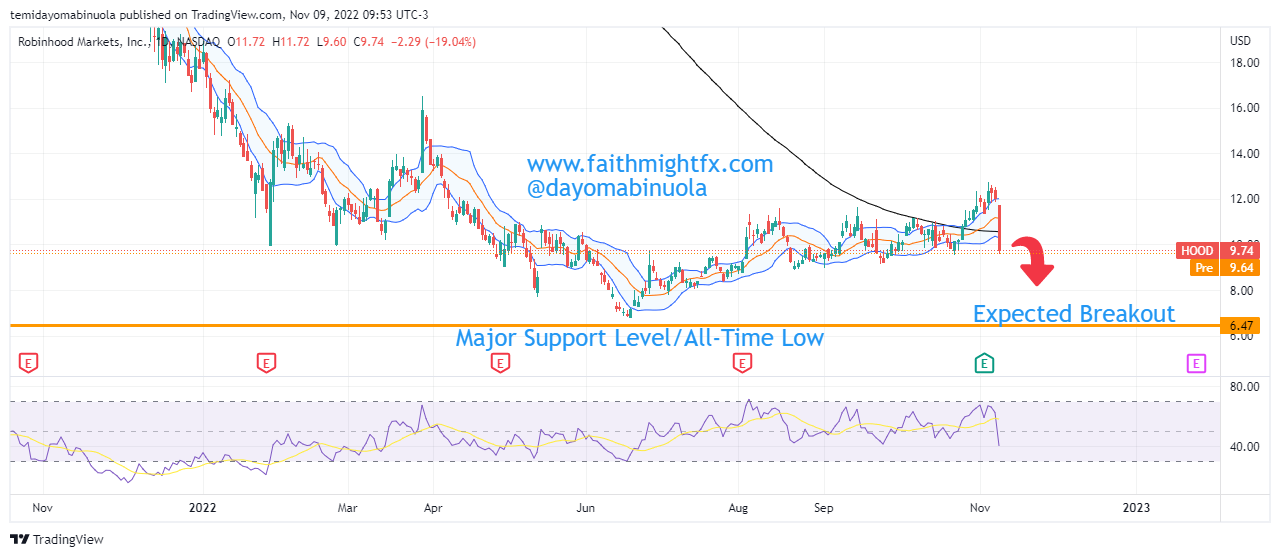
Daily Chart
2022 has been a bearish year for $HOOD investors. The current price of $HOOD shares is at $9.74. The all-time low for Robinhood is at $6.71, which was hit in June 2022. Recently, the crypto industry witnessed another crash. We might be seeing another drop in the price of $HOOD, which could eventually make the price reach a new all-time low below $6.71. We might be seeing price reach $6 or $5 per share.
Some of these ideas are in our clients’ portfolios. To understand if this one can work for you or for help to invest your own wealth, talk to our advisors at FM Capital Group. Would you like more information on how to get stocks in your portfolio? Schedule a meeting with
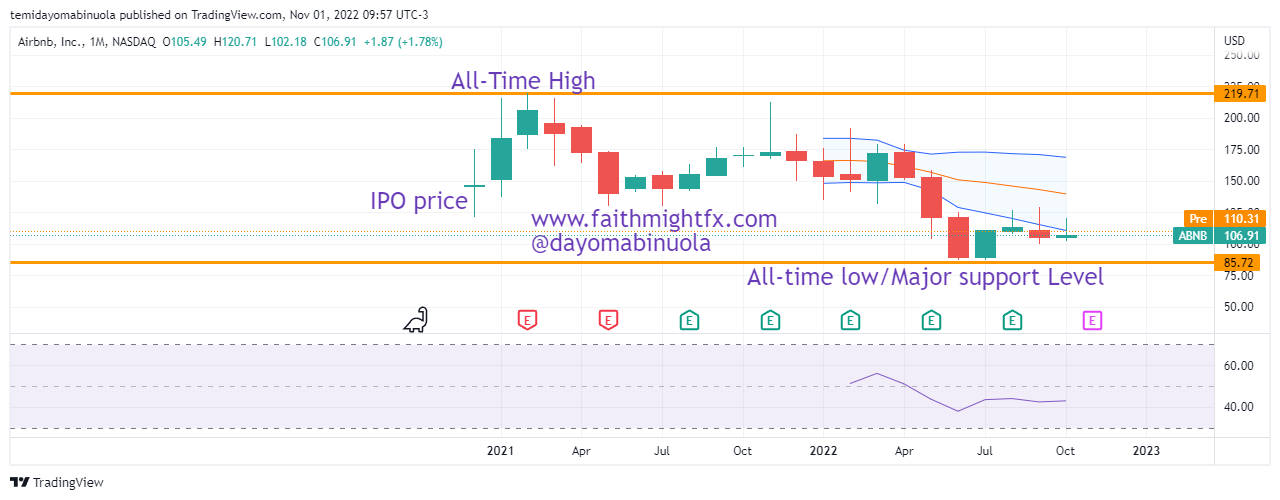
AirBnB had its IPO in December 2020 at $145 per share. This IPO was done a few months after the ease of lockdown globally. Price rallied to $219, an all-time high, on February 11 2021. The rally was short-lived as price fell to $129.49 in May 2022, which was below the IPO price. There is a report that indicates that travel around the world is starting to slow because of high energy prices, and consumers are having a second thought before going on vacation. The housing market is currently in turmoil, which could spill over to the AirBnB market.
Monthly Chart
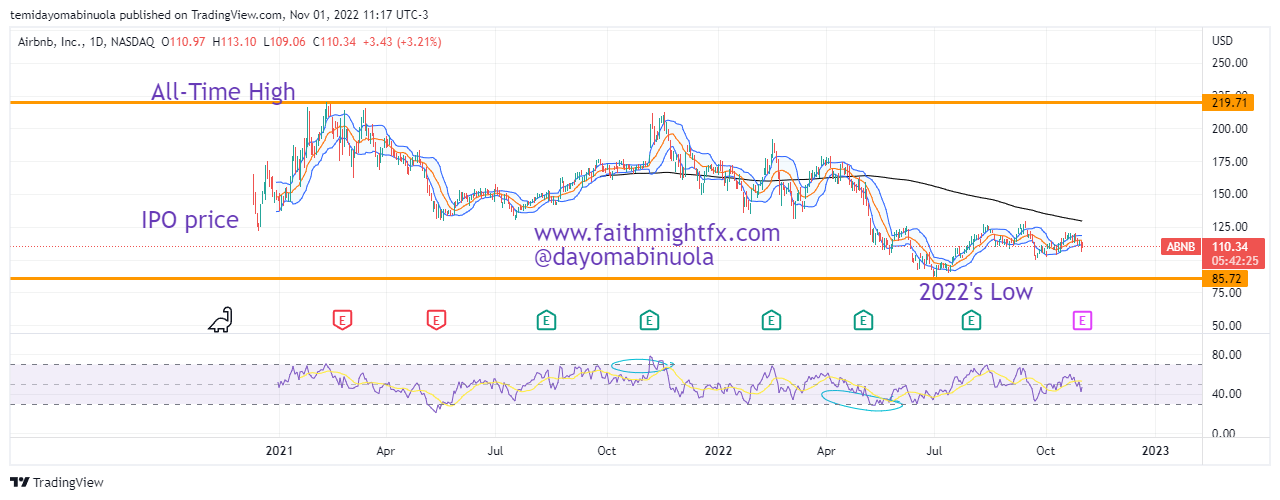
Since the beginning of the year, AirBnB has been down by 32.46%. As a result of the fall, price crossed the $100 psychological level for the first time as it hit $85 in July 2022. Price is consolidating on the weekly chart, as the price of $ABNB is currently at $110.30. A rally to $196 might occur in the coming months.
Daily Chart
Some of these ideas are in our clients’ portfolios. To understand if this one can work for you or for help to invest your own wealth, talk to our advisors at FM Capital Group. Would you like more information on how to get stocks in your portfolio? Schedule a meeting with us here
Carnival corporation &plc is a British-American cruise operator with a combined fleet of over 100 vessels across 10 cruise line brands. Carnival corporation had its IPO in July 1987 at $3.94 per share. Carnival corporation is listed on NYSE and LSE. As of this year, the total staff of Carnival corporation stands at 150,000.
Daily Chart
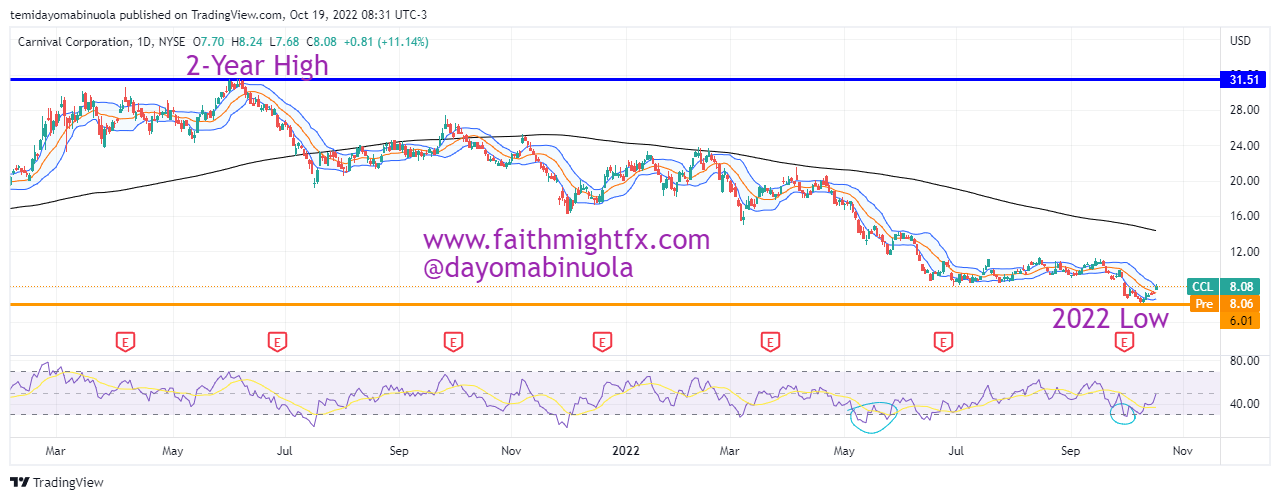
Carnival corporation & plc announces offering of $1.25 Billion for refinancing to be issued by Carnival Holdings in Bermuda. This news could have been the reason for an uprise in the price of Carnival yesterday, with 11.14% appreciation in price.
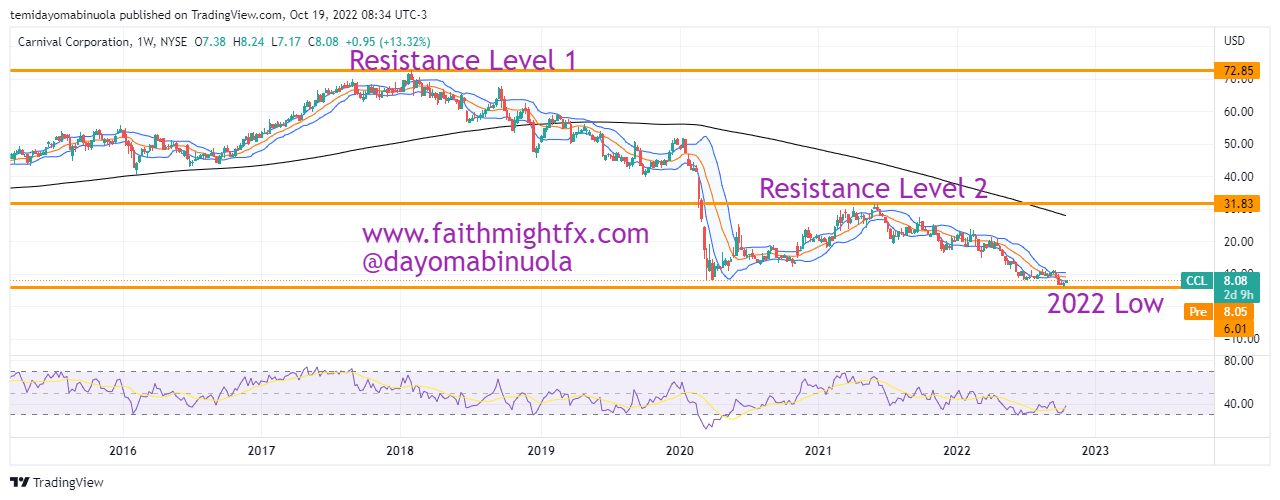
Weekly Chart
Over the years as price rallied, $CCL reach an all-time high in January 2018 at $72.85 and fell to $8.08 as a result of the 2020 pandemic. Post-Lockdown, a rally to $31.83 occurred in 2021, which currently stands as a a two-year high. Before the 11.14% rally yesterday, the price of $CCL fell to $5.89, which makes it the lowest price since 1991. We might be seeing a rally to $11 in the coming weeks from its current price at $8.08.
Some of these ideas are in our clients’ portfolios. To understand if this one can work for you or for help to invest your own wealth, talk to our advisors at FM Capital Group. Would you like more information on how to get stocks in your portfolio? Schedule a meeting with us here