fbpx

Author: @dayomabinuola

  • Bank Of America Gaining Strength After A Fall In Market Price

    The market value of $BAC worsened in September reaching 25.99 from 30.12. Price rallied majorly between 29.41 and 31.99 throughout this year. $BAC has maintained stability in market price for the most part of 2018. After a fall in price in September, price reached a new low since mid-November 2017. Price movement this year reached 33.05 in March making it the highest price point of $BAC reached since the financial crisis in 2008. Investors might have been undergoing discomfort during the times the market was in a range. In July, price gave a signal of a future downtrend which later occurred in September with over 400 points.


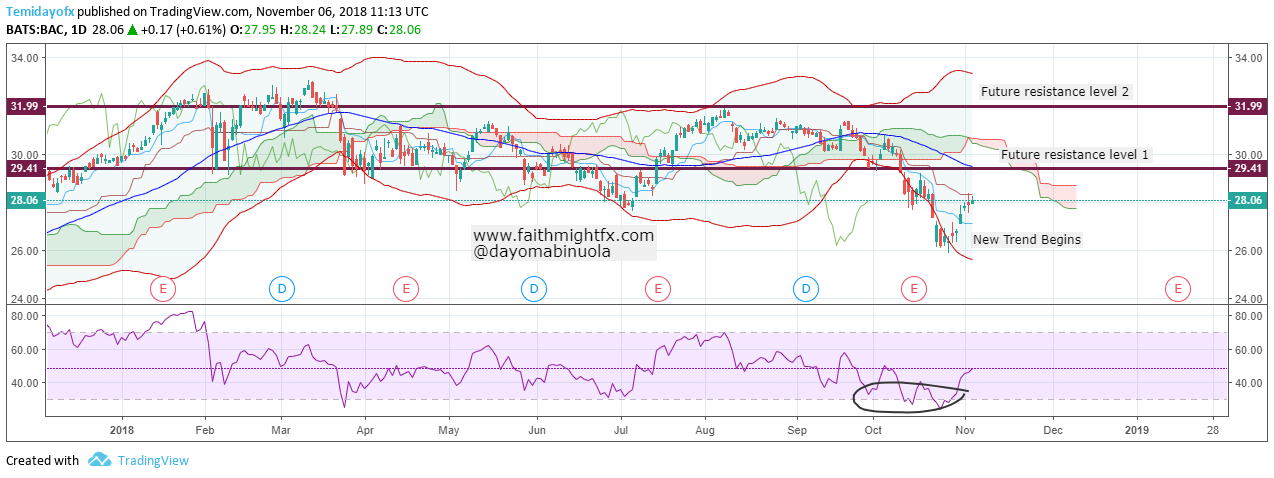
    More investors bought shares of $BofA after a new support level was reached in October. Over 100 points was gathered last week when buyers resumed. The RSI on the daily chart shows price has been oversold. If more buyers come on board, price might reach a new resistance at 29.41. Eventually, if price goes up and moves beyond the first resistance level, price might reach 31.00. Though price movement is in the lower region of the band, it could continue higher if price closes above the upper region of the band, it could continue the bullish movement.

  • JP Morgan Chase Holds Still Support

    The price of $JPM found solace around 102.90 level at support and 119.21 level at resistance in 2018. This is a price movement of about 1800 points. That is a whole lot of profits for long term traders. However, the price movement of $JPM in the first half of the year was not good for bulls until July.

    $JPM DAILY CHART

    A breakout has occurred from the trendlines. This could be an indication for a bullish movement. Price is presently at 109.25 level and might reach 112.75. The RSI never fails in showing us when it is oversold so it may signal another buy in $JPM shares. Price movement to the upper part of the Bollinger bands may show a continuation in upward trend. Ichimoku gives no trace yet for a reversal in price of $JPM. A breakout of price occurred also from the resistance level. Price may move as high as 119.21, which is a major resistance level for this year.

  • Nikkei About To Begin A Bullish Trend

    October was not too good for Nikkei. The stocks began a downtrend moving over 3000 points. That’s a big loss for the stocks in $NKY. The highest level $NKY reached in 2018 was at 24372. This level was reached in the early days of October where RSI showed us an overbought region. This gave rise to a reversal. For the most part, the $NKY, in 2018, is dominated by sideways movement on the daily time frame. Having been oversold from the downtrend in the latter days of October, price was at 21067 level. The last time price got to 21067 was in March 2018.

    The Senkou Span from Ichimoku shows a downtrend future, but has yet to show a reversal signal. RSI shows an oversold region at 21067. Price of $NKY already touched the lower Bollinger band line thereby leading to a bounce upward. Using the price movement on the trendlines, price already broke out, which indicates a bullish trend is about to begin. This bullish movement might touch the middle line of the band which is at level 22821. From now, price of $NKY might generate over 1000 points from 21700 to 22821.

  • FTSE 100 Awaiting A Breakout Confirmation

    The movement of $FTSE 100 has been between 7900 and 6900 this year. During this time, $FTSE 100 reached an all- time high in May at 7900. Several stocks in the US this year reached an all-time high. In the first quarter of the year, more sellers traded $FTSE 100. Towards the end of the first quarter, a breakout occurred which made price remain bullish till June. After this, a long-term range began. Later in August, a breakout downward occurred on the daily chart. Price reached 7290 and bounced upwards to touch the middle Bollinger bands line. Price went further down and broke out the support level, forming a new support level at 6924.

    FTSE CHART

    Recently, RSI showed oversold when price reached that new support level at 6924. Since August, when price of $FTSE 100 comfortably closed below in the lower section of the Bollinger bands, price never closed in the upper band. An expectation of about 200 pips upward might be realised on $FTSE 100 trades soon. Indications from the trendlines show a breakout already occurred while price remains in a range. The future resistance level is expected at 7277. Ichimoku has not shown a trace of a reversal but the bull gangs might push the price of $FTSE 100 upwards.

  • Overbought Positions, Yet USDJPY Price Remains Bullish

    A major Bullish trend began in March 2018. About 800 pips have moved in favour of the USD pushing the $USDJY higher. The USD remains quite strong in 2018. There has been a major break in the uptrend in May, price only moved downwards from 111.149 to 108.412 before the uptrend continued to new highs at 114.488.

    Price action disobeyed the rules of RSI: price has shown overbought positions three times between May and October, and each time the upward movement continued. Could this be the monetary policies made this year, that has favoured the USD? Price is around 112.631 hoping to touch 114.30, which is on the upper band line. Price might begin a downtrend soon but it may touch the upper Bollinger band line before a trace of downtrend. Ichimoku on the daily chart shows no trace of downtrend. We might be expecting 200 pips movement upward.

  • AUDUSD To Gain More Pips Despite A Long Term Downtrend

    It has been a long term downtrend for the $AUDUSD since the beginning of the year. The downtrend is characterized with several lower highs and lower lows. In the last two months, the upward and downward movement of $AUDUSD have been between 300 pips. Price movement tends downwards maintaining the lower part of the Bollinger bands. The USD without argument this year has gained so much against the AUD.

    The RSI has not touched the overbought position since January. Since then, price keeps moving downward without ever reaching the overbought or oversold regions. A breakout occurred off the trendlines and price is yet to touch the Bollinger band middle line. It is about 200 pips reaching this point. The future of Ichimoku shows a long downtrend and no trace of a reversal. The last time $AUDUSD maintained a bullish trend was between December 2017 and January 2018. Ever since a reversal occurred, price of $AUDUSD has been on a downtrend.

  • Hewlett Packard Might Gain Momentum Despite Trade Wars

    This year has been a smooth year for $HPQ holding on to a bullish trend until the first week of this month when a sharp bearish movement started. This price movement touched the resistance level and couldn’t stay above it. Price retraced itself downwards touching the middle band line, further breaking the line until price touched the lower band line. Over one week, the price of $HPQ has been in a range hoping for a breakout. $HPQ has decided to boost their presence in the printing market through innovations which could drive the share price higher.

    RSI undoubtedly was overbought before the bearish movement. Now it has shown an oversold position again preparing for a bullish movement. Price is at level 23.33 and could move higher to 26.30, still maintaining the resistance level. The all-time high price in $HPQ is at the highest resistance level. Price first touched this point in July 2000.

    Source: HP Upgrades Sprocket To Boost Presence In Printing Market (NASDAQ)

  • Price Obeys USDCAD Bullish Movement At Resistance

    The $USDCAD direction has an upward zigzag movement throughout this year. Price has been retesting on the resistance level several times this year. For the most part of 2018, price has been bullish. The USD obviously has been taming the strength of the CAD for some time. The highest price movement of $USDCAD this year has been at level 1.33419. The last time price touched this point was in June 2017. A bearish signal shows through the breakout in the trendlines, which tend to move downwards.

    The Bollinger bands still holds price in the upper region of the bands. A reversal might happen anytime soon, which will make the CAD to gain more leading to a new trend downwards. Since RSI shows no trace of price being overbought, price has been able to touch the upper part of the band before touching the middle band line. Since a breakout occurred from the trendlines, price is meant to touch the lower band line in the coming weeks. As I expect bearish movement to start, this is dependent on sellers of the $USDCAD currency pair. The price of $USDCAD might reach 1.2840.

    Given that price is still 500 pips away from there, this breakout to the downside could also be a fakeout.

  • Microsoft Price Couldn’t Break The Support Level

    The unfortunate death of Paul Allen prompts a look at $MSFT. Allen’s $MSFT has enjoyed a smooth ride on a bullish flow this year reaching an all-time high in the stock market. The bullish movement brought about multiple higher lows in price movement. Companies like Apple and Amazon have had a good year so far for long-term investors. Price of $MSFT has reached overbought positions twice this year on the weekly chart. Instead of a change of trend downwards, price continued higher to the 116.00 level before a downward trend began. This move couldn’t break the support level. Price rallied off the support level.

    A bullish breakout occurred from the trendlines, which might be a good opportunity to buy $MSFT. RSI has not showed an oversold position on the weekly chart. Ever since price broke out the 105.12 level, price has never gone below this level. The future of Ichimoku also shows a bullish future. The bullish trend is expected to continue.

    Source: Microsoft Co-Founder Paul Allen Dies of Cancer At Age 65(CNBC)

  • Price Of Gold May Rise

    The price of Gold went down mid-April after several lower highs. Price was able to break the support level in August that resulted in a range in price. A look on the RSI indicates an oversold position since August which implies an upward movement of $XAU price. The last time price went this low to 1175.00 was in December 2016. Price of $XAU still maintains the lower section of the band despite indicators showing a reversal higher. Three weeks ago, price began an upward movement up until now.

    The trendlines A and B have a breakout higher at level 1190.2. Price of $XAU is expected to touch the resistance level at 1280.71. This should occur in the coming weeks. The $XAU price movement was able to reach a ten-week high this week. A breakout of the resistance level could bring about a continuation higher in $XAU for a while longer. Investments in $XAU at this point could be a profiting one for buyers.