Category: Commentary

  • Gold’s Price Heading To 2022 Support Level

    Gold’s Price Heading To 2022 Support Level

    Globally, the prices of commodities have dipped this year. At the beginning of the year, the price of Gold was at $1829 per ounce. There was a rally in the first quarter of the year, which made price reach $2071 per ounce. Since the year’s high was reached, it has continued to fall. We wrote an article in July 19, when price of Gold was at $1711. Our analysts on this day said price could fall below the then support level of $1676. The price of Gold today stands at $1632.

    Daily Chart

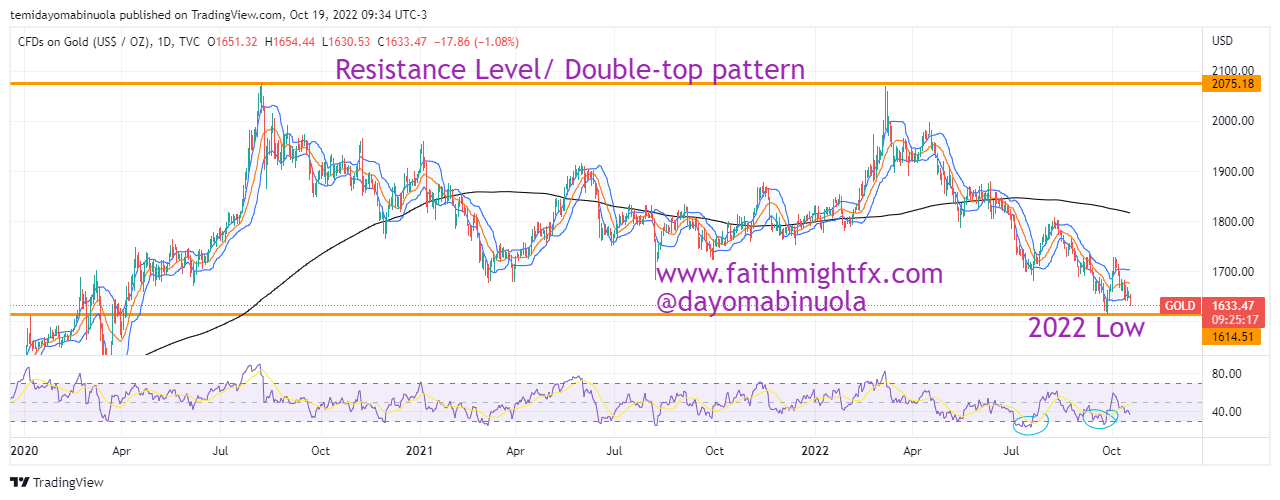
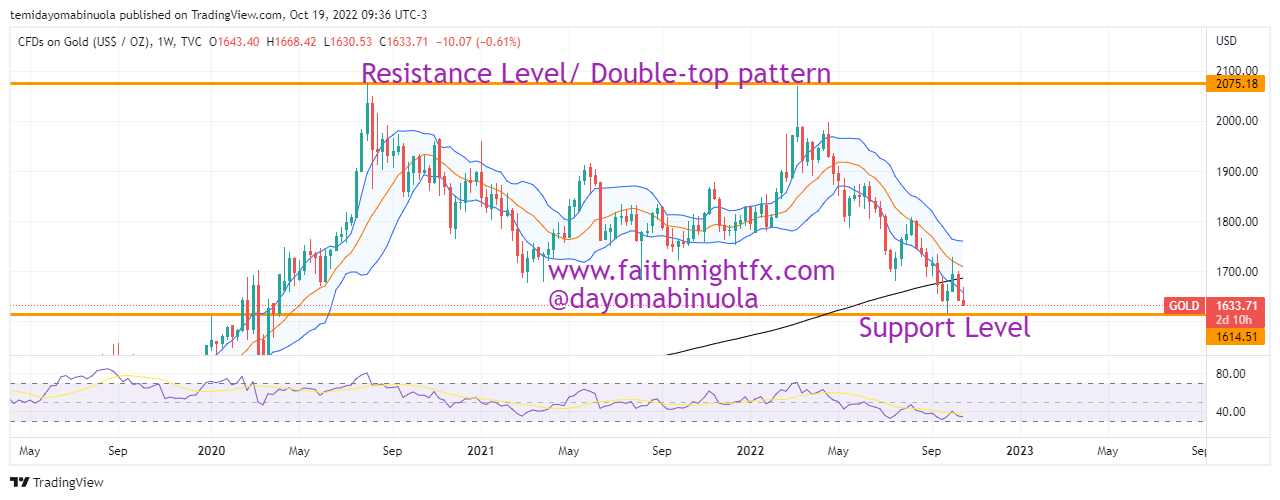
    Just like the cryptocurrency market is down in this year, the gold market is also down. We might be seeing a new 2022 low below $1616, which is the current year’s low. On the weekly chart, there is a double-top pattern, which must have led to price fall. Despite RSI shows price has been oversold twice on the daily chart, price could still fall further.

    Weekly Chart

    Some of these ideas are in our clients’ portfolios. To understand if this one can work for you or for help to invest your own wealth, talk to our advisors at FM Capital Group. Would you like more information on how to get commodities in your portfolio? Schedule a meeting with us here

  • Bulls Get Set for Coinbase

    Bulls Get Set for Coinbase

    Since Coinbase share price dipped from the all-time high at $430 which was reached in the month of its IPO, each time the bulls make efforts to rally the price, the bears counteract it. All monthly candlesticks since its IPO have closed below the IPO price.

    Daily Chart

    There was a bounce from the all-time low at $39.25 in May 2021. The current price of $COIN is at $66.21. The second half of the year has been characterized by a range. Price has been ranging between $46 and $116.72, with $116.72 being the current resistance level on the monthly time frame. We might be seeing price reach $100 before the end of the year as Google sets to partner with Coinbase.

    Weekly Chart

    Some of these ideas are in our clients’ portfolios. To understand if this one can work for you or for help to invest your own wealth, talk to our advisors at FM Capital Group. Would you like more information on how to get crypto-curencies in your portfolio? Schedule a meeting with us here

  • Archaea Energy Gains Over 50% In One Day

    Archaea Energy Gains Over 50% In One Day

    Archaea Energy is one of the largest renewable natural gas producers in the United States with an industry leading RNG platform and expertise in developing, constructing and operating RNG facilities to capture waste emissions and convert them into low-carbon fuel. 

    Monthly Chart

    Archaea Energy had its IPO in December 2020 at $11.50 per share. The first four months of its IPO closed bearish until the bulls took over at the beginning of the second quarter in 2021 as price reached a new high in June 2021 at $18.61. The highest point Archaea’s share price reached in 2021 was $21.95 and the closing price for the year was $18.28.

    The first four months of 2022 was majorly bullish as Archaea Energy attained a new high at $23.75 in April 2022. The following month was followed by a bearish turn which resulted in price reaching a current year’s low at $12.62 in June 2022. A rally then commenced from the year’s low to an all-time high of $26.12 on October 17, 2022 which was as a result of a gap up.

    Weekly Chart

    This gap up is the result of a recent announcement by British Petroleum of its plans to expand into bioenergy by acquiring Archaea Energy for approximately $4.1Billion. The gap up led to a 54.15% appreciation in Archaea Energy’s share price which is the highest rally in a single day since its IPO. As a result of the rally, RSI is currently overbought on the daily chart which might lead to a correction in price and this correction might reach $24.

    Some of these ideas are in our clients’ portfolios. To understand if this one can work for you or for help to invest your own wealth, talk to our advisors at FM Capital Group. Would you like more information on how to get stocks in your portfolio? Schedule a meeting with us here

  • Cloudflare Stock Appreciates By 13%

    Cloudflare Stock Appreciates By 13%

    Since the crash of Cloudflare’s share price from the all-time high at $221.53 in November 2021, the price has failed to rally. Each time it attempts a rally, it is counteracted by a more aggressive bearish force. 

    Daily Chart

    All Cloudflare investors since January 2021 are currently at a loss. The current price of Cloudflare’s share is $51.72 while the current low for the year 2022 is at $40.03. Despite the crash in price, Cloudflare is still trading above its IPO which is $18.

    Monthly Chart

    On October 17, 2022, Cloudflare’s share price saw a 13% gain. Despite this recent rally, the bears might push price to a new year’s low.

    Some of these ideas are in our clients’ portfolios. To understand if this one can work for you or for help to invest your own wealth, talk to our advisors at FM Capital Group. Would you like more information on how to get stocks in your portfolio? Schedule a meeting with us here

  • USDJPY Reaches New High Since 1990

    USDJPY Reaches New High Since 1990

    Analysing the monthly chart of USDJPY between the years 1999 and 2016, an inverted head and shoulders was formed which could have been the determinant for the rally of the pair that began in January 2011. The all-time low of the USDJPY was reached in October 2011 at 75.513. Only six candlesticks on the monthly chart have closed bearish since the rally began in January 2021.

    Monthly Chart

    The candlesticks in the last two months on the monthly charts have closed bullish. USDJPY’s opening price in October 2022 was 141.672. The bullish momentum that has gathered in the last two month has been able to push the pair to a high in this month at 148.887 which was last hit in August 1990.

    Weekly Chart

    We might be seeing a price correction to 145 as RSI shows price has been overbought on the weekly chart.

    Some of these ideas are in our clients’ portfolios. To understand if this one can work for you or for help to invest your own wealth, talk to our advisors at FM Capital Group. Would you like more information on how to get currencies in your portfolio? Schedule a meeting with us here

  • EURGBP To Lose Bull Pressure

    EURGBP To Lose Bull Pressure

    The first half resistance for the year was at 0.87265, which was in June 2022. There was a break-out to the upside in September has price rallied to 0.92758 in September 2022, which is this year’s high. After the rally to 0.92758 on the 26th of September 2022, the next trading day closed bearish which has led to more bearish close. The bulls tried to push price high to 0.88188 in October after a price fall to 0.86495.

    Monthly Chart

    The last 2 trading days have closed with a doji. The price might also close with a doji today, which could be an indication of price reversal to the downside. If the price falls, the support level at 0.86495 might be broken to the downside. The Daily Chart shows the RSI has been overbought, which the daily candlesticks indicate a possible price reversal in the coming days.

    Daily Chart

    Some of these ideas are in our clients’ portfolios. To understand if this one can work for you or for help to invest your own wealth, talk to our advisors at FM Capital Group. Would you like more information on how to get currencies in your portfolio? Schedule a meeting with us here

  • AMC Entertainment Holdings Loses 10% In 24 hours

    AMC Entertainment Holdings Loses 10% In 24 hours

    In December 2013, AMC had its IPO at $11.80. Since its IPO, it rallied to form a high at $22 in 2015. In 2016, it fell again to $11.93, a slump that plunged the price almost back to the IPO level. Towards the close of 2017, it rallied back to 2016’s high which completed a double top pattern. 

    Daily Chart

    The double top led to a price reversal in 2017 as price dipped to $1.23 in 2020 as a result of the global lockdown. There was a relief in 2021 as price rallied to an all-time high at $44.85 which was in June 2021. The following month, which was July, price reversed and a bearish turn began. Since July 2021 till date, AMC Entertainment stock has been falling.

    Monthly Chart

    In 2022, using the monthly chart, all candlesticks have been trading in the lower region of the Bollinger Bands. Since the all-time high in June 2021, RSI has indicated that price has been overbought. Our analysts forecast a rally to $10 in the coming weeks.

    Some of these ideas are in our clients’ portfolios. To understand if this one can work for you or for help to invest your own wealth, talk to our advisors at FM Capital Group. Would you like more information on how to get stock in your portfolio? Schedule a meeting with us here

  • Dow Jones Falls Below 30,000 For The Second Time In 2022

    Dow Jones Falls Below 30,000 For The Second Time In 2022

    The Dow Jones Index is a combination of 30 stocks that reflects the US economy and the stock market as a whole. Looking at the history of the Dow Jones when it was first launched in May 1896, which is over a century ago, the IPO price was at $29. In over one century it has been listed on the stock exchange, the $DJIA has appreciated to a ground-breaking $36,991, making it the all-time high. Since its IPO in the year 1896, $DJIA has appreciated over 1270% to reach the all-time high. The threshold was reached in January 2022.

    Monthly Chart

    The Stock Index has not been good for investments this year as it has been majorly bearish. In the first half of the year, in June to be precise, the price of $DJIA went as low as 29,698. The bulls made price rally above $34,000 in August 2022. The rally was countered with the bears’ activities, making the price fall to a new low in 2022 at $28,969. Since the all-time high, price has been overbought on the RSI using the monthly chart. The monthly candlesticks have since April 2022 been closing in the lower region of the Bollinger Bands. In the coming weeks, we might see price rally above $30,000 again.

    Daily Chart

    Some of these ideas are in our clients’ portfolios. To understand if this one can work for you or for help to invest your own wealth, talk to our advisors at FM Capital Group. Would you like more information on how to get stock indices in your portfolio? Schedule a meeting with us here

  • EURCHF Reaches All-Time Low

    EURCHF Reaches All-Time Low

    The opening price of $EURCHF this year was at 1.0376. Euro gained against the Swiss Franc for just a few weeks. This rally reached 1.06123, which is the current 2022 high. Most of the monthly candlesticks in 2022 have closed bearish, which shows the strength of the Swiss Franc.

    Daily Chart

    On the weekly chart between the year 2015 and 2021, a head and shoulders was formed, which led to the price fall from May 2021 to the current price below $1. The current price of $EURCHF is at 0.95485 after reaching the lowest price level at 0.94062. The Swiss Franc has been appreciating against the Euro since 1973. Each time a rally occurs, it is countered with an aggressive bearish take over. There are indications that price could rally in the coming weeks. The rally could push price to 1.02223.

    Weekly Chart

    Some of these ideas are in our clients’ portfolios. To understand if this one can work for you or for help to invest your own wealth, talk to our advisors at FM Capital Group. Would you like more information on how to get currencies in your portfolio? Schedule a meeting with us here

  • Microsoft Sees Worst Close Since May 2021

    Microsoft Sees Worst Close Since May 2021

    Microsoft investors have enjoyed bull runs for 13 years as the lowest price within that time frame was at $15.10. Despite the worldwide lockdowns and the negative impact on many stocks across the world, Microsoft’s share price didn’t see a major reversal. What the Microsoft share price saw, at worst, were corrections. 

    Monthly Chart

    In fact, during the lockdown, Microsoft saw a correction between February and March after which it began to rise. This rally continued up until November 2021 as price reached $350, which stands as the all-time high. After this all-time high was reached, the activities of the bears can be likened to those in 2008 as price is currently at $238. Also, since 2015 using the monthly time frame, this is the first time four candlesticks will be seen in the lower region of the Bollinger Bands.

    4hr Chart

    We might be seeing a rally to $250 per share in the next few weeks. The 4H timeframe at two different times in September shows that price has been oversold. This could be an indication for the next appreciation in price.

    Some of these ideas are in our clients’ portfolios. To understand if this one can work for you or for help to invest your own wealth, talk to our advisors at FM Capital Group. Would you like more information on how to get stocks in your portfolio? Schedule a meeting with us here