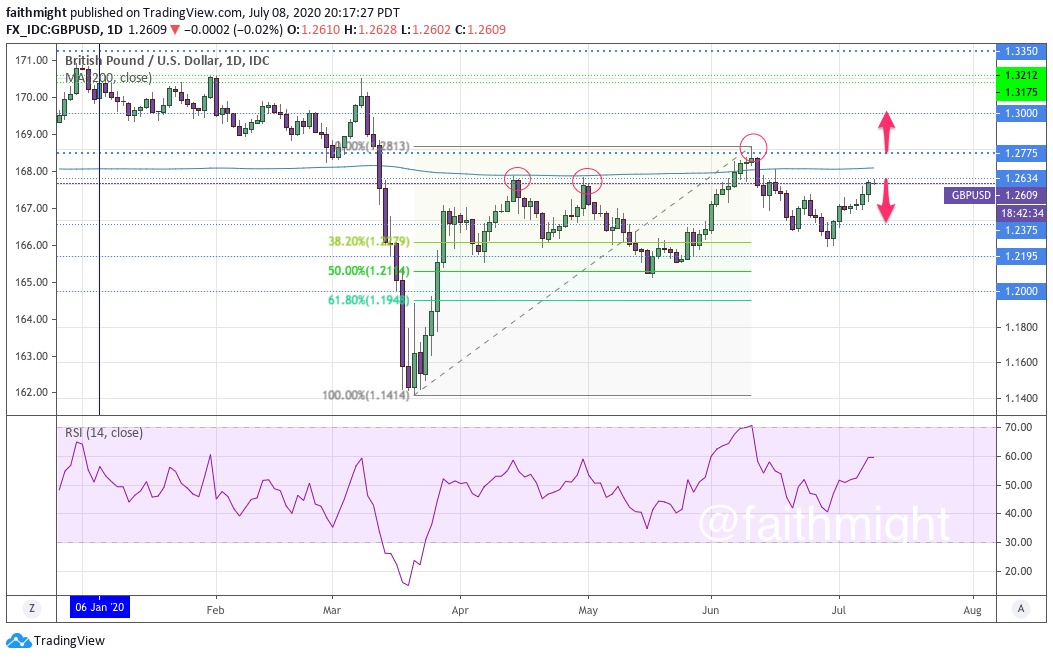
After some initial volatility to start the new trading week, the $GBPUSD has found support around the 50% Fibonacci level of the rally over the past 2 weeks. U.S. dollar weakness is starting to take hold as the market looks at all of the uncertainty brooding for the U.S. Between the election, the lack of a 2nd covid relief bill and the subtle breakouts of a coronavirus second wave across the country, the market has started to dump the safe haven currency.
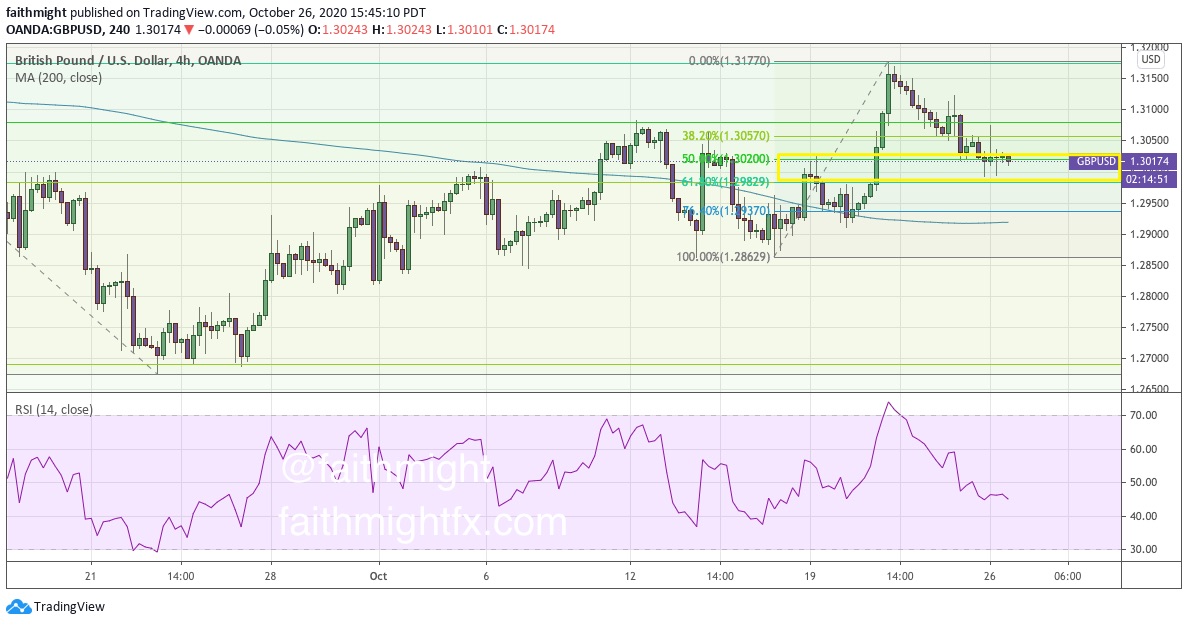
It is important to note that the 1.30 major support level is just below that 50% Fibonacci level. That level is lending some extra support to $GBPUSD bulls. If cable can continue to hold above these 2 levels, it looks like this rally continues higher towards 1.3250.
However, the event risk to consider for this pair this week includes the release of US GDP, US personal spending & personal income and US consumer confidence. And, of course, Brexit headlines continue to spook markets as unscheduled surprise events.
If you are interested in learning how to do fundamental analysis and find levels in your trading, please check out the CHARTS101 course. Read the charts for yourself so you can trade what you see and not what I think.