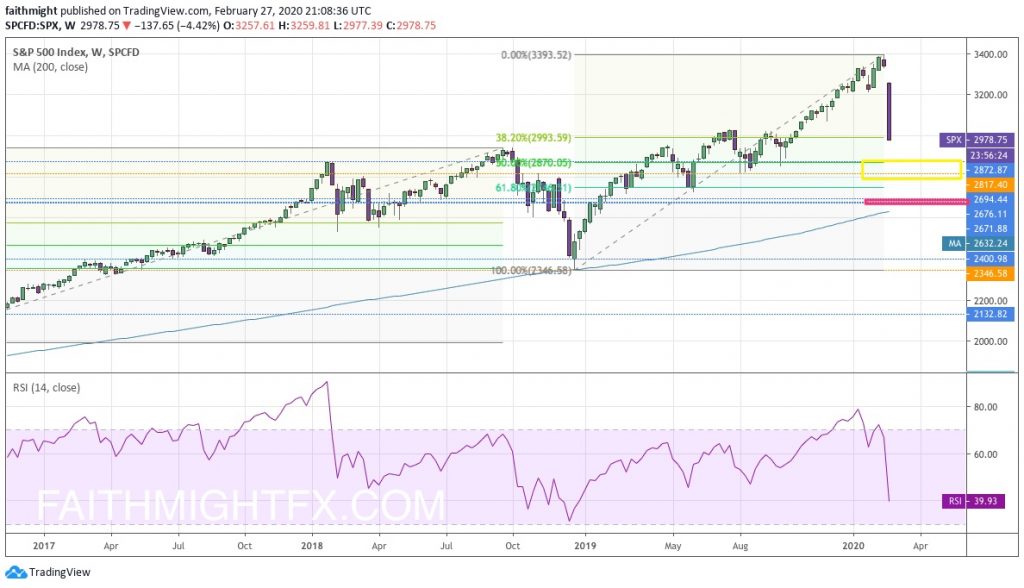
Well, so much for the market correcting 20%. I guess it is all in the timeframe you are using to describe last week’s price action. The $SPX dropped last week, 7 trading days in a row to be exact, to correct over 50% off the all-time highs, measuring from the bottom of the December 2018 market crash. This is what the market looked like last week before the Friday close.
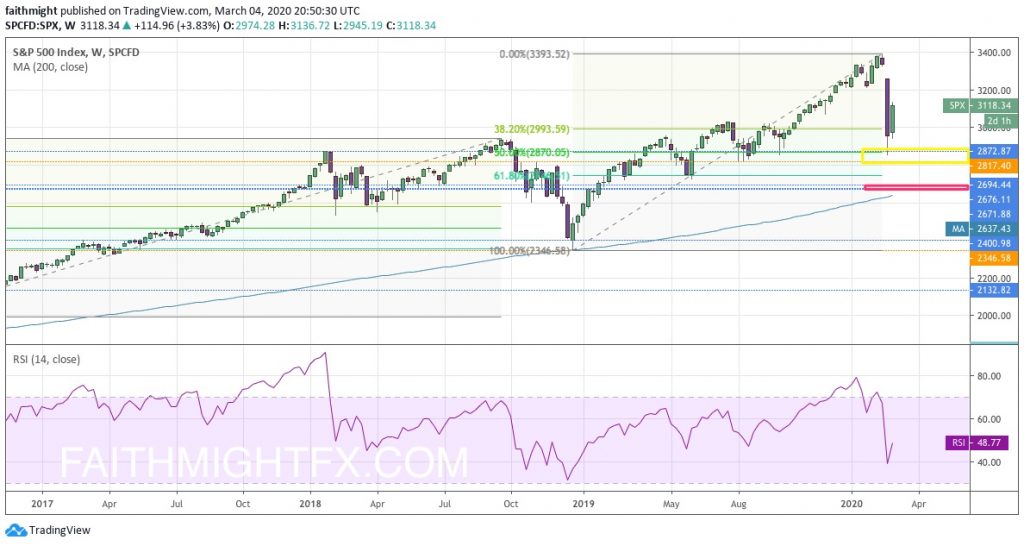
This is what it looks like after, the new trading week is underway.
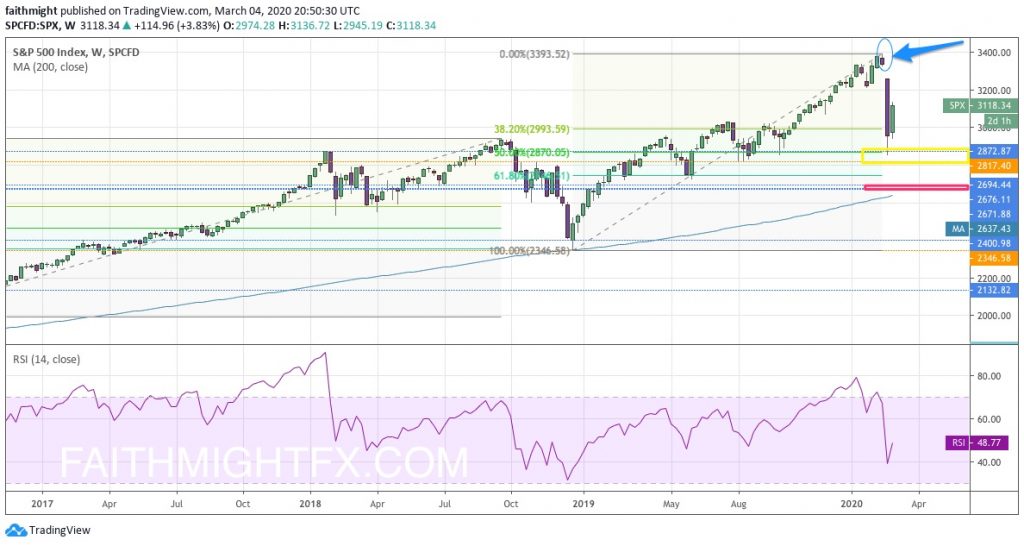
Two weeks ago, I was on the air with Dale and he asked me what I thought about the coronavirus. I told him that I thought the market would in fact turn lower and it would be a buy-the-dip opportunity. I also got too confident and laughingly said that I just caused the top. Well, this is where we were when Dale and I chatted.
Was it something I said? Of course not! It was just my luck that markets would finally react to the news of the coronavirus pandemic into Italy, Iran and the U.S. and the possible economic implications therein. As any technician would say (and I am not one), this is a healthy correction. The 50% Fibonacci level is a solid correction in any market. Now what would really frighten investors is if this bounce this week proves itself to be a dead cat bounce. That actually happened in that aforementioned December 2018 crash. To me, a move above 3200 in the $SPX really begins to signal that sellers have really cleared out of this market. Until then, we should remain cautious.
If you are interested in learning how I found these levels, please check out the course, CHARTS101. Read the charts for your Self so you can invest what you see and not what I think.