fbpx

Sterling Digest, January 5 2013: Trust the crosses

Cover artwork from The Economist 2012 Christmas double issue
Happy new year?

To kick off the new year, the global fundamentals still stink. Currency wars still rage across the globe. American politics continue to debase the world’s reserve currency. And after entering recession in 2012, the British economy is poised for depression in 2013. As terrible as the fundamental landscape seems, I agree with @kathylienfx (read her articles below). The trades that make the most sense in 2013 are the currency cross pairs. While the majors are mired in USD murkiness (fundamentals vs. risk appetite), the crosses more clearly reflect the fundamentals. And as such, these currency pairs seem to have the best trading opportunities in the current forex market environment.


Image credit


Be US Dollar Wary in 2013

The USD is mired in political nonsense. From the debt ceiling showdown last summer to the fiscal cliff this new year, American politics has toyed with the USD for much of 2012. If magazine covers are any indication, we can expect more ratchet politics in 2013.

Another great (and hilarious) @BW cover on TwitpicThe Economist cover: America turns European


With the fundamentals so foggy, I have become very weary of trading the USD. Its price action has been a reflection of both risk and fundamentals which hasn’t always led to very clear swing moves. And as such, I have been trading my favorite currency pair less and less these days.

The $GBPUSD moved higher as expected since the Thanksgiving move back above 1.60. When 1.63 held as resistance, it looked as though cable would remain rangebound. But thanks largely to the fiscal cliff nonsense, cable staged a breakout above the 1.63 resistance level and managed a daily candle close above 1.6300.

Despite the current bullish momentum, the $GBPUSD is still rangebound in the longer term…We still do not have true direction in this pair until it can close above 1.6300 or below 1.5230. (November 25, 2012)

Though we got a daily candle close above 1.63, price crashed. But cable is not exactly bearish…yet.

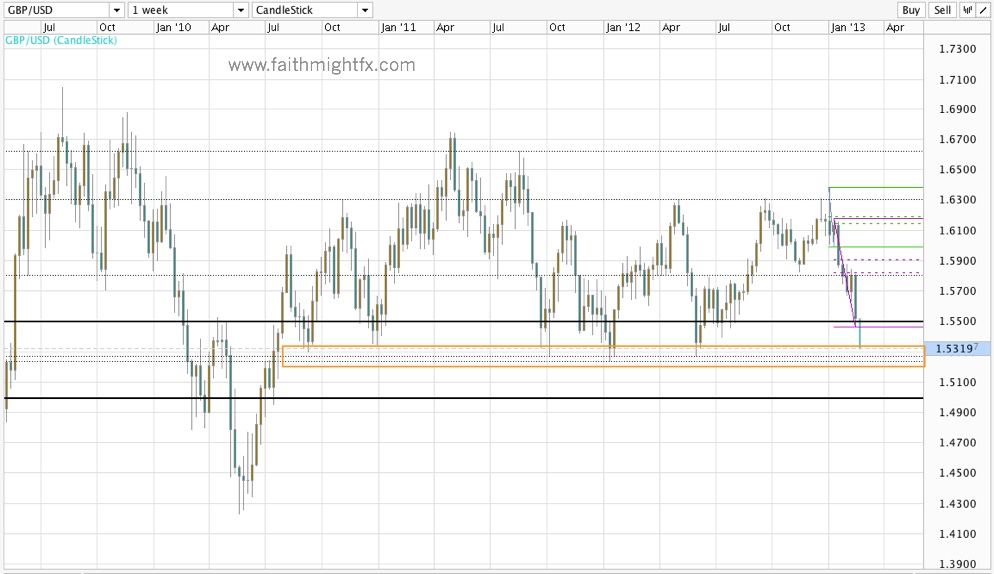
GBPUSD weekly chart

The 1.6381 high broke a triple top at 1.6300-10 and rallied 70 pips higher before exhausting. In addition, the new 1.6381 high is a higher high after price held the 61.8% Fibonacci retracement level which is very constructive price action.

GBPUSD weekly chart

The recent price drop is still merely a correction of the rally. This quote I saw today on StockTwits also makes me think that the recent high is a range expansion. If that plays out and cable holds the 61.8% Fibonacci level at 1.6039, we can expect $GBPUSD to rally back above 1.63. However, if 1.6039 is broken below, a daily close below 1.60 confirms the currently bearish price action.

New Zealand Dollar Moving Beautifully in 2013

In the last quarter of 2012, the $GBPNZD pushed lower to the bottom of the channel at the 1.90 major large quarter point and psychological level. This new low broke strong support levels at 1.9370 and 1.9270. So while it certainly seemed that kiwi was staging a breakout against sterling, $GBPNZD failed to push to new lows below the previous 08/14/2012 low at 1.8962. Instead, price bounced off its channel bottom and headed all the way back to the top of the channel at 1.98.

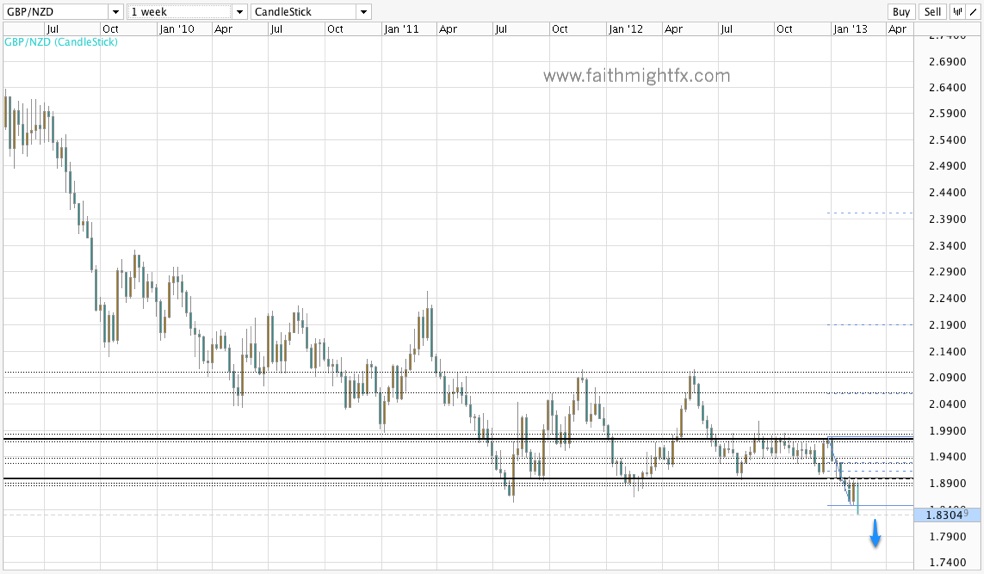
GBPNZD weekly chart

With the range top at 1.98 holding as resistance, price moved decisively lower with spikes below 1.95 in the 1st trading day of 2013. If momentum continues, price should move lower to the bottom of the range and test support levels at 1.9370 and 1.9270.

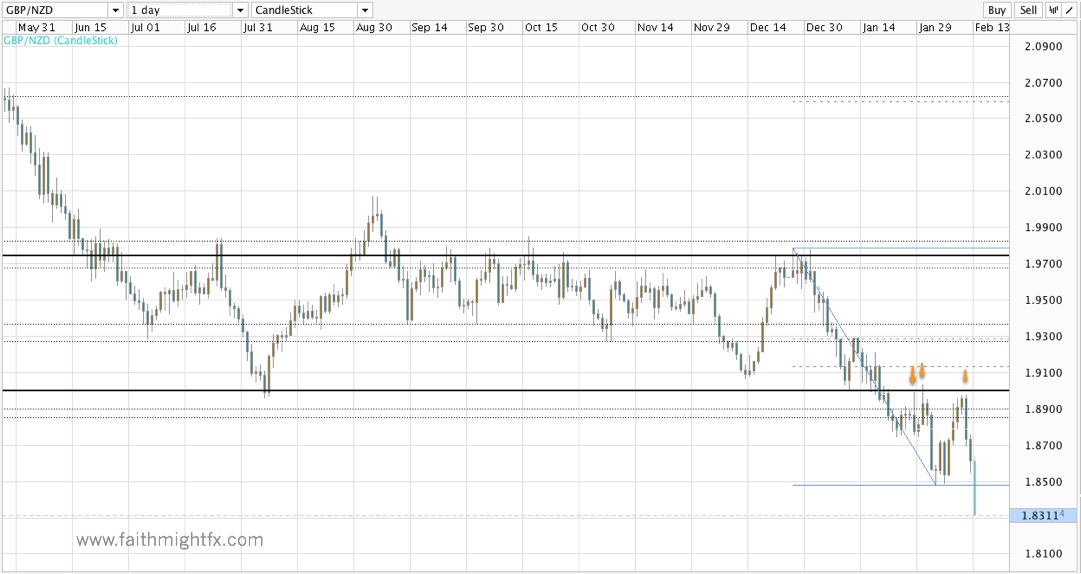
GBPAUD daily chart

Looking at the daily chart too, candle closes below 1.95 have led to more price moves lower.  So while short term momentum looks bearish, the $GBPNZD is still rangebound on the bigger timeframes.

End of Year Breakout Fizzles In 2013

Not long after writing on the bearish outlook of the $GBPAUD, the pair staged a breakout above 1.5425 resistance:

Pops higher, however, should be met by sellers at or ahead of 1.5425 resistance level aiming to take price towards 1.50 in the coming weeks. Only a close above 1.55 changes the short term momentum to bullish.

It seemed as if the pair was turning bullish as it based at 1.50 even ahead of the 61.8% Fibonacci retracement level of the latest bullish wave. When a pair respects its Fibonacci levels on a correction lower, we expect that pair to make a new high higher than the previous high. The $GBPAUD failed to do so. Instead, the breakout fizzled at 1.5676 and has since turned lower.

GBPAUD weekly chart

Despite closing the year above 1.55, the $GBPAUD started off the 1st full day of 2013 trading dropping below that major 1.55 level. Looking to the left of the chart, we can see that previous breaks lower that closed the week below 1.55 saw momentum carry price lower.

GBPAUD daily chart

Even on a smaller time frame, the daily chart, a candle close below 1.55 followed by a subsequent candle close below 1.55 saw a price drop as low as 1.5250.

So despite closing the year above 1.55, the $GBPAUD still looks bearish. It remains to be seen if this is the year the pair resumes its long term bear trend to new lows below 1.4700.

Happy 2013

Sterling leaves 2012 with its larger trends still very much in play. Of course, the $GBPUSD is the outlier as the USD enters 2013 embroiled in political rubbish. However, all the pairs highlighted in November 2012 enter 2013 with the long term trends still largely in play.

  1. GBPAUD False Break Short-lived
joypeace
Happy 2013!

The GBPNZD PreMarket

In the forex markets, premarket is really only early Sunday morning. With charts frozen until the afternoon open, this can be the best time to find insights before charts start ticking again.

GBPNZD weekly chart

Because the $GBPNZD has not spent much time at these levels, it is taking some years for this currency pair to truly trend again.

GBPNZD weekly

Zoom in on the weekly chart and we can see that this pair has been trading rangebound between 1.98 and 1.9270. Last week’s price action tested the intermediate highs at 1.9625 and closed the week in the middle of the channel below the key psychological level at 1.95. The new week open should continue momentum towards the bottom of the channel at 1.9270. That is a key level to the downside for $GBPNZD short term as it continues to consolidate the larger bear trend.

The GBPUSD PreMarket

In the forex markets, premarket is really only early Sunday morning. With charts frozen until the afternoon open, this can be the best time to find insights before charts start ticking again.

Cable closed the week with a Black Friday breakout above 1.6000 and managed to close well above that level. The $GBPUSD spent all last week being supported by the 50% Fibonacci level of the rally from the July lows to the September highs.

GBPUSD daily chart
Last week’s move

GBPUSD daily chart

Now looking to the week ahead, I can see the $GBPUSD toy around 1.60 in the market open as buyers and sellers jockey for position. However, dips below should be met with bids, even as low as the 50% Fibonacci level of Friday’s breakout. If price gets back above or remains above 1.60 in the early week, it is highly likely that price will move towards the 1.6175 highs.

GBPUSD weekly chart

Despite the current bullish momentum, the $GBPUSD is still rangebound in the longer term. So don’t get caught up in this week’s bullish scenario. We still do not have true direction in this pair until it can close above 1.6300 or below 1.5230.


The GBPAUD PreMarket

In the forex markets, premarket is really only early Sunday morning. With charts frozen until the afternoon open, this can be the best time to find insights before charts start ticking again.

The $GBPAUD is in a long term consolidation pattern with price currently hanging out in the middle of the weekly chart channel. So when the lows held at 1.5182 2 weeks ago, it is worthy to note that price still means to head to the bottom of the channel when price failed higher last week again at 1.5425.

 GBPAUD weekly chart

GBPAUD weekly chart

Despite bearish momentum, price managed to close above 1.5300 support level and 50% Fibonacci level. So to start the week the possibility for spikes higher remains at the market open. Pops higher, however, should be met by sellers at or ahead of 1.5425 resistance level aiming to take price towards 1.50 in the coming weeks. Only a close above 1.55 changes the short term momentum to bullish.

The EURGBP PreMarket

In the forex markets, premarket is really only early Sunday morning. With charts frozen until the afternoon open, this can be the best time to find insights before charts start ticking again.

I have been trading the $EURGBP very actively these past 2 weeks. The weekly chart continues to be constructive especially as price held support at 0.7950 to head higher back to 0.8110 on Friday.

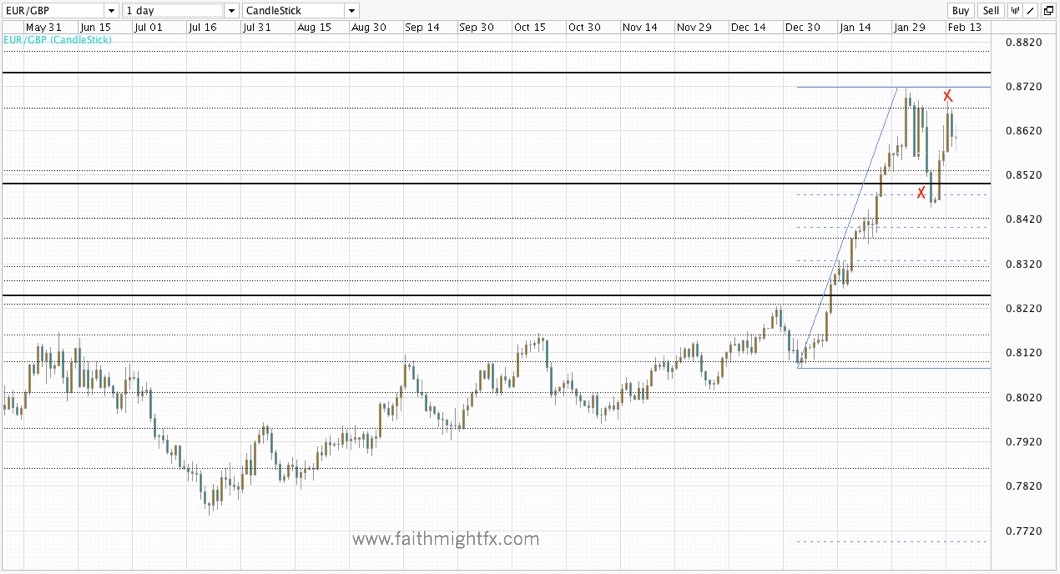
EURGBP weekly chart

Last week started at 0.8003:

EURGBP daily chart
Hindsight is 20/20

EURGBP daily chart as of today premarket

Now we sit at 0.8090 to close that week. That close puts 0.81 at play to determine direction in price action this week. A dip to 0.8050-30 is still possible when markets open because of the close below 0.81 but should be short-lived. I expect price to see itself back above 0.8100 later in the Monday session. Only a close below 0.80 changes the bullish picture in play on the weekly and daily charts.