Archaea Energy is one of the largest renewable natural gas producers in the United States with an industry leading RNG platform and expertise in developing, constructing and operating RNG facilities to capture waste emissions and convert them into low-carbon fuel.
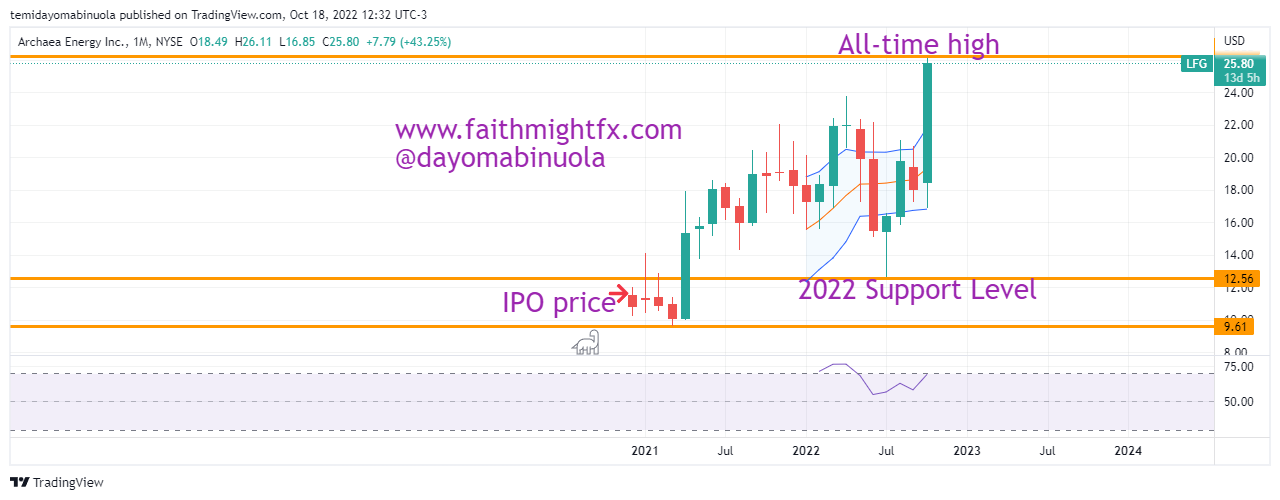
Archaea Energy had its IPO in December 2020 at $11.50 per share. The first four months of its IPO closed bearish until the bulls took over at the beginning of the second quarter in 2021 as price reached a new high in June 2021 at $18.61. The highest point Archaea’s share price reached in 2021 was $21.95 and the closing price for the year was $18.28.
The first four months of 2022 was majorly bullish as Archaea Energy attained a new high at $23.75 in April 2022. The following month was followed by a bearish turn which resulted in price reaching a current year’s low at $12.62 in June 2022. A rally then commenced from the year’s low to an all-time high of $26.12 on October 17, 2022 which was as a result of a gap up.
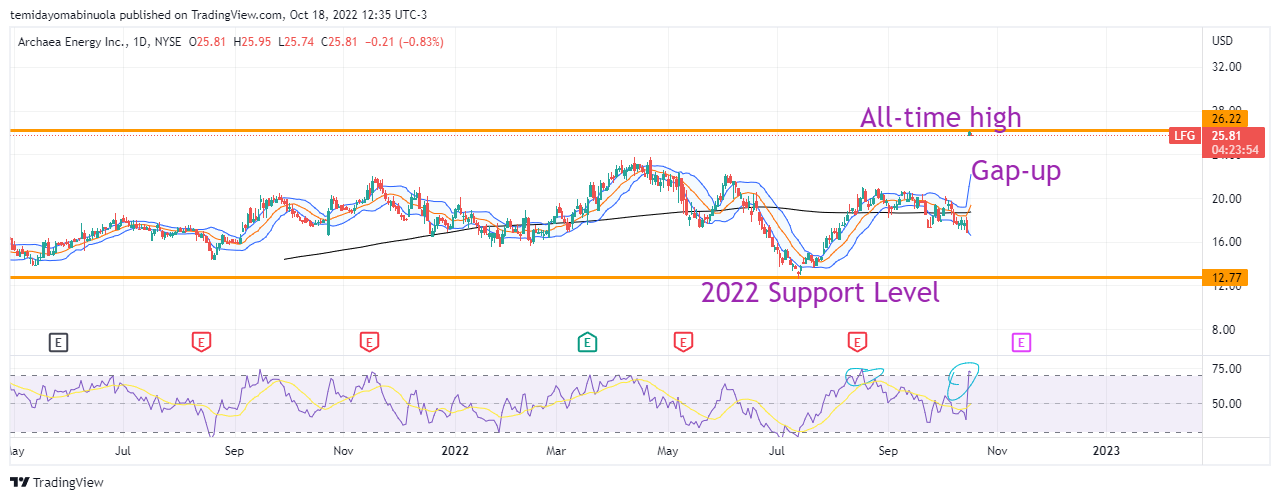
This gap up is the result of a recent announcement by British Petroleum of its plans to expand into bioenergy by acquiring Archaea Energy for approximately $4.1Billion. The gap up led to a 54.15% appreciation in Archaea Energy’s share price which is the highest rally in a single day since its IPO. As a result of the rally, RSI is currently overbought on the daily chart which might lead to a correction in price and this correction might reach $24.
Some of these ideas are in our clients’ portfolios. To understand if this one can work for you or for help to invest your own wealth, talk to our advisors at FM Capital Group. Would you like more information on how to get stocks in your portfolio? Schedule a meeting with us here