fbpx

GameStop Rally Might be Countered by the Bears

GameStop Rally Might Be ShortLived

GameStop ($GME) is an American video game, consumer electronics, and gaming merchandise retailer. The company is headquartered in Texas, USA. GameStop is the largest video game retailer in the world. GameStop was founded 39 years ago. As of January 2023, GameStop had 4,413 locations. The revenue as of 2022 was at $5.93billion. In 2022, $GME had a full-time employee strength of 11,000; and 14,000-27,000 part time employees as of January 2023.

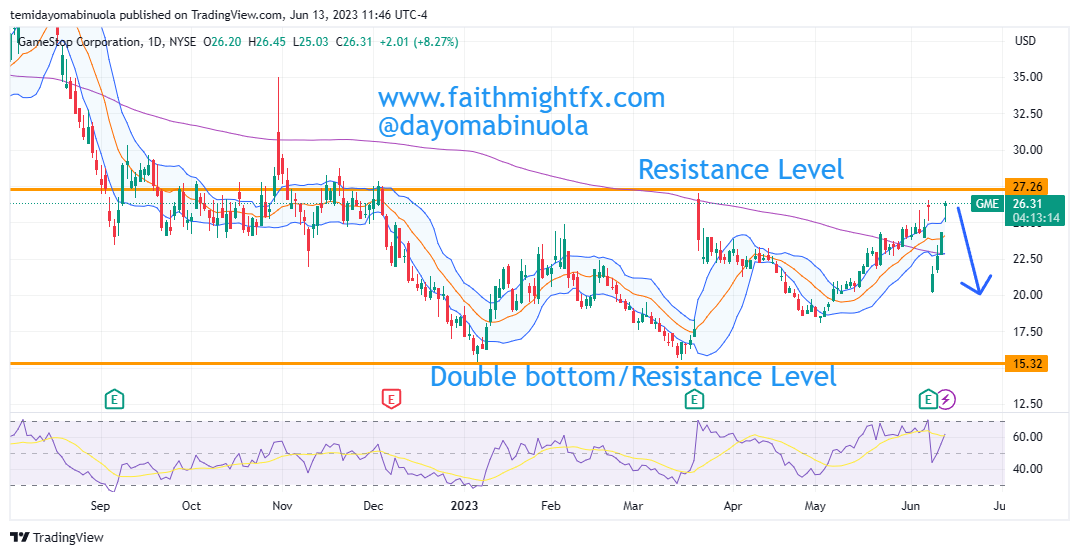
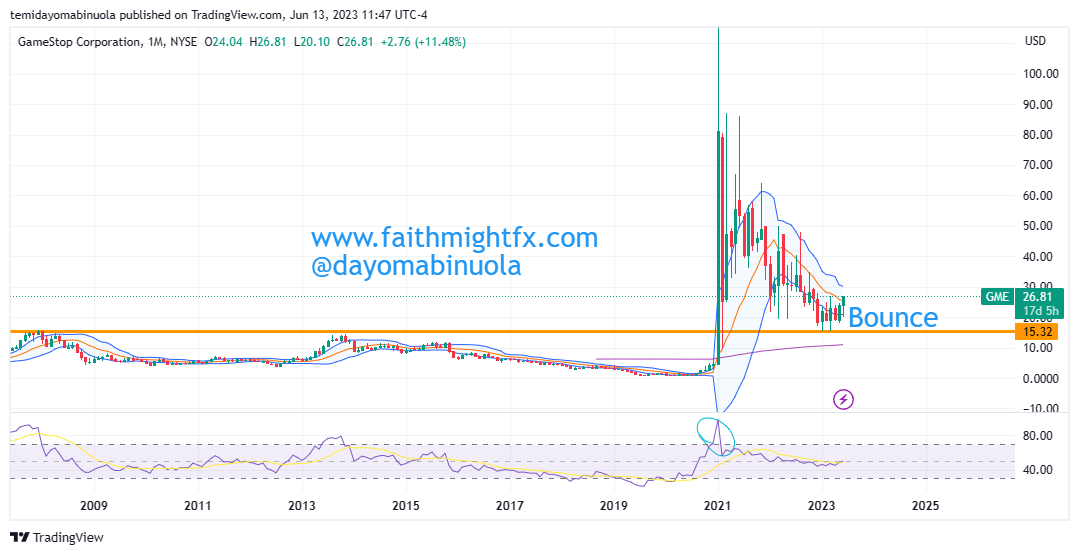
On the 8th of June, a gap-down occurred but as of the 12th of June 2023, a rally occurred to close up the gap-down. On that day, $GME opened at $22.85 and closed at $24.30 i.e. $GME gained 7.14% in a single trading day. However, our analysis forecasts that $GME bears will take control of the price movement regardless of the recent rally. The price of GameStop might fall from the current price of $25.80 to $17.62 in the coming weeks.

Some of these ideas are in our clients’ portfolios. To understand if this one can work for you or for help to invest your own wealth, talk to our advisors at FM Capital Group. Would you like more information on how to get stocks in your portfolio? Schedule a meeting with us here.

Tesla’s Share Price Dips to Previous Month’s Low

From the all-time of Tesla in November 2021 at $418 per share, the $TSLA share price has been falling in value. All investments made at the beginning of 2022 ended in negative figures due to the one year plus bearish trend. Despite the bearish trend in the market, Tesla made a revenue of US$81.46billion in 2022.

Despite the bearish trend of 2022, price of $TSLA was beginning to rally in 2023. with the price bouncing from the 2022 support level of $101 to the 2023 high of $218. In recent weeks the bears have pushed price to $155 and this could continue for some time.

On Thursday the 20th of April, 2023, the tesla share price opened with a gap down at $166. The lowest in the previous month was $164. The price on that Thursday closed at $163.04, a little bit lower that the March 2023 lowest price. Since the gap down, the bulls have failed to make a turnaround in the price as the price keeps falling.

ON the 4hr chart, RSI showed that price had been overbought at two different times in March and currently shows that price has been oversold once in April. We might be falling to $113 in the coming weeks.

Some of these ideas are in our clients’ portfolios. To understand if this one can work for you or for help to invest your own wealth, talk to our advisors at FM Capital Group. Would you like more information on how to get stocks in your portfolio? Schedule a meeting with us here

Layoffs, A Probable Cause Of Amazon’s Drop In Share Price

Amazon's Layoffs Linked To Share Price Fall

Amazon’s share price since it reached its all-time high at $189.78 in July 2021, has been falling. In December 2022, price hit $81 which is the lowest price since March 2020. Currently, $81 is the support level.

As 2023 opened, price initially consolidated around the support level. But in the second week of January, a bounce occurred. This bounce lifted price to $114.22 by the second day of February 2023. This is the highest price that the Amazon stock has attained in 2023. 

Monthly Chart

After this rally, price dropped. As at last week on the 13th, Amazon’s share price had fallen to $88.71, the lowest price so far this month. There was a bounce that took price to $100 but the bears suddenly kicked in. Our analysts have come to conclude that this bearish takeover was probably a result of the recent mass layoff by Amazon. With this recent layoff, Amazon has totaled 27,000 employees that it has laid off this year.

Taking all this into account, our analysts think the bulls will reclaim the reins from the bears soon and price will rise to $120 in the next few weeks.

Daily Chart

Some of these ideas are in our clients’ portfolios. To understand if this one can work for you or for help to invest your own wealth, talk to our advisors at FM Capital Group. Would you like more information on how to get stocks in your portfolio? Schedule a meeting with us here

AMC Appreciates By 16% In A single Day

AMC Sees 16% Gain In One Day

The AMC Entertainment has the largest movie theatre chain in the world. It was founded in 1920. Also, AMC has the largest share of the U.S. theatre market. In 2016, AMC Entertainment acquired Odeon Cinemas, UCI Cinemas and Carmike Cinemas in 2016. AMC has 2,807 screens in 353 theatres in Europe and 7,755 screens and 93% of the theatres in the United States. It is listed on the NYSE and as of 2021, it had a revenue of $2.53 billion and a total staff of 31,198.

Daily Chart


Just like many companies, AMC Entertainment had a tough 2020 as the company was shut down for 12 weeks which made the share price hit an all -time low at $1.03. 2021 was much better than 2020 as the share price reached an all-time high at $44.68 in June 2021, which was double the price of the previous high in 2015 at $22.45.

Weekly Chart


The unexpected happened as price of AMC Entertainment had a massive fall from the all-time high to $3.72 in December 2022. There seems to be relief as price bounced by 16% in a single day. Could this be the beginning of a huge rally for the AMC shares in the coming weeks? In December 2022, RSI indicated that price had been oversold, and a rally is expected. The rally could push the price above $10 in the next few weeks.

Some of these ideas are in our clients’ portfolios. To understand if this one can work for you or for help to invest your own wealth, talk to our advisors at FM Capital Group. Would you like more information on how to get stocks in your portfolio? Schedule a meeting with us here

Disney Share Price Consolidates

Disney Share Price Consolidates

The Walt Disney Company is an American Multinational mass media and entertainment conglomerate. Disney was founded in 1923, which is about a century ago. Disney is traded on NYSE as $DIS. As of February 2023, Disney’s market cap stood at about $197Billion. As of 2020, its total number of employees was over 200,000. After the share price of Disney reached an all-time high at $203.13 in March 2021, the value of Disney depreciated all through 2022 as price reached $84.13, which was the lowest price since March 2020.

Daily Chart

The year 2023 seems to be bringing a bit of hope as January closed on a bullish note. The price has continued to rally in February as price reach a new high this year at $118.10, which occurred on the 9th of February. The $DIS bulls might push price higher in the coming weeks. Our analysts think the $DIS price could reach a resistance level at $140 if the rally continues. On the weekly chart, RSI indicates that price has been oversold. This could be good news for $DIS investors.

Weekly Chart

Some of these ideas are in our clients’ portfolios. To understand if this one can work for you or for help to invest your own wealth, talk to our advisors at FM Capital Group. Would you like more information on how to get stocks in your portfolio? Schedule a meeting with us here

Shopify Rallies To A 9-Month High

Shopify is a multinational e-commerce company headquartered in Ottawa, Canada. As of 2021, the revenue of $SHOP was $4.61 billion with a total number of 10,000 employees. Shopify’s IPO took place on May 21, 2015, on TSX and NYSE at $17 per share. Right from its IPO, Shopify investors have enjoyed a rather smooth rally for years up until its all-time high at $176 in November 2021. After the month of the all-time high, the next 7 months closed bearish on the monthly charts.

Weekly Chart

In October 2022, price had dipped as low as $24.05 as a result of the bearish run from the all-time high. That was over 86% decrease in value. Since 2023 opened, Shopify’s share price has been rallying. This rally has taken price up to a 9-month high. Currently, price is at $47.33. This rally might be for a short period of time as the bears might push price lower below $23 in the coming months. The weekly chart shows price is oversold but the monthly chart shows price has been overbought. The bullish momentum might be counteracted with an aggressive bearish turn.

Monthly Chart

Some of these ideas are in our clients’ portfolios. To understand if this one can work for you or for help to invest your own wealth, talk to our advisors at FM Capital Group. Would you like more information on how to get stocks in your portfolio? Schedule a meeting with us here

AMTD Digital Surges by 199% in 24 hours

AMTD Digital surges by 199% in 24 hours

AMTD Digital is a Hong Kong-based financial technology firm founded in 2019. It’s a subsidiary of AMTD Group. It had its IPO in July 2022 on the New York Stock Exchange at $12 per share. In August, just two weeks after the IPO, there was a rally that took price up to $2545 which stands as the all-time high. That price gain was over 212X.

Daily Chart

After the all-time high was reached, there was a massive price dump in that same month of August and price went below $100. Since September 2022, price has been below $100. AMTD Digital closed 2022 below IPO at $10.09. It opened on the first trading day of 2023 at that same price. On the 5th of January, there was a gap up and price closed for the day at $29. This rise was an appreciation of 199.50% in one trading day.

Weekly Chart

Currently on the daily chart as a result of the price rally, RSI shows price has been overbought. Our analysts think that price might rally to $60 soon.

Some of these ideas are in our clients’ portfolios. To understand if this one can work for you or for help to invest your own wealth, talk to our advisors at FM Capital Group. Would you like more information on how to get stock your portfolio? Schedule a meeting with us here

Credit Suisse In Worst Ever Bearish Run

Credit Suisse in worst ever bearish run

Founded in 1856, Credit Suisse Group AG, Credit Suisse for shorts, is a global investment and financial services firm based in Switzerland. It is not only listed locally on the Swiss Stock Exchange, and it is also listed on the London Stock Exchange and New York Stock Exchange.

Monthly Chart

In September 1995, Credit Suisse Group AG got listed on NYSE at an IPO price of $22.93. Since the IPO, Credit Suisse bulls have been able to push price to an all-time high at $77.38 in April 2007. Since this all-time high, the bears have steadily gained control of the price movement as price dipped to $17.94 i.e. below IPO, in March 2009.

Weekly Chart

From March 2009, there was a rally to October of that same year that took price to $58.69. However, since then, Credit Suisse has nosedived as share price hit a record low of $3.37 yesterday, November 28, 2022. According to Bloomberg, this is the investment bank’s worst bearish run ever. According to our analysts, Credit Suisse share price is expected to bounce from this point to $6 soon.

Some of these ideas are in our clients’ portfolios. To understand if this one can work for you or for help to invest your own wealth, talk to our advisors at FM Capital Group. Would you like more information on how to get stocks in your portfolio? Schedule a meeting with us here

Goldman Sachs On A 6-Week Rally

Goldman Sachs on 6-Week Rally

On the first trading day of the year 2022, Goldman Sachs share price opened at $387.10. The bulls only enjoyed a few days of rally as price reached the year’s high at $413.33. This mark was hit on the 5th of January which was the third trading day of the year.

Daily Chart

Following this rally that took price to the year’s high, the bears have been in control of the price movement causing a dip in price. This dip has seen Goldman Sachs’ price sink to hit the year’s low at $278.19 in July 2022. The last time price went this low was in January 2021. It is worthy of note that Goldman Sachs hit its all-time high in the same year 2021 at $426.50.

In the second half of this year, the bulls have become more active. There was a bounce from the year’s low to $359.50 in August 2022, which was also the initial resistance for the second half of 2022. When this resistance was hit, there was a correction on the weekly chart which caused price to fall below $300 for the second time in the year. 

Weekly Chart

In October 2022, the bulls regained control of the price movement sending Goldman Sachs’ share price on a 6-week jolly ride upward. Price is currently at $379.14, which is the resistance level on the weekly chart. Although, RSI indicates price is overbought on the daily chart, it does not indicate that it is overbought on the weekly chart. Our analysts believe that this rally is strong enough to take Goldman Sachs’ share price to a new all-time high.

Some of these ideas are in our clients’ portfolios. To understand if this one can work for you or for help to invest your own wealth, talk to our advisors at FM Capital Group. Would you like more information on how to get stocks in your portfolio? Schedule a meeting with us here

Meta Falls Below $100 For The First Time Since 2016

Meta is one of the world’s most valuable companies. As of 2021, the revenue was over $117billion. Mark Zuckerberg is the controlling shareholder of Meta. In October 2021, Meta changed its name from Facebook. Meta reached an all-time high at $384.33 in August 2021. All months in 2021 closed bearish except for March and April 2022. The Bulls are having a hard time with the continuous downtrend movement since 2021 all-time high.

Weekly Chart

Meta’s share price closed at $130.28 on the 26th of October, but opened today, the 27th of October at $98.04 as a result of a gap-down. On the Daily Chart, RSI shows price has been oversold in September and October. A price rally might occur, which could close the gap down and price could reach $120.

Monthly Chart

Some of these ideas are in our clients’ portfolios. To understand if this one can work for you or for help to invest your own wealth, talk to our advisors at FM Capital Group. Would you like more information on how to get stocks in your portfolio? Schedule a meeting with us here