fbpx

Cable Clues

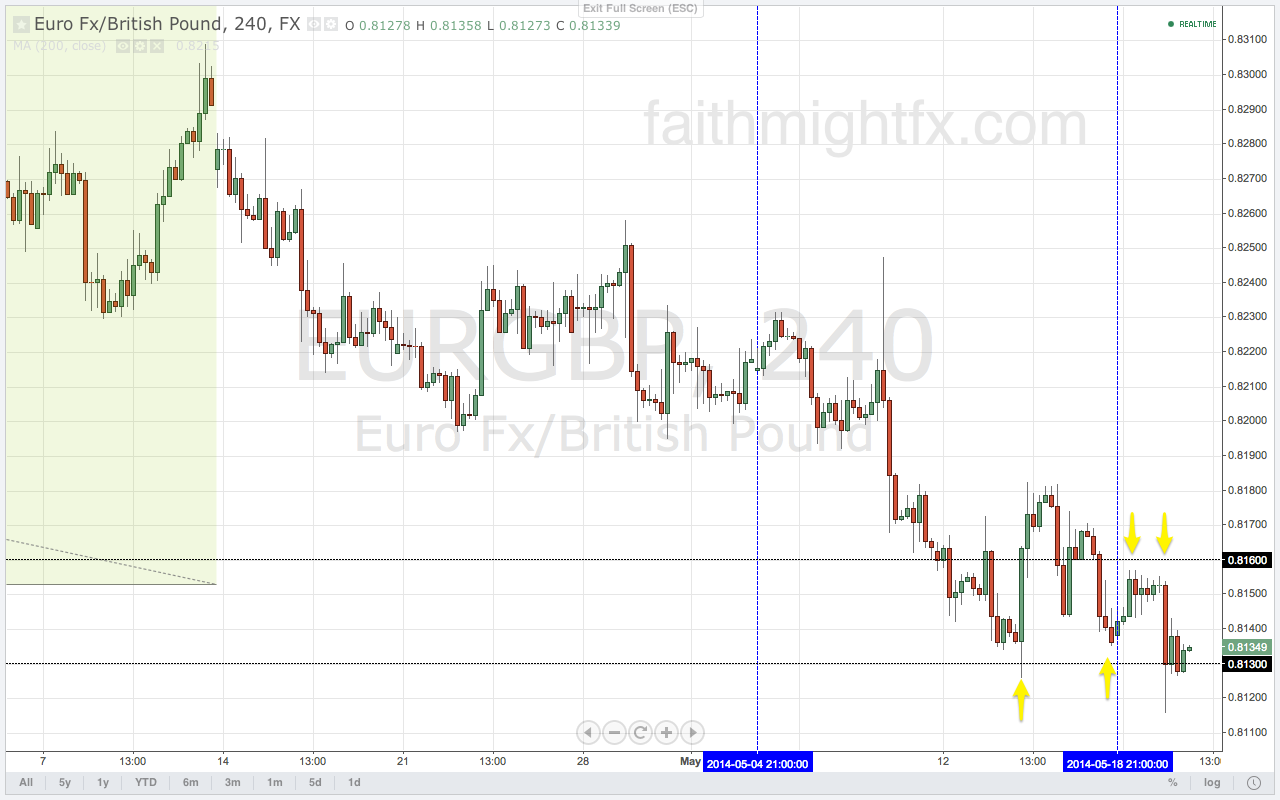
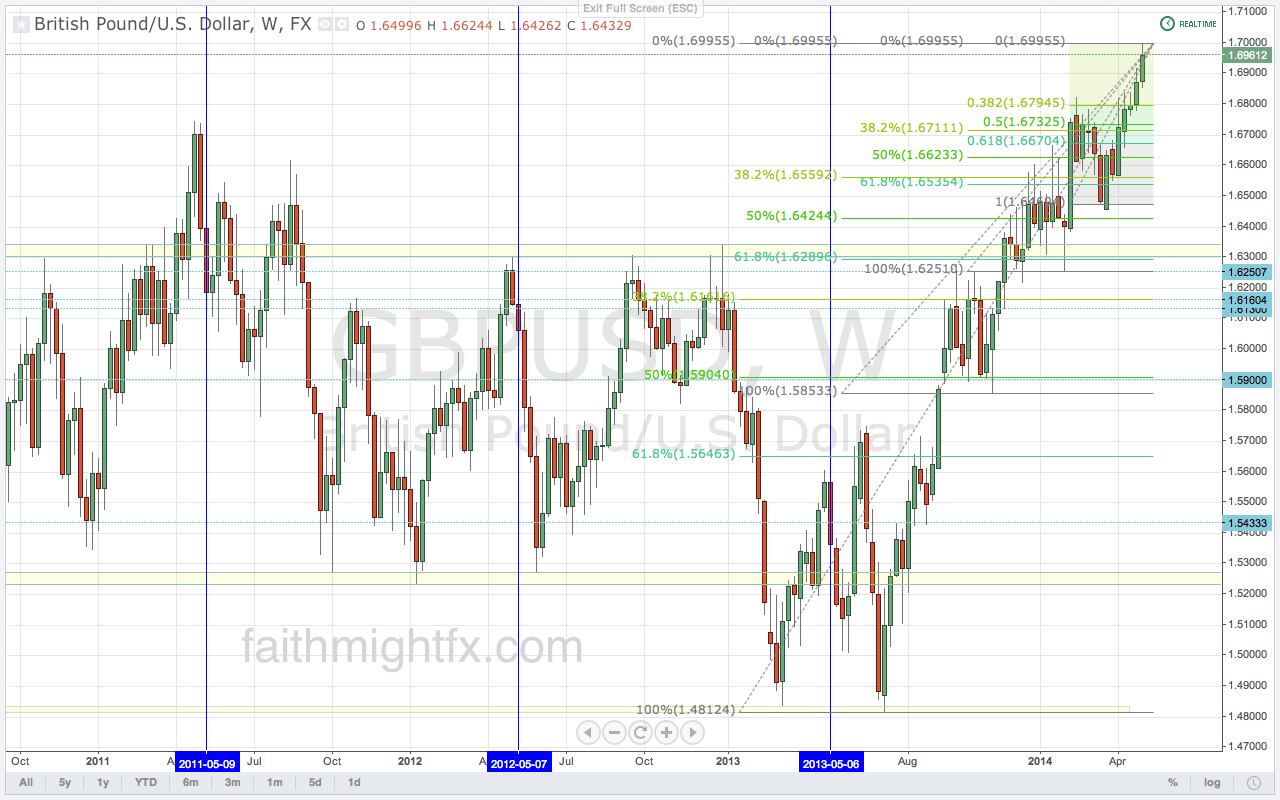
I came out of my long position just around break even as the bears trumpet grows louder. I was bullish on $GBPUSD when price bounced off the 50% Fibonacci level last week.

GBPUSD DAILY CHART

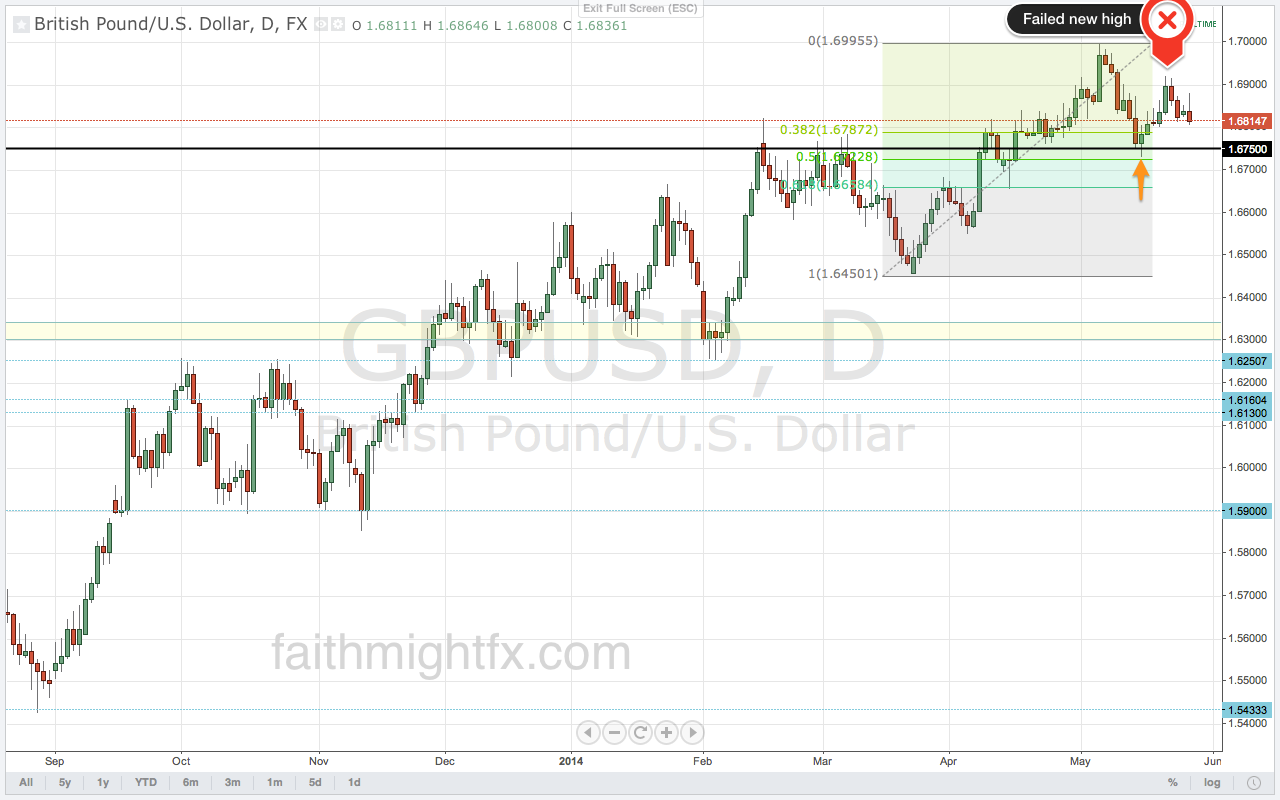
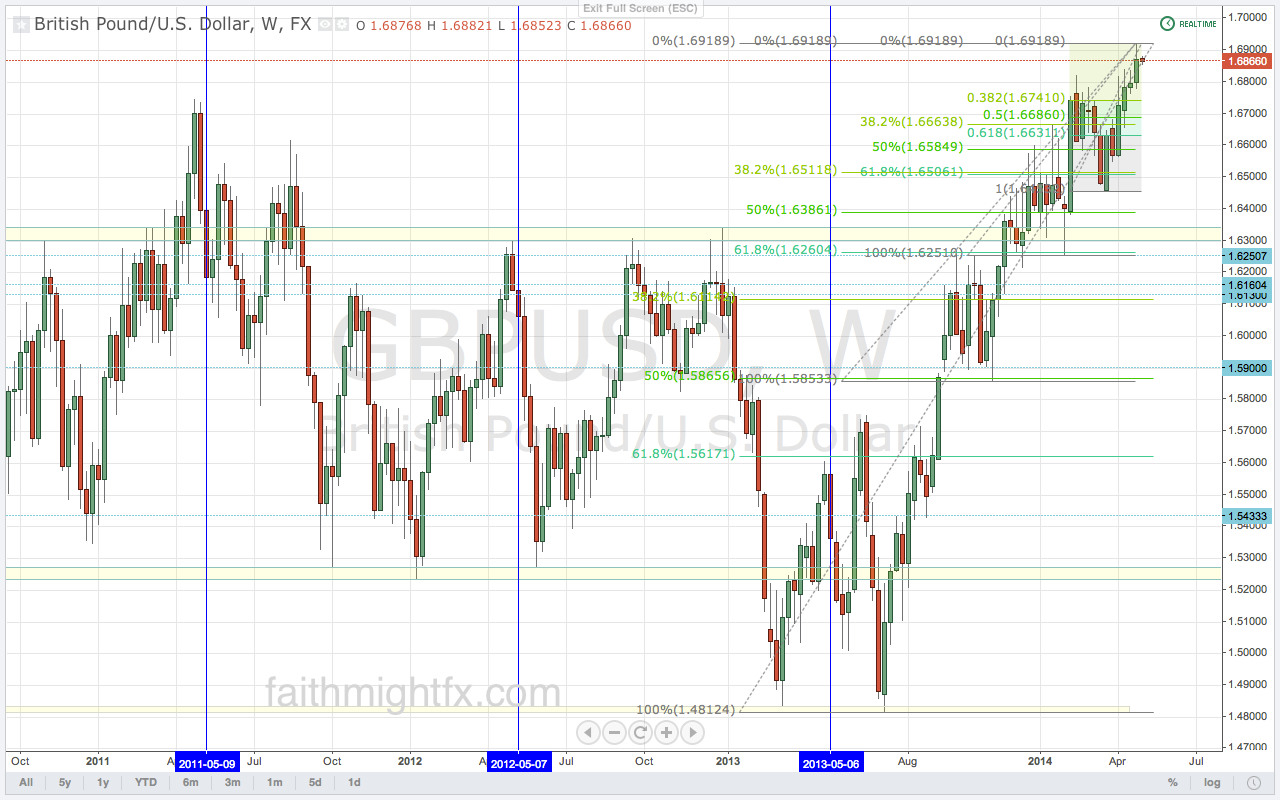
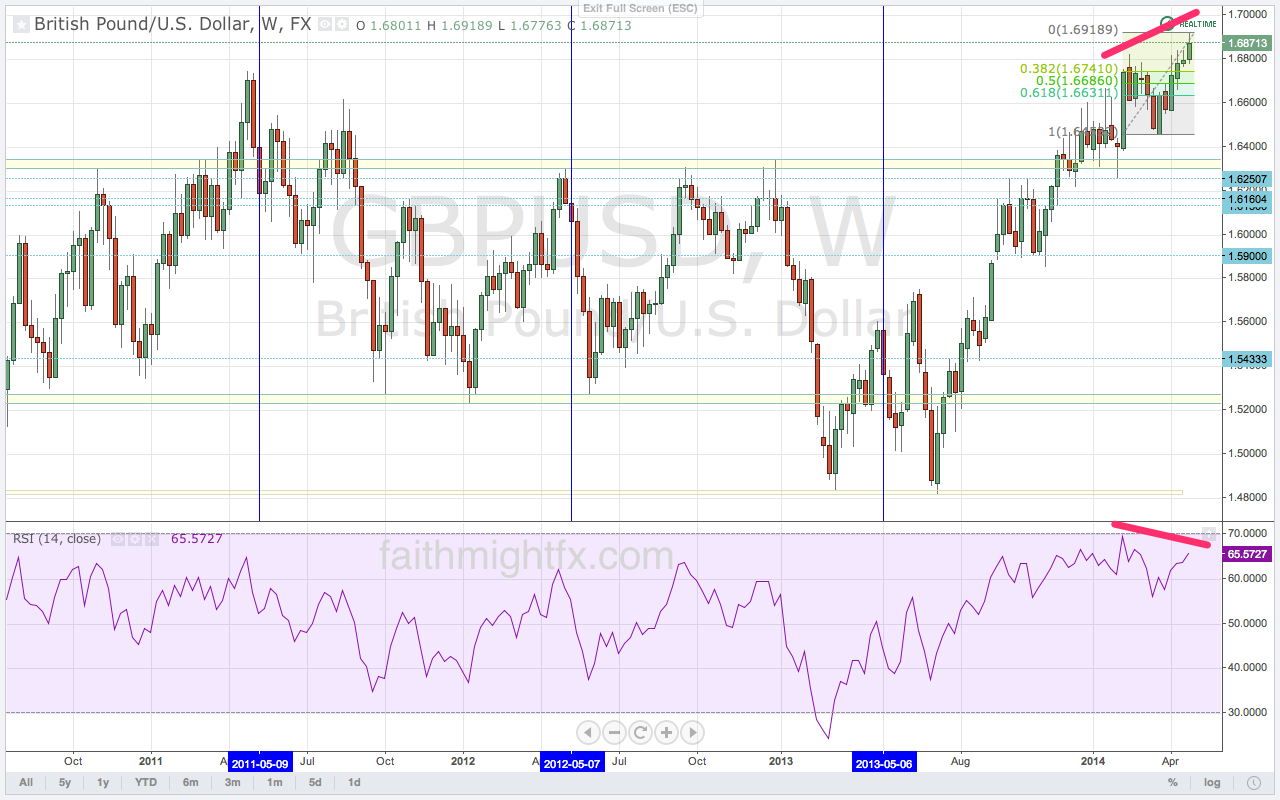
But I missed these clues when price revisited former resistance at 1.6920.

GBPUSD 4 HOUR CHART

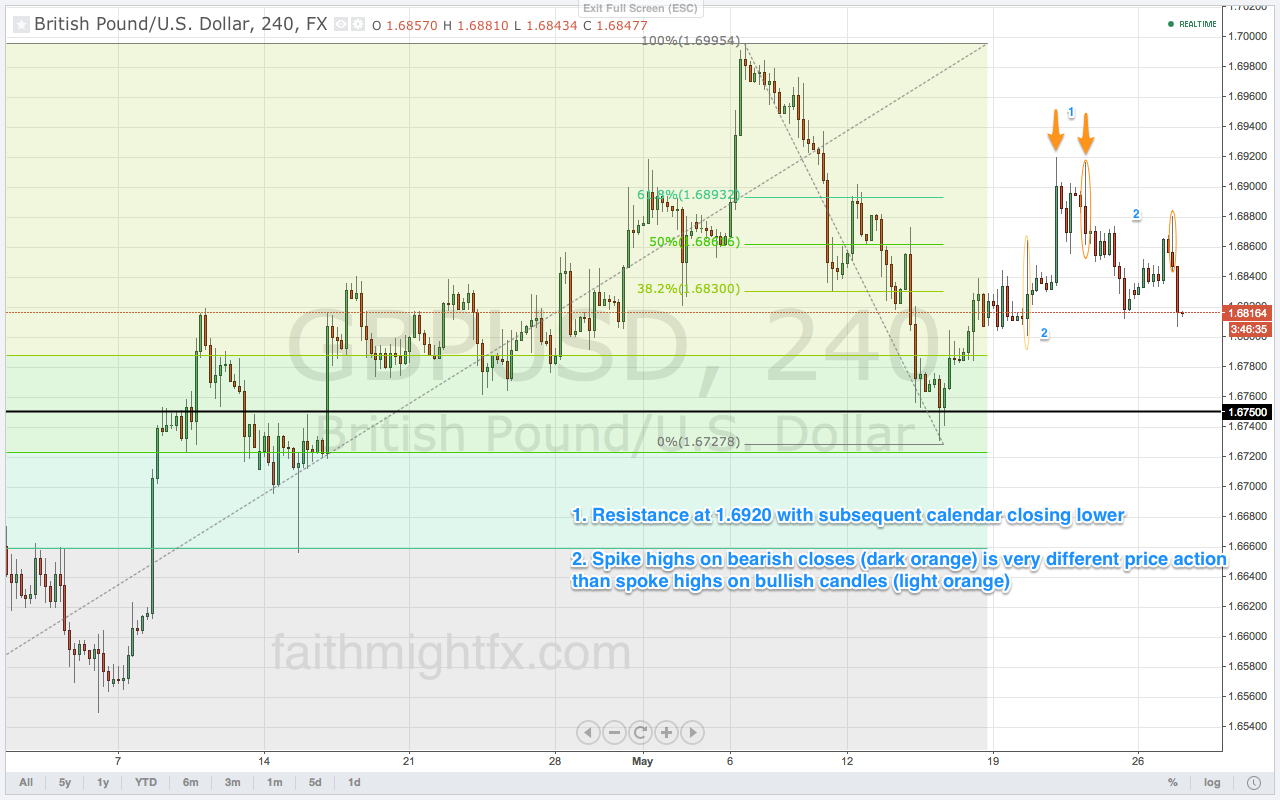
On the rally last week, I failed to pay attention to the 4-hour chart. I liked how the daily chart was setting up but failed to see what the shorter- time frame was signaling. Worse yet, when price failed 1.6850 (my mental stop) I failed to exit my position. I didn’t make my mental stop a physical stop. I put too much weight in the bullish UK CPI, BoE minutes, and retail sales and not enough weight to price action.

Moral of the story: Stick to your rules for getting out of the trade. Technicals trumps fundamentals. Journal your mistakes so you’ll never repeat them.


EUR/GBP On Trend

I really like this break in 0.8130 today. Last week, it was support on that break of former weekly lows at 0.8160. Because $EURGBP is good to produce fakeouts, it was the 0.8130 level that would validate and confirm a true break to new lows.

EURGBP 4 HOUR CHART

So I was long last week and we can see several spike rallies on the above 4-hour chart. But when Friday’s price action languished below 0.8160, I became convinced that the $EURGBP remained on trend and I changed my stance.

Despite lower prices in housing, the core CPI number released today hit the BoE’s “eyebrow raise” level of 2%. A 2% CORE CPI will have the BoE watching inflation closely this summer. If this number trends upward, Carney will have to readjust his rate raise timeline just stated recently in the Inflation Report last week. That could be very bullish for sterling and substantiate these new midterm lows.


Oh, The Possiblities

today's tweet

To be bearish is to recognize that $GBPUSD is, for now, simply correcting. Given the bull trend, cable is free to tumble quite a bit if she wants to and still be a bullish bitch back to 1.7000. This large psychological level still remains on target for bulls because GBP has the economy and central bank to back up the rosy sentiment.

But consider the bearish case for the moment. How low can price really go?

GBPUSD DAILY CHART

The most interesting levels on this chart are those where we find confluence with major support and previous resistance levels. Take note where cable stands after this May seasonality has run its course.

May Pounds

$GBPUSD has staged such an impressive rally in the month of April. The UK fundamentals have established a trend of a solid recovery. The “misses” this week are still good numbers. GDP and the PMIs showed growth so the UK economy continues to recover. This trend has given life to sterling especially versus the USD which hasn’t managed to strengthen on the taper. I don’t know if taper is tightening but I believe it is only a matter of time before we see 1.70 in  $GBPUSD. However, there are 2 things that may put that target on hold: May seasonality and a still diverging RSI. Forget May flowers. It’s all about dumping May pounds. 

 GBPUSD WEEKLY CHART

The RSI on cable has been diverging  for weeks now. As price manages to extend the rally to new highs, there just hasn’t been much in the way of strength. With so many bulls in the market perhaps cable is running out of buyers.

The timing of a correction couldn’t be sweeter.  The market has a tendency to sell cable in May. The old trading adage, “Sell in May and go away”, couldn’t be more applicable here.  I talk about it every year. So to be different this year, I give you a linkfest of this May seasonality trend in $GBPUSD. More traders are talking about it this year.