Alphabet Inc. was founded 26 years ago. The establishment of Alphabet Inc. was prompted by a desire to make the core Google business “cleaner and more accountable” while allowing greater autonomy to group companies that operate in businesses other than Internet services.
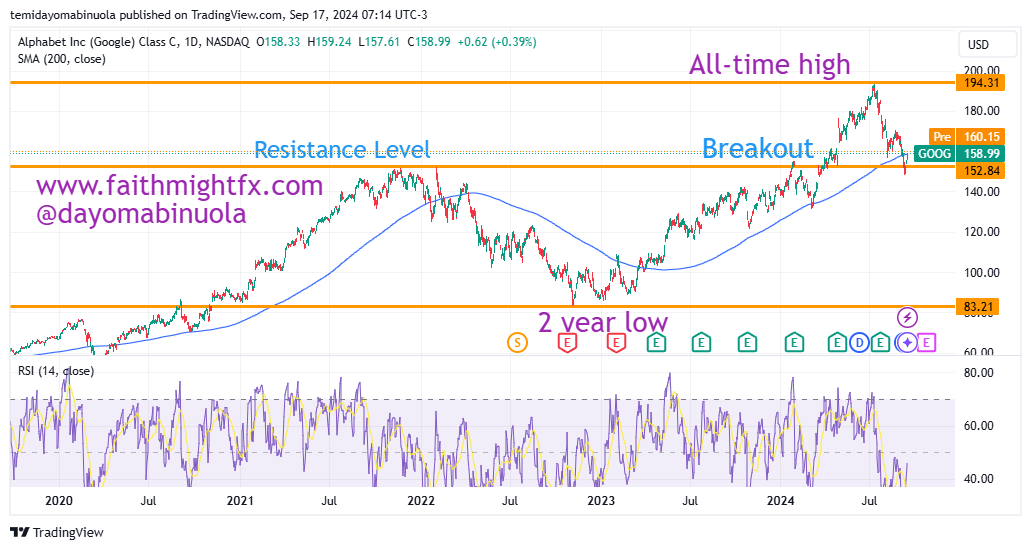
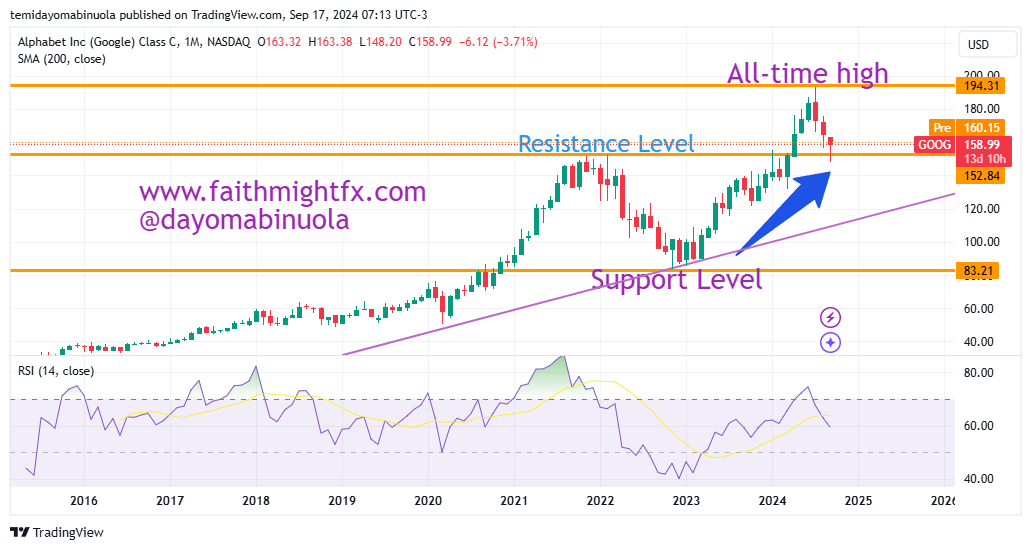
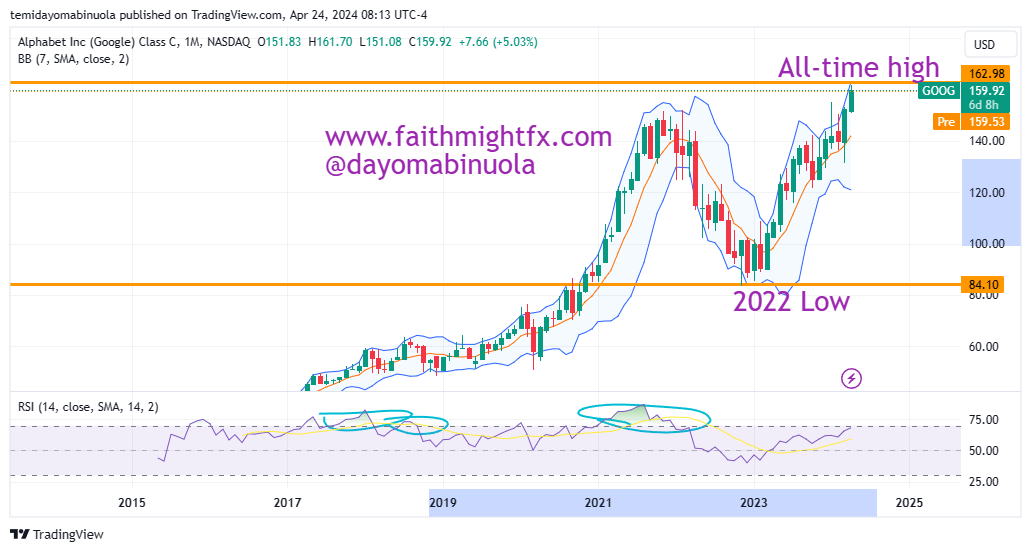
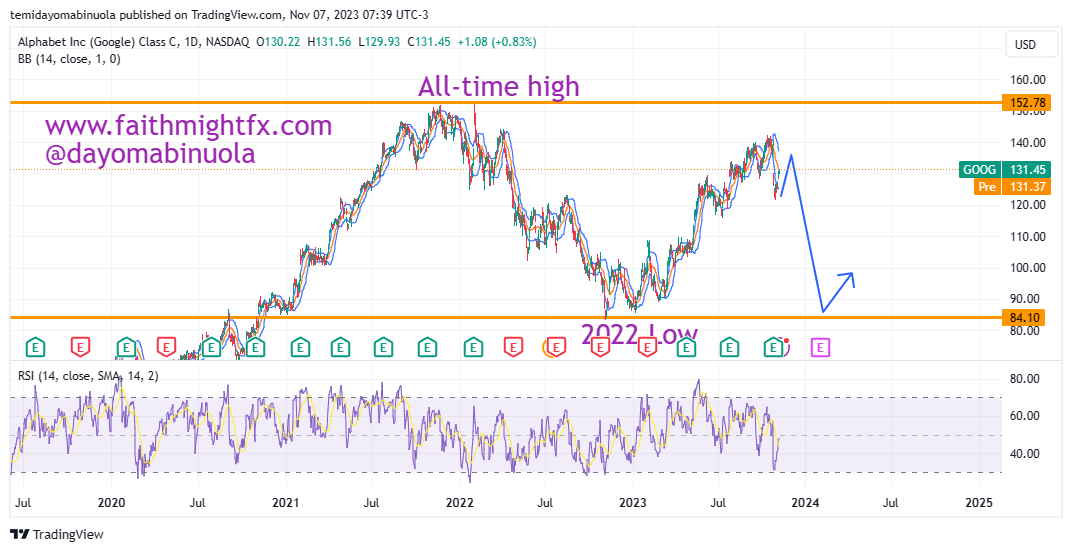
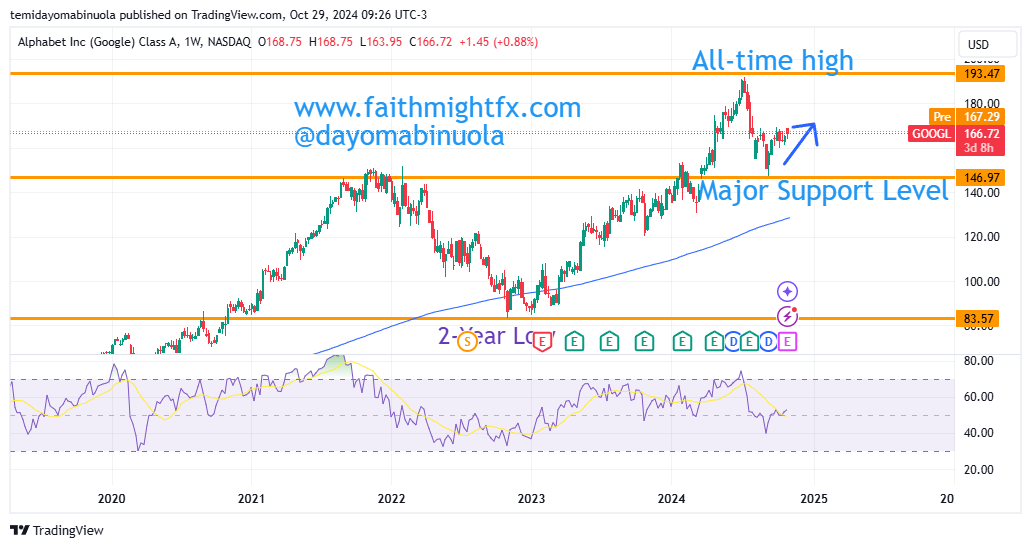
$GOOG’s opening price in 2024 was $138.40. Price rallied to an all-time of $191.72 this July. Some of the gains in 2024 have been lost as the current price is at $166.72 per share. Alphabet, Inc will report earnings today, expecting Q3 adjusted earnings of $1.84 per share on $86.37 billion in revenue, up from last year’s $1.55 per share and $76.7 billion in revenue.
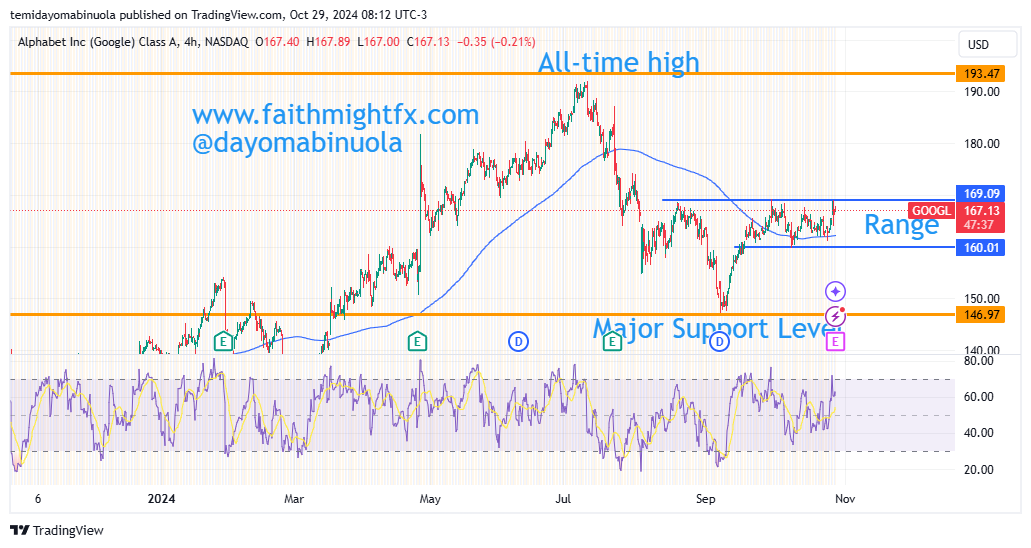
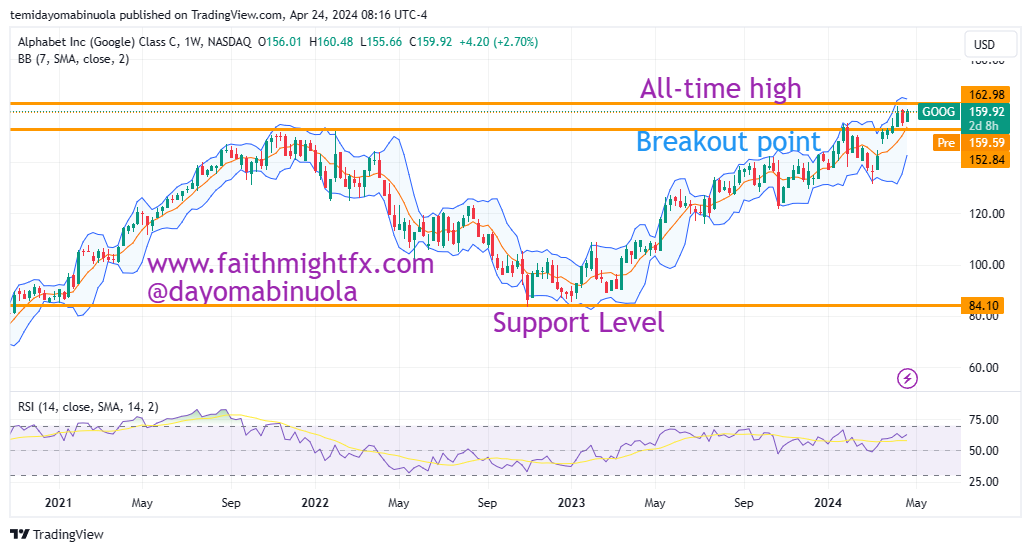
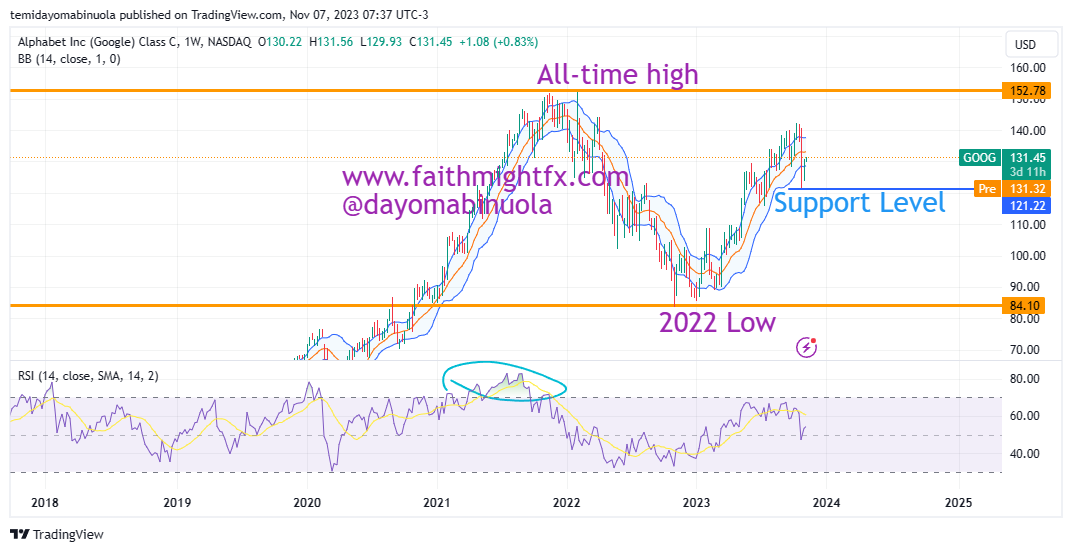
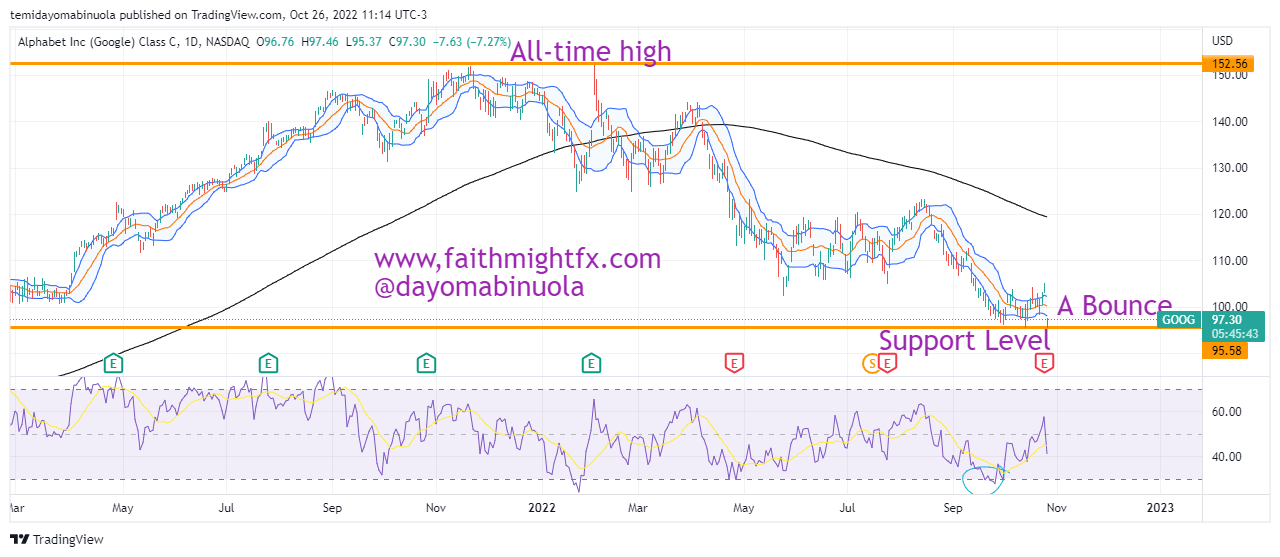
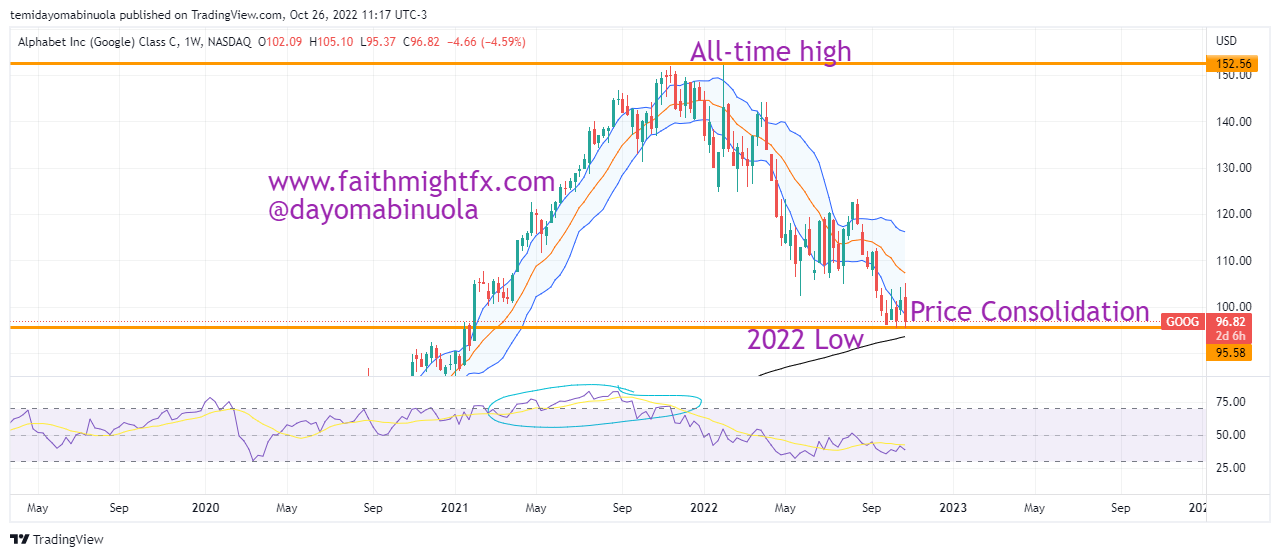
The fall in the price of Google made price reach $146.97 on September 9, which stands as the current support level. A bounce from the support started on September 11, 2024. There have been a price range in the value of $GOOG since mid-September. Price has been ranging from $160.01 and $167.43. A breakout of the range to the upside is expected soon. The might lead to price gain in the value of $GOOG after the recent loss. The next rally might lead to the price of GOOG breaking new highs in the coming weeks. We see price hitting 190.40 in a couple of weeks.
Some of these ideas are in our clients’ portfolios. To understand if this one can work for you or for help to invest your own wealth, talk to our advisors at FM Capital Group. Would you like more information on how to get stocks in your portfolio? Schedule a meeting with us here