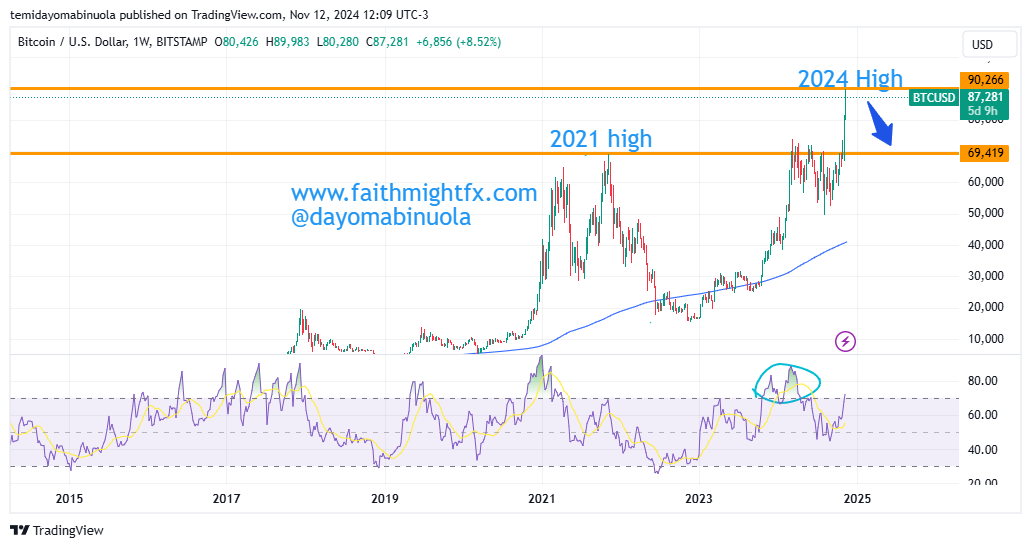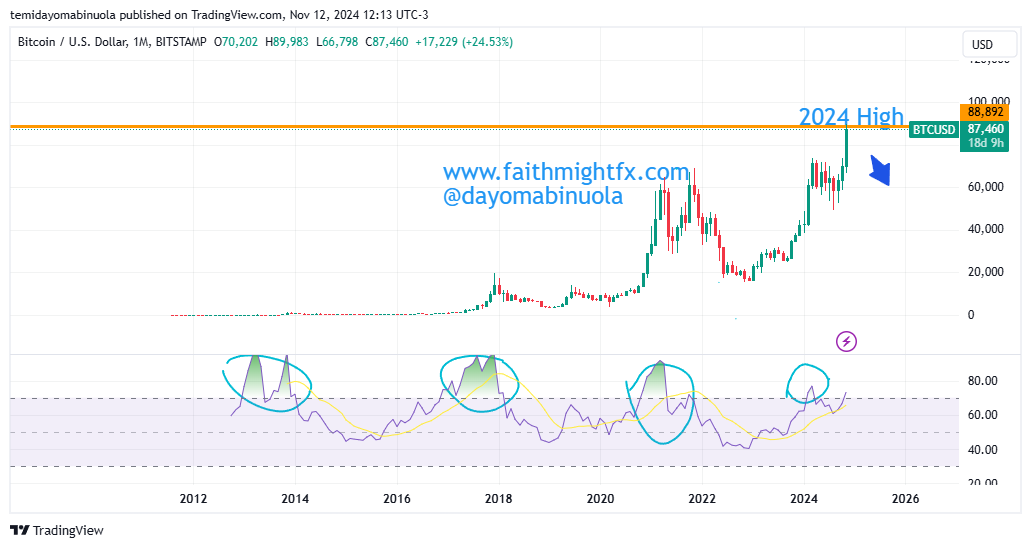
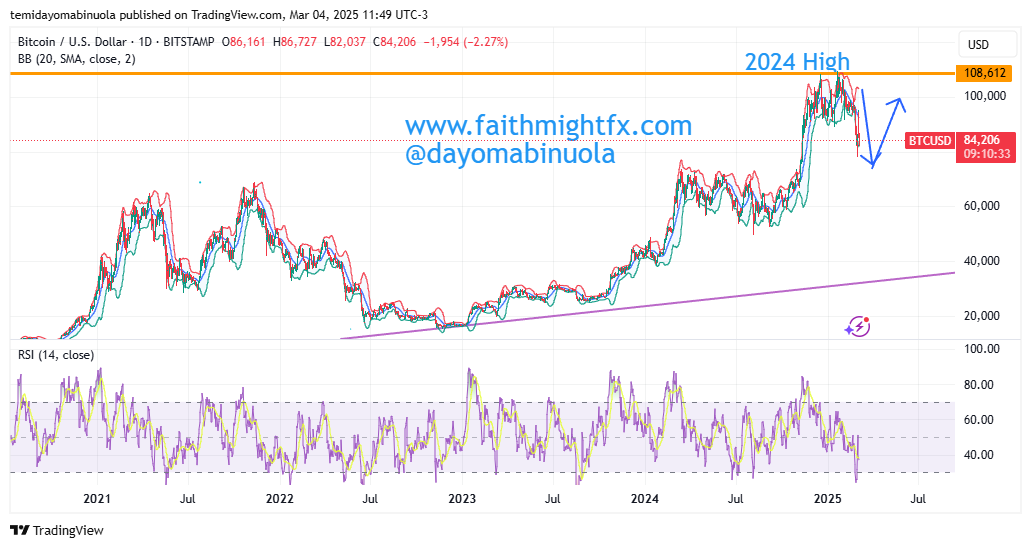
Following President Donald Trump’s announcement of a U.S. strategic cryptocurrency reserve that includes Bitcoin, Ether, XRP, Solana, and Cardano, Bitcoin’s price surged by 20% on Sunday. However, by Monday, it had declined nearly 9%, stabilizing around $86,000.
President Trump’s proposal to establish a national crypto reserve aims to position the U.S. as the “Crypto Capital of the World.” This initiative has faced criticism, particularly regarding the inclusion of smaller cryptocurrencies like XRP, Solana, and Cardano, which some argue dilutes Bitcoin’s prominence.
El Salvador’s President, Nayib Bukele, continues to advocate for Bitcoin adoption. The International Monetary Fund (IMF) has expressed concerns over El Salvador’s Bitcoin usage, citing high volatility and low public trust. Despite these challenges, Bukele added 19 Bitcoin to the country’s holdings, underscoring his commitment to the cryptocurrency.
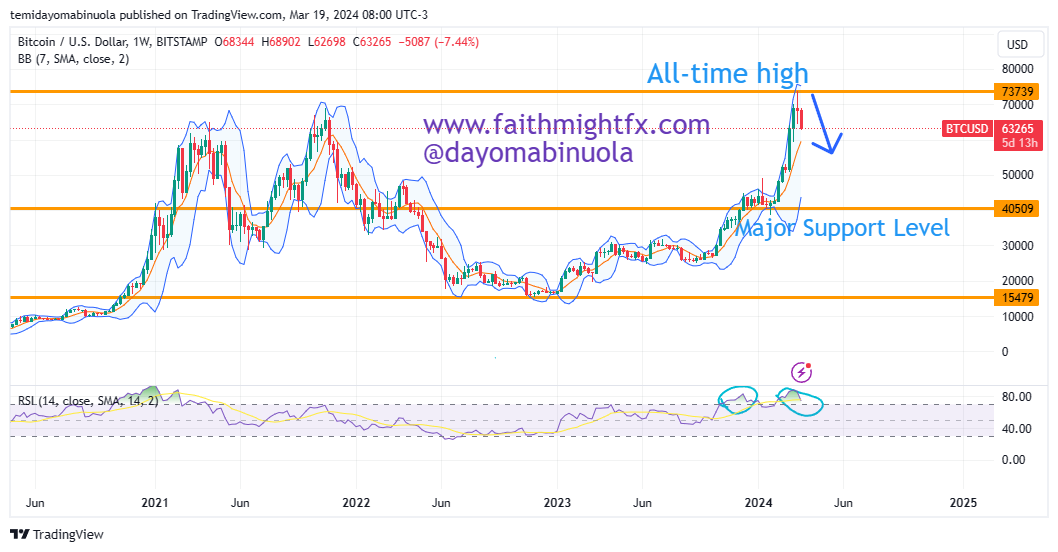
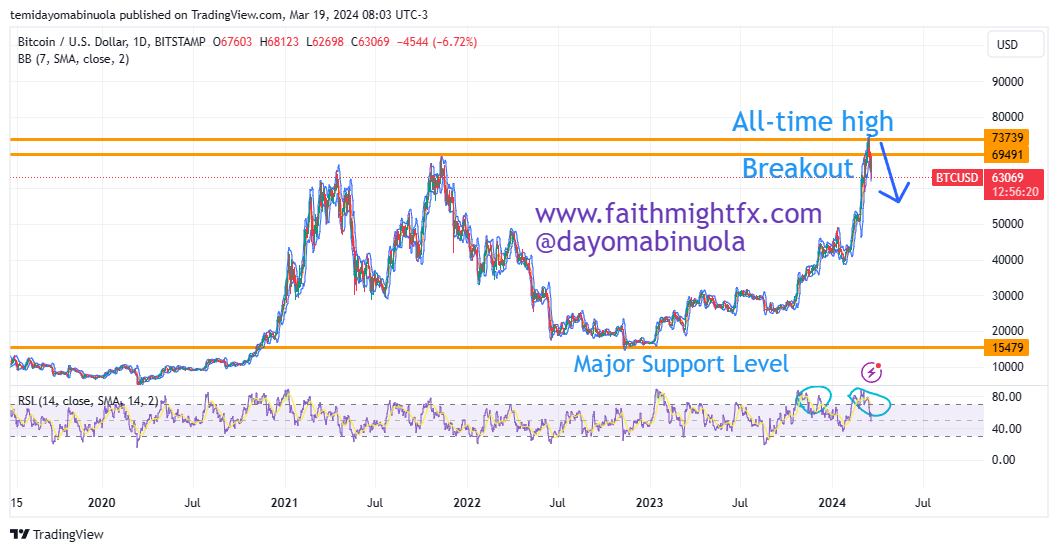
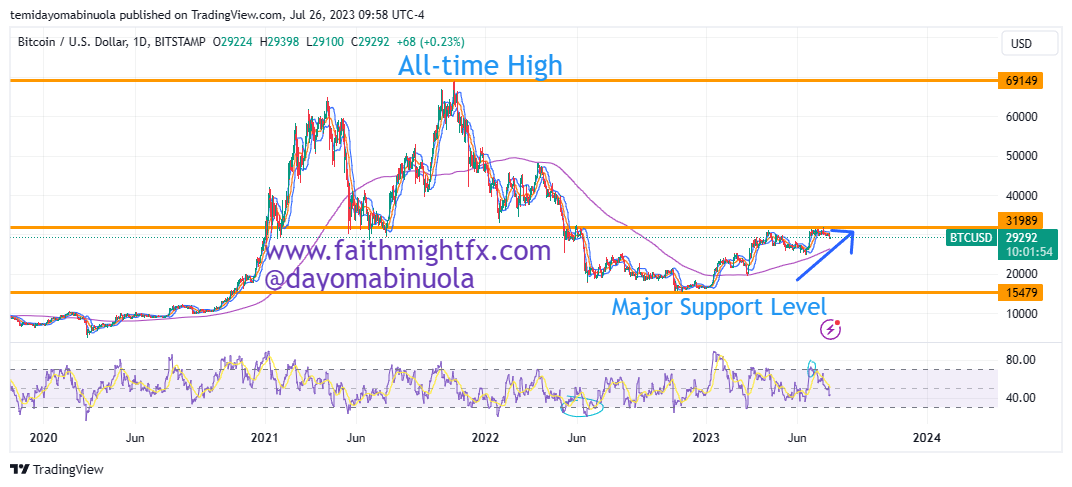
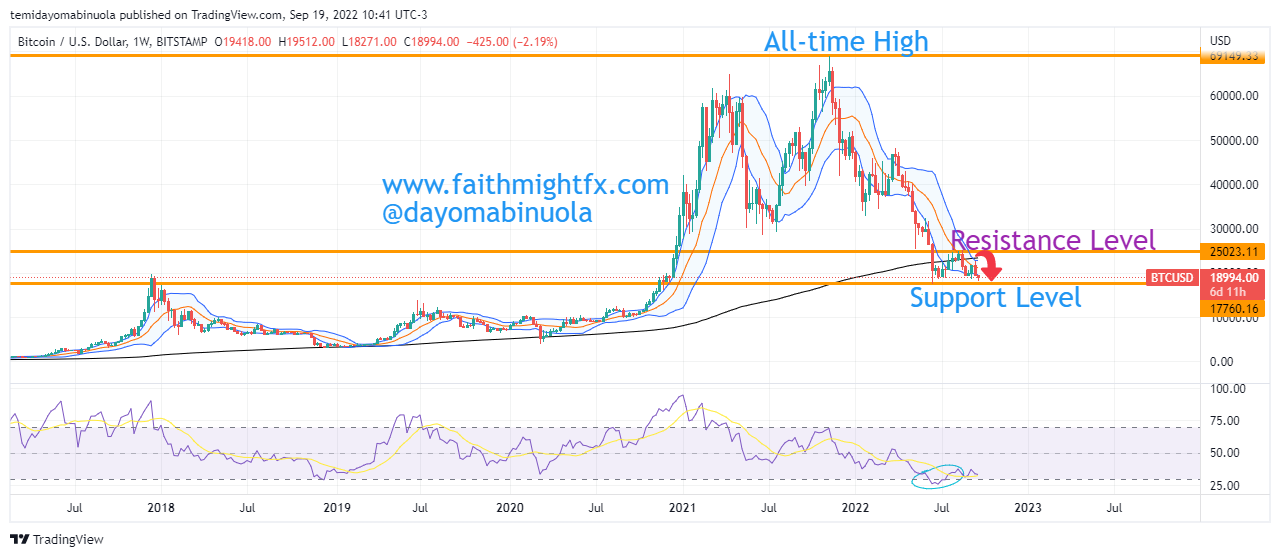
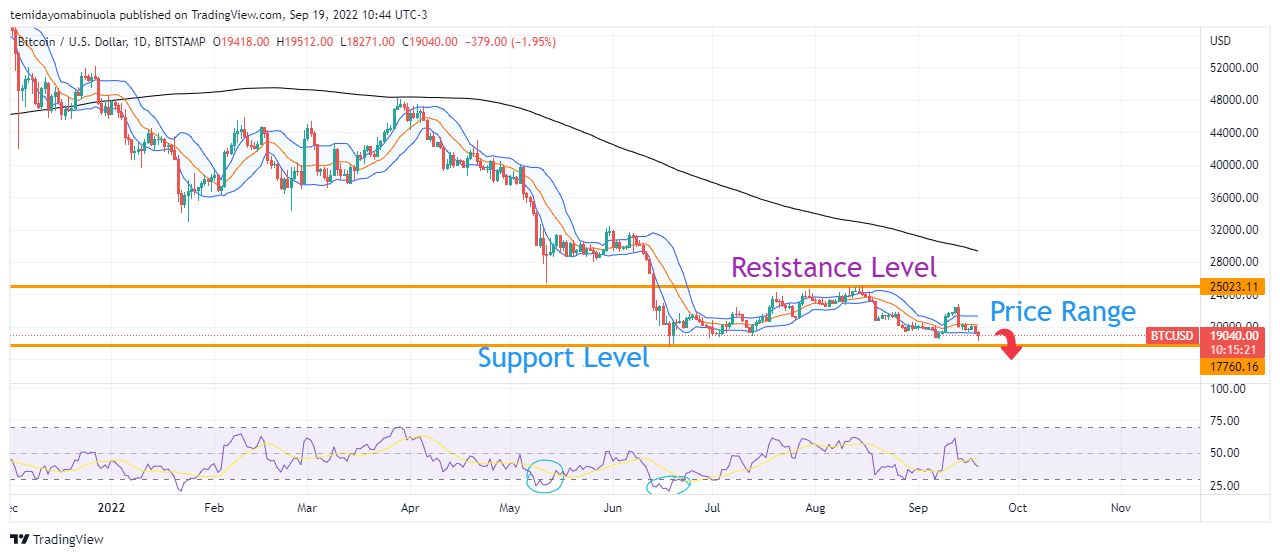
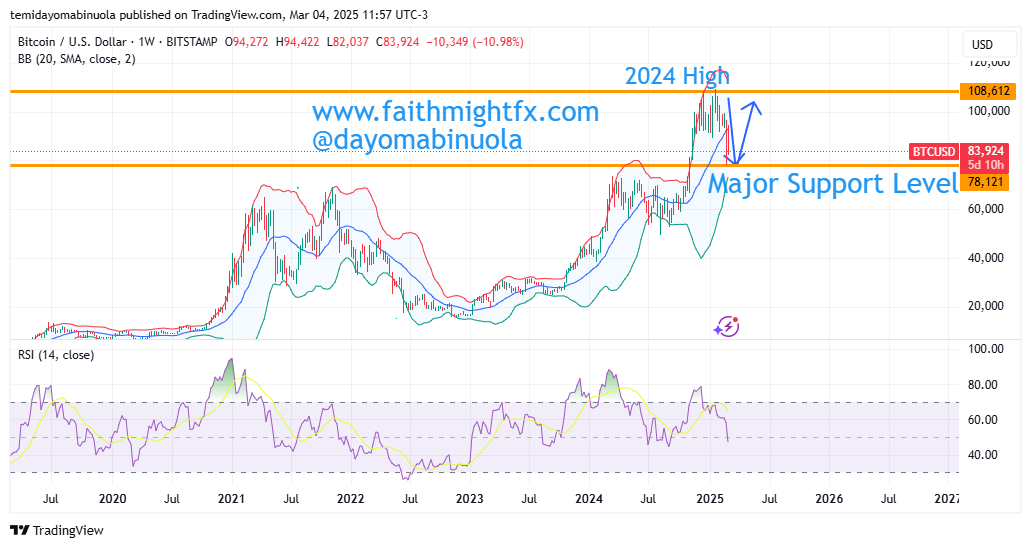
In the coming days, price might fall to $79, 000 from the current price at $82, 800. When price falls to $79,000, we could see price rise to $106,000 in the coming weeks.
Some of these ideas are in our clients’ portfolios. To understand if this one can work for you or for help to invest your own wealth, talk to our advisors at FM Capital Group. Would you like more information on how to get cryptocurrencies in your portfolio? Schedule a meeting with us here