fbpx

The Price of Gold Reaches An all-time high Before 2023 Ended

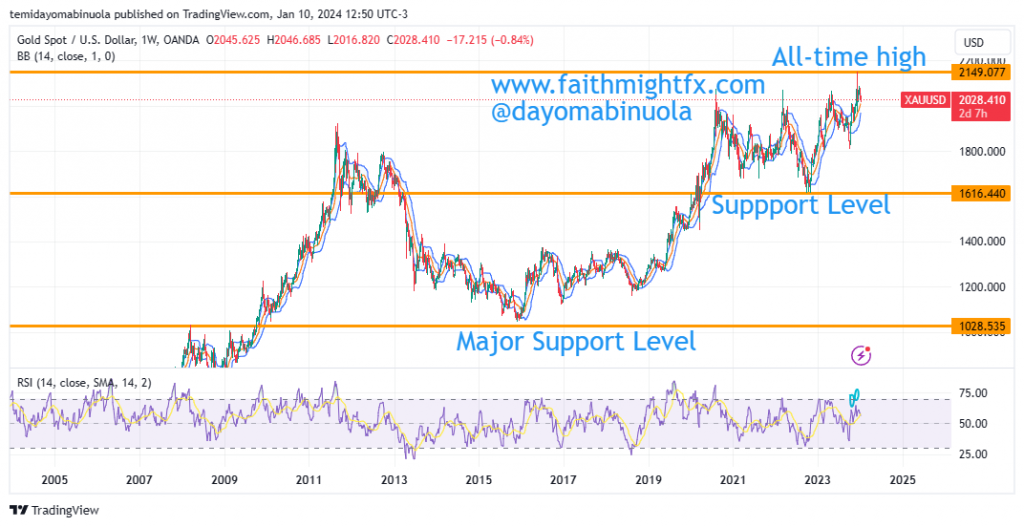
The highest price level gold has reached since the lockdown has been at $2076. The lowest price level was t $1620 between September 2022 and November 2022. The rally in December made the price of XAUUSD reach $2150. RSI on the daily chart shows price has been overbought at two different positions. The bulls were not able to maintain the rally as price has fallen to $2028 as of the time of this writing.
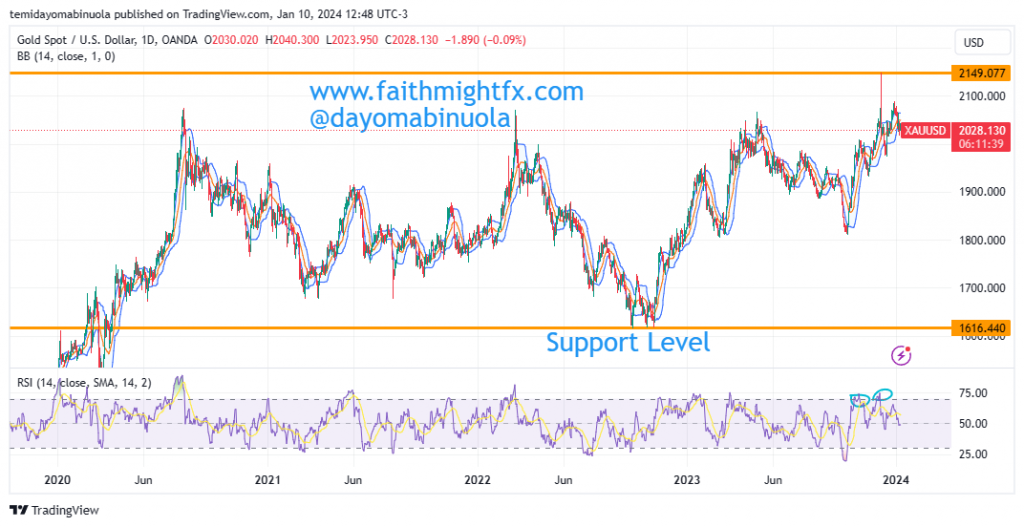
In the last one decade, the price of gold has rallied from the lowest point of $1051 in December 2015, to the highest point at $2150 in December 2023. As the bears are beginning to push price lower, we might see the price of gold reach $1848. Since the beginning of this year, the price of gold has been falling, which could be an indication of the bears taking full control of the commodity. The price on the daily chart has crossed to the lower region of the Bollinger bands.
Some of these ideas are in our clients’ portfolios. To understand if this one can work for you or for help to invest your own wealth, talk to our advisors at FM Capital Group. Would you like more information on how to get gold in your portfolio? Schedule a meeting with us here.

Gold’s Bears To Push Price Lower

Gold Bears to Push Price Lower

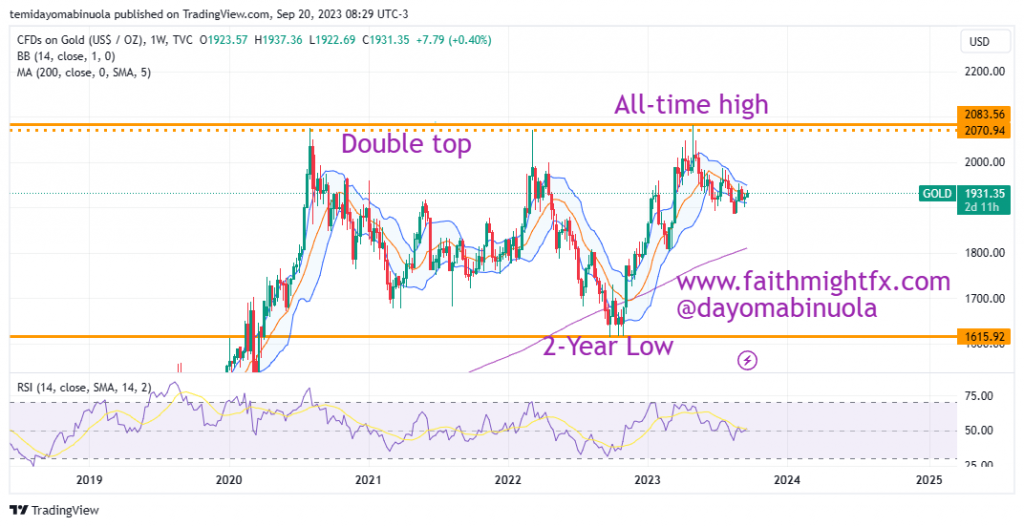
Gold experienced two highs between 2020 and 2022, which signifies a double-top on the monthly chart. This double-top was at $2069, one in August 2020 and the other in March 2022. A price drop to $1616 occurred after this double top. Between September and October 2022, the bears lost their momentum and the price of gold began a major rally in November 2022.

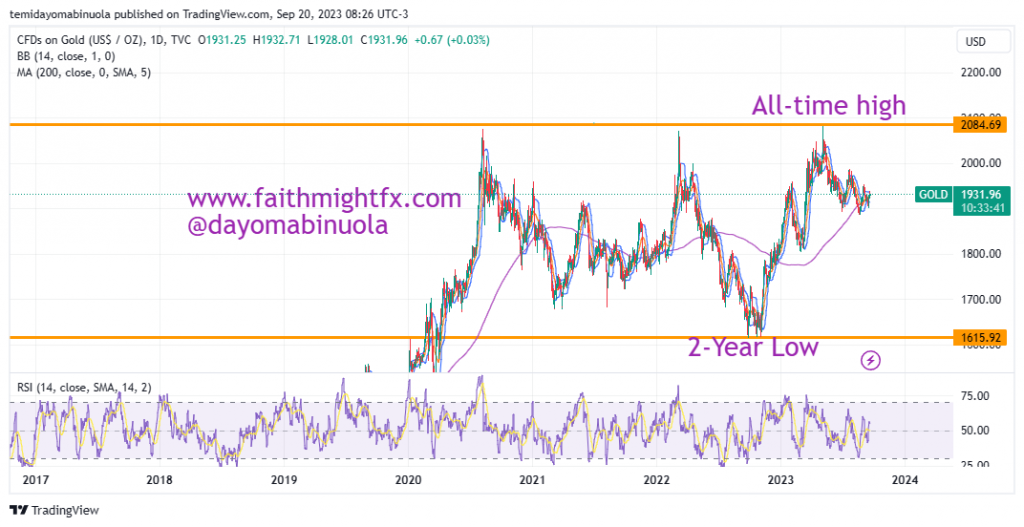
The rally that began in November 2022 made the price of gold reach an all-time high at $2082 in May 2023. Since the all-time high, the lower highs and lower lows pattern has been formed on the daily chart. The price of gold is currently at $1932, we might be seeing the price fall to $1914 in the coming weeks.

Some of these ideas are in our clients’ portfolios. To understand if this one can work for you or for help to invest your own wealth, talk to our advisors at FM Capital Group. Would you like more information on how to get commodities in your portfolio? Schedule a meeting with us here.

Crude Oil Price Locked In Range

WTI Oil Price Locked In Price

According to CNBC, the Russia-Ukraine war has remapped the world energy supplies, putting the United States at the top for years to come. This week new data from the U.S. government showed the U.S. exported a record 11.1 million barrels a day of oil and refined products. Not since the aftermath of World War II has the U.S. been so important as an energy exporter.

Daily Chart


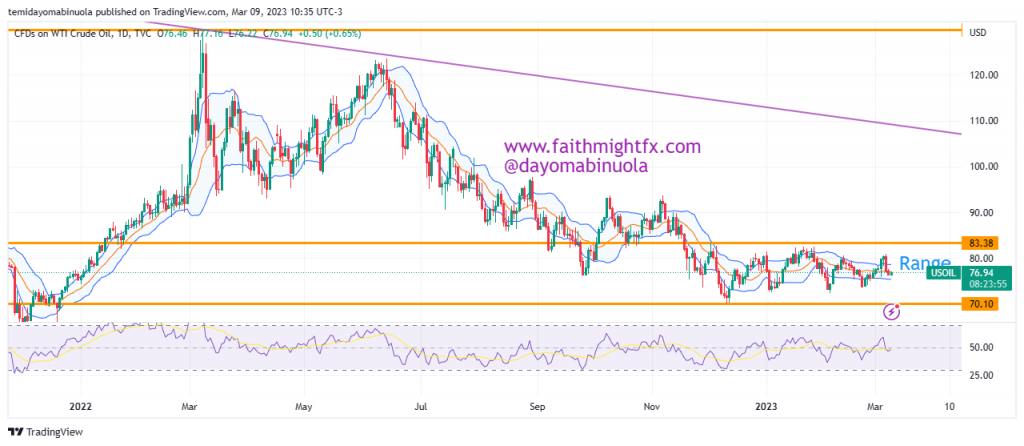
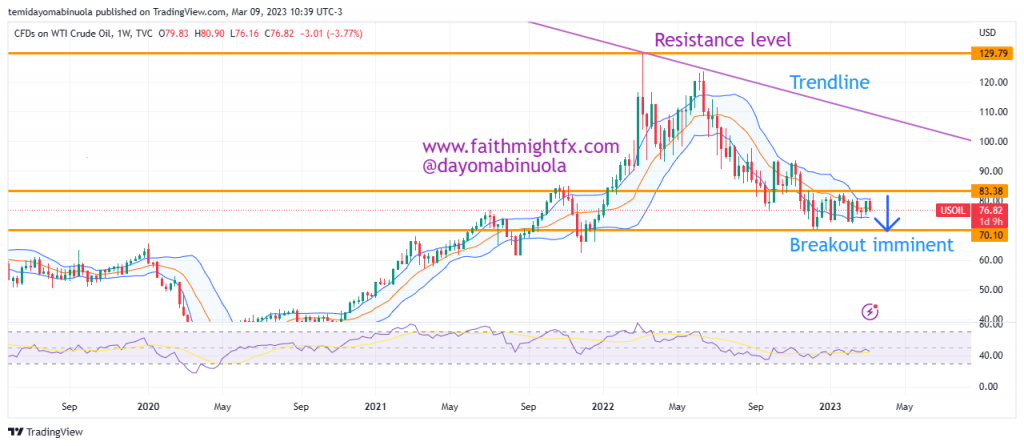
Since November 17, 2022 up until, the WTI price has been locked in a range between $70.10 and $83.10. A breakout might occur to the downside in the coming weeks as price could fall below $70. Since the beginning of 2021, RSI has indicated that price has been overbought five times on the weekly chart.

Weekly Chart

Some of these ideas are in our clients’ portfolios. To understand if this one can work for you or for help to invest your own wealth, talk to our advisors at FM Capital Group. Would you like more information on how to get commodities in your portfolio? Schedule a meeting with us here

Gold Price Reaches $1900 Since May 2022

Gold Reaches $1900 For The First Time Since May 2022

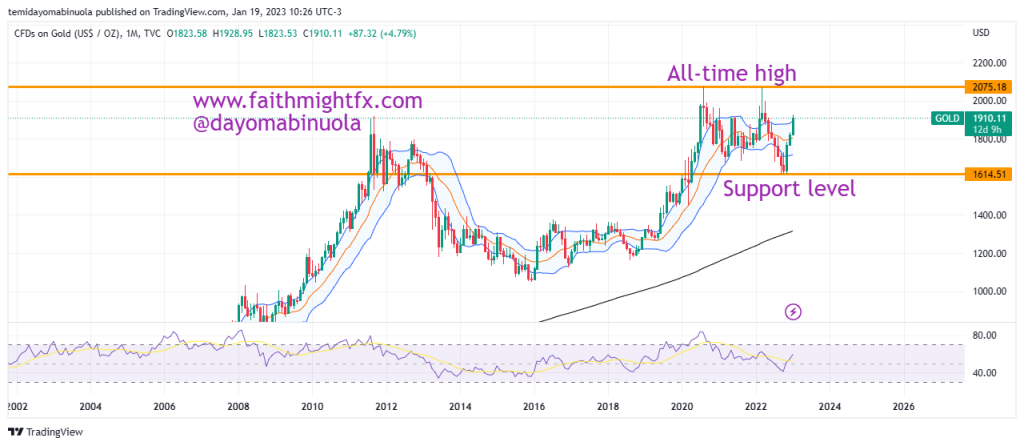
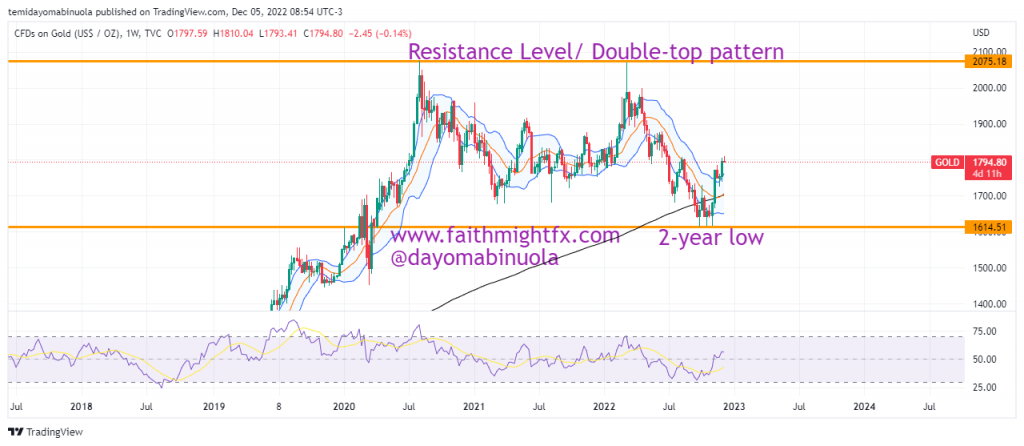
The price of Gold is beginning to appreciate after its price fell from the record high of $2075 per ounce in March 2022. From April 2022 to October 2022, all months closed bearish. The price of Gold reached $1614 in November 2022 which is the lowest price since April 2020. The $1614 price mark stands as the support level for that last 2 years. 

Monthly Chart

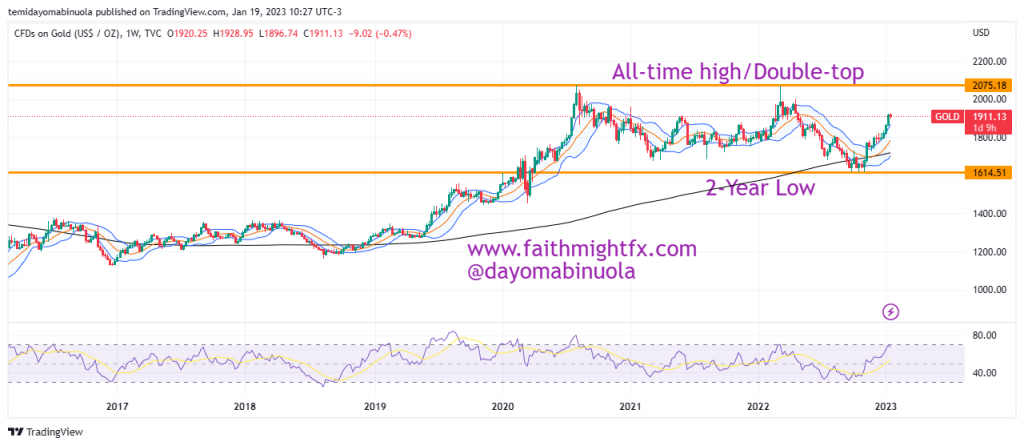
In November 2022, a bounce from the 2-year support of $1614 occurred as the bulls gained more strength. As a result of the rally that started in the last quarter of 2022, Gold’s price closed for the year 2022 at $1822. The rally continued into 2023 as the price reached a 2023 high at $1928 on the 16th of January.

Weekly Chart

The rally could continue in the coming weeks as the resistance level at $2075 might be broken to the upside, which could eventually make Gold’s reach an all-time high. 

Some of these ideas are in our clients’ portfolios. To understand if this one can work for you or for help to invest your own wealth, talk to our advisors at FM Capital Group. Would you like more information on how to get commodities in your portfolio? Schedule a meeting with us here

Gold Reclaims $1800 Psychological Level

Gold reclaims $1800 psychological level

The opening price of Gold in 2022 was $1828.01. Despite the rally in January, the month ended on a bearish note at $1796. February and March were much more bullish as price hit $2070 which was last reached in August 2020.

Weekly Chart

The bears took control as Q2 began and from April to October, all monthly candlesticks closed bearish. This bearish run made price hit $1616 which stands as the support level for the last two years i.e. 2021 and 2022.

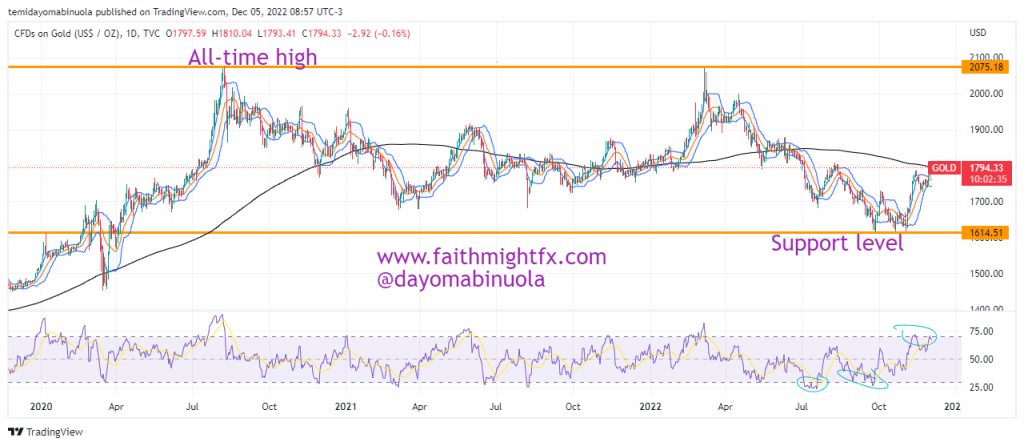
Analyzing November and the first few days of this month, there seems to be some hope for Gold. In November, price bounced from the year’s support of $1616 as November closed at $1768. This bullish run has continued as price touched $1800 on December 1, 2022. 

Daily Chart

Currently, price has reached a new month’s high at $1809. Our analysts do not see the bears taking over and that means by December 31, 2022, the price of Gold should still be above $1800 psychological level. RSI indicates on the daily time frame that price is overbought however, this might not translate to a price reversal soon.

Some of these ideas are in our clients’ portfolios. To understand if this one can work for you or for help to invest your own wealth, talk to our advisors at FM Capital Group. Would you like more information on how to get commodities in your portfolio? Schedule a meeting with us here

Gold Price Reaches A New 2022 Low

Gold opened in 2022 at $1830 per ounce and for the first part of the month, it was bullish. But then it changed direction and began to fall until it eventually closed on a bearish candlestick at $1796. As February 2022 began, the bulls got their groove back and were dominant for the next couple of weeks which caused February and March 2022 to both close with bullish candlesticks.

Weekly Chart

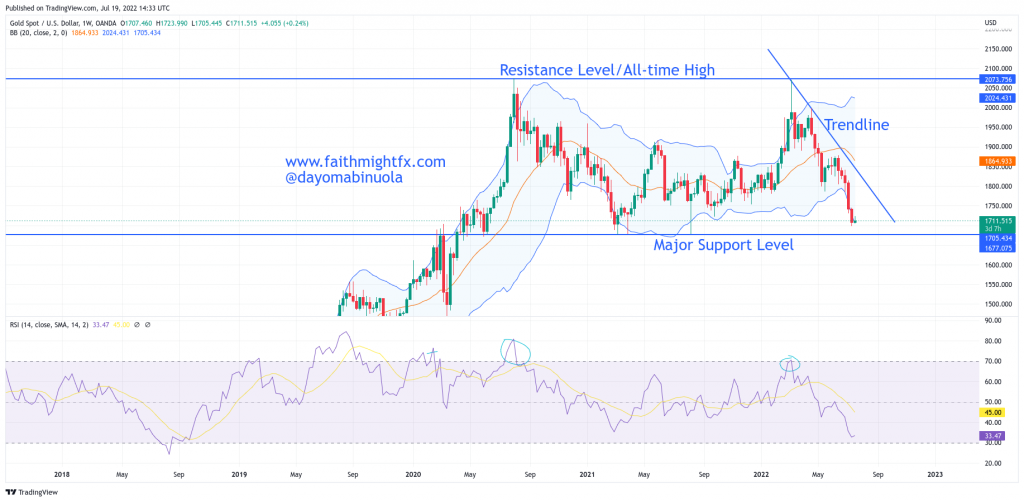
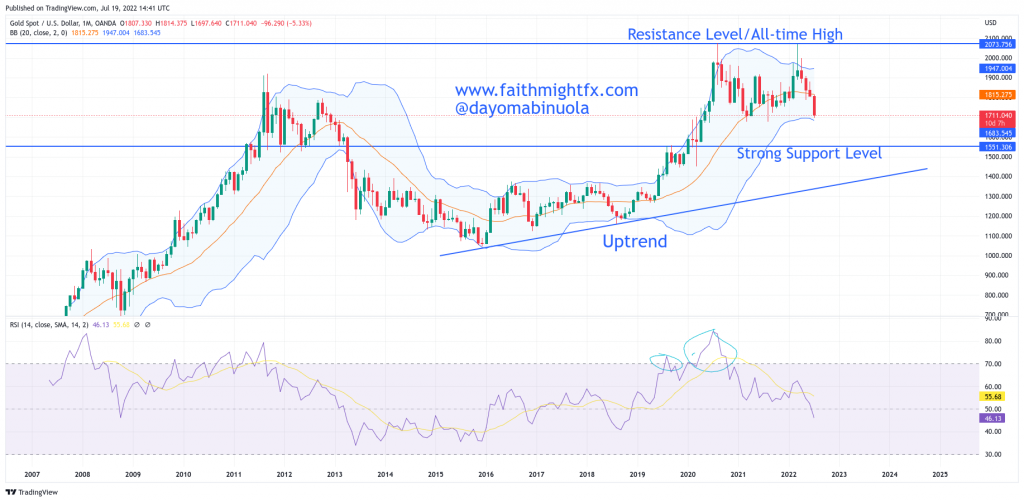
Gold price movements in 2021 was more of a range between $1907 and $1705 on the monthly time frame. The range was even more pronounced in the second half of 2021. The highest point Gold reached in 2021 was $1960. Looking at Gold this year, the highest point it has reached is $2067.

Monthly Chart

On the 23rd of February 2022, we forecasted that Gold may not be able to keep up the bullish rally (see article). We were correct on that call because since March 2022, Gold has been falling. On the bearish run, Gold’s price fell to $1699, which stands as the lowest point this year. In the publication referred to earlier, a support line was drawn at $1676 and our analysts believe that with the current bearish force on Gold, that support level could be broken to the downside.

Some of these ideas are in our clients’ portfolios. To understand if this one can work for you or for help to invest your own wealth, talk to our advisors at FM Capital Group. Would you like more information on how to get commodities in your portfolio? Schedule a meeting with us here