fbpx

Tesla’s Share Price Might Fall Below $200

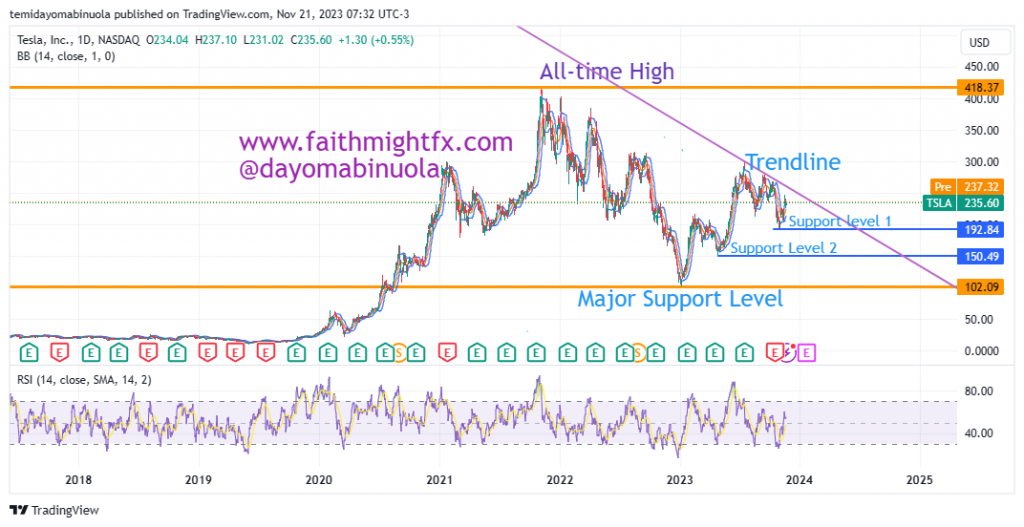
The American company that manufactures and sells electric cars, as well as power storage and photovoltaic systems, Tesla Inc., is currently ranked the 9th biggest company in the world by market capitalization. The current market capitalization as of yesterday, November 20 2023, was $748.95billion. In the last one year, the value of Tesla has risen by 40.35% with the current share price at $235.60. It has been a bullish year for the $TSLA stock. From the year of IPO when the price of Tesla was $1.09 to the current price at $235.60, it has been a profitable deal for investors.
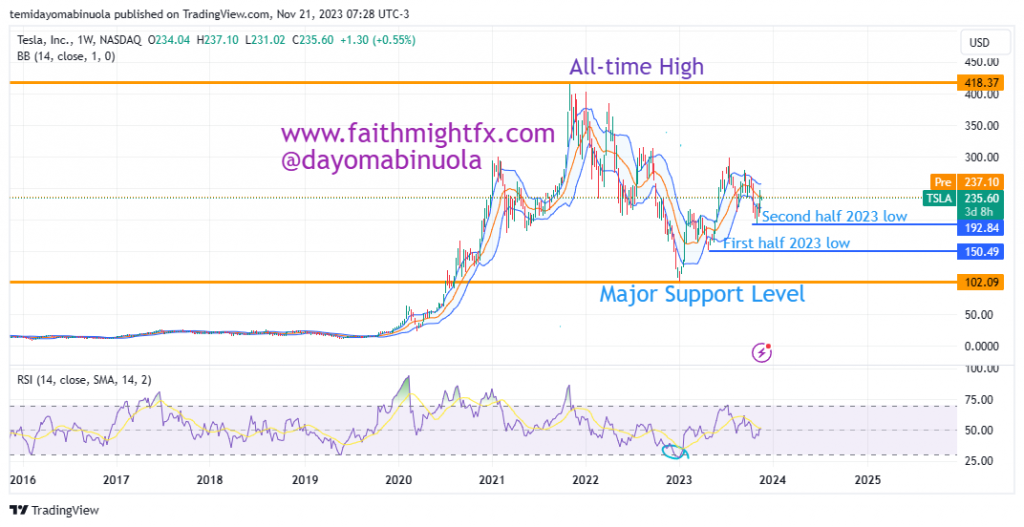
The adoption rate of electric cars in the world has increased over the past few years as it is receiving widespread acceptance across many nations. This month of November, the value of $TSLA has increased by 17.31%, as price has rallied from the month’s low of $197.85. Price of $TSLA is currently below the trendline as we might see price fall in the coming days. On the 4hr timeframe, RSI has indicated that the price of Tesla might fall soon. The next fall might see the price of $TSLA fall below the psychological level of $200.
Some of these ideas are in our clients’ portfolios. To understand if this one can work for you or for help to invest your own wealth, talk to our advisors at FM Capital Group. Would you like more information on how to get companies in your portfolio? Schedule a meeting with us here.

Tesla’s Share Price Dips to Previous Month’s Low

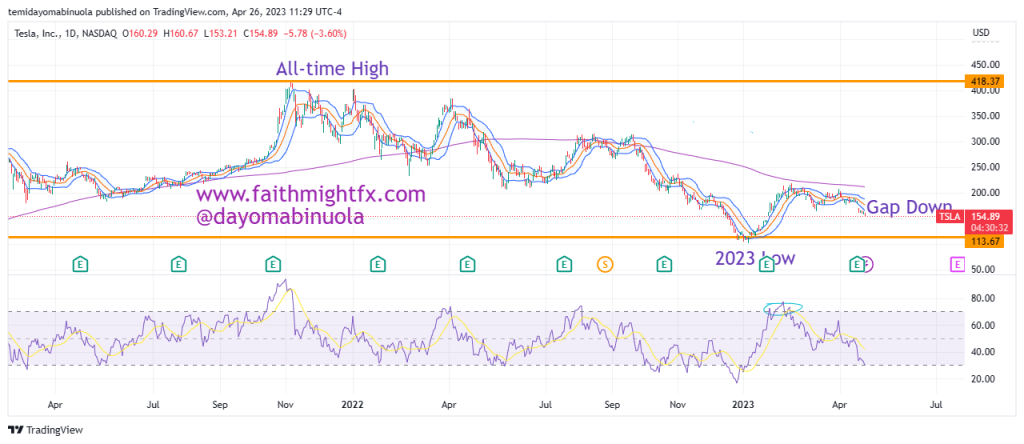
From the all-time of Tesla in November 2021 at $418 per share, the $TSLA share price has been falling in value. All investments made at the beginning of 2022 ended in negative figures due to the one year plus bearish trend. Despite the bearish trend in the market, Tesla made a revenue of US$81.46billion in 2022.

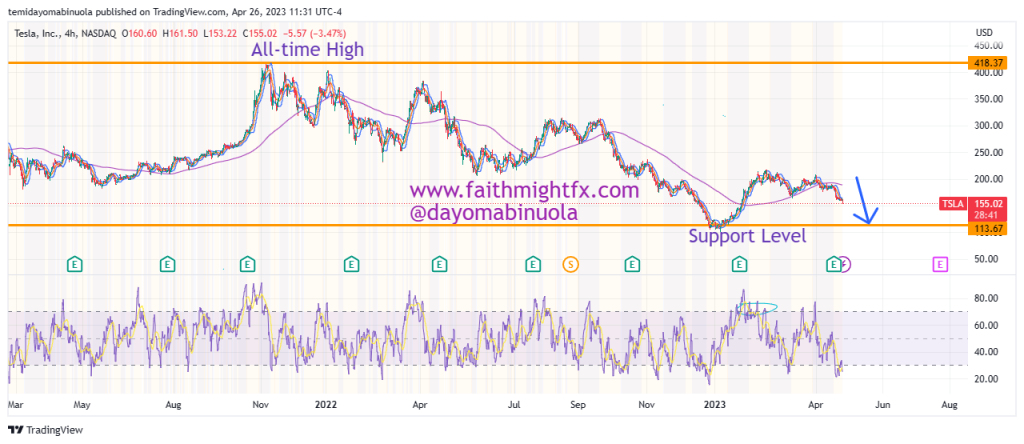
Despite the bearish trend of 2022, price of $TSLA was beginning to rally in 2023. with the price bouncing from the 2022 support level of $101 to the 2023 high of $218. In recent weeks the bears have pushed price to $155 and this could continue for some time.

On Thursday the 20th of April, 2023, the tesla share price opened with a gap down at $166. The lowest in the previous month was $164. The price on that Thursday closed at $163.04, a little bit lower that the March 2023 lowest price. Since the gap down, the bulls have failed to make a turnaround in the price as the price keeps falling.

ON the 4hr chart, RSI showed that price had been overbought at two different times in March and currently shows that price has been oversold once in April. We might be falling to $113 in the coming weeks.

Some of these ideas are in our clients’ portfolios. To understand if this one can work for you or for help to invest your own wealth, talk to our advisors at FM Capital Group. Would you like more information on how to get stocks in your portfolio? Schedule a meeting with us here

Tesla Reaches 2023 High

Tesla Reaches 2023 High

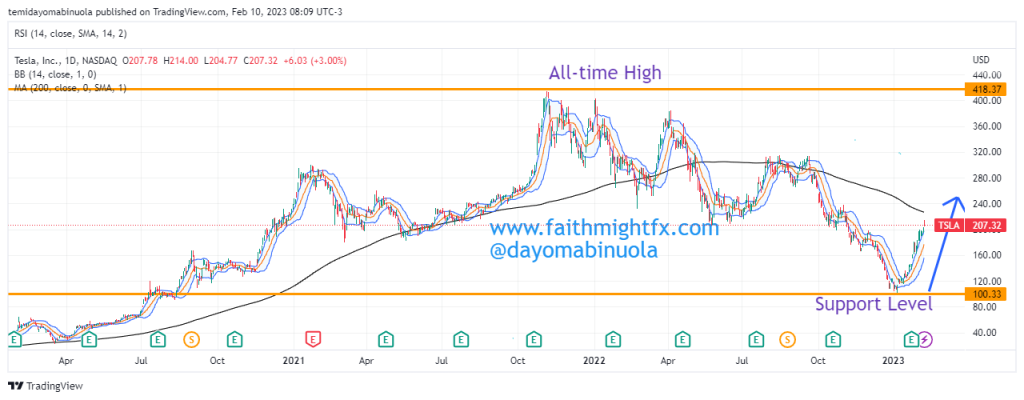
Tesla is an American multinational automotive, artificial intelligence and clean energy company.  As of February 2023, Tesla is one of the most valuable companies in the world, 7th position to be precise. The market cap of Tesla stands at $655.98 Billion. The opening price of Tesla in 2022 was $382.76, but the year wasn’t favorable to investors as the share price closed at $123.51 at the end of 2022 which was a 68% loss in value.

Daily Chart

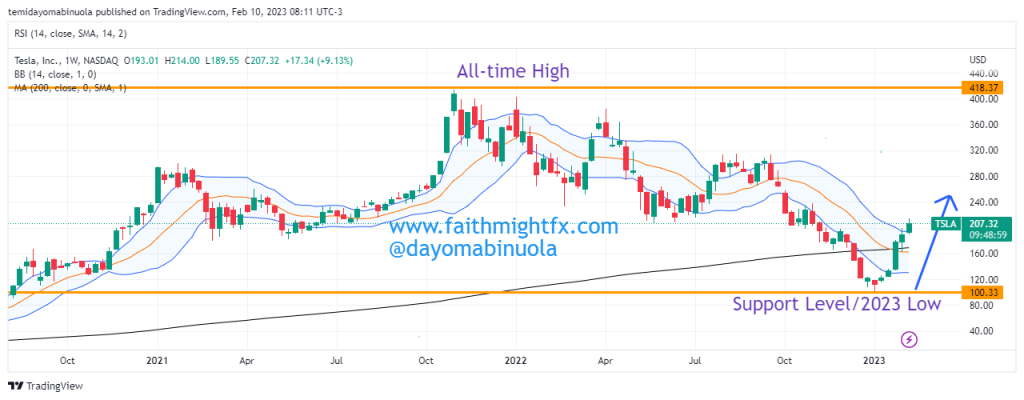
2023 opened for Tesla at $118. On the first trading day of the year, price fell to $102.70. The last time price fell to this point was in August 2020. $102.70 currently stands as the support level for the year and also a 3-year low.  On the 9th of January, a bounce from this support level started and Tesla’s share price has since hit the $200 psychological level and surpassed it. $TSLA is currently at $196. Our analysts think price could continue to rally for the next few weeks as price could reach $300.

Weekly Chart

Some of these ideas are in our clients’ portfolios. To understand if this one can work for you or for help to invest your own wealth, talk to our advisors at FM Capital Group. Would you like more information on how to get stocks in your portfolio? Schedule a meeting with us here

Tesla Splits Stock For The Second Time In 2 years

Tesla split stock for the second time in 2 years

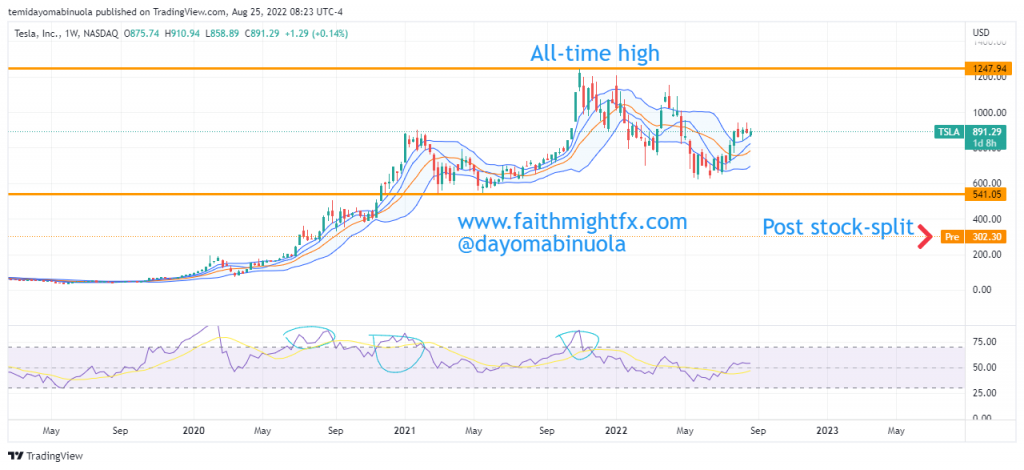
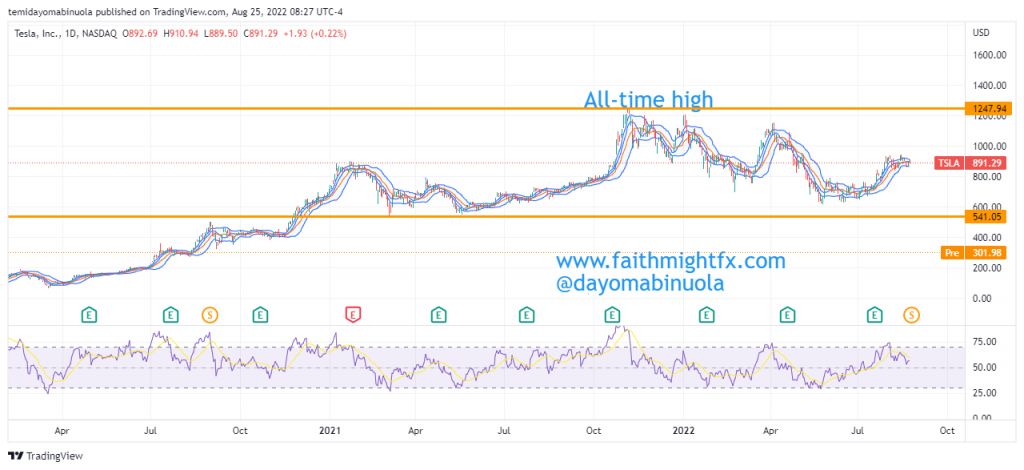
For the second time in two years, Musk’s Tesla has split its stocks. The stock is to split by 3 for 1 and was to take effect at the close of yesterday’s trading day, 24th of August, 2022. Due to the split, the share price of Tesla closed at $302 per share.

Weekly Chart

On the 19th of May 2022, we published an article where we made a forecast that Tesla’s share price will fall to $600. As of the time of publishing the article, Tesla’s share price was $709. Immediately after our forecast, Tesla’s share price dropped to $620 after which it began to rally. We are correct to say that our forecast reached its mark only that this 3:1 split has disrupted the price as Tesla is now trading at $300 per share.

Daily Chart

According to our analysis, following this stock split, Tesla’s share price might range around $300 psychological level for the next few months. This means that we don’t see Tesla’s share price reaching $400 this year.

Some of these ideas are in our clients’ portfolios. To understand if this one can work for you or for help to invest your own wealth, talk to our advisors at FM Capital Group. Would you like more information on how to get stocks in your portfolio? Schedule a meeting with us here

Tesla Share Price Continues To Fall

Since April 2020, the charts on Tesla have been bullish. This upward trend occurred in spite of the pandemic that crashed many stocks. The price at the beginning of the bull run in April 2020 was $100 per share after the stock split. (Please note that all prices are quoted since the stock split in August 2020). This continued until the end of the year despite little corrections in between. The $TSLA price soared on this bullish energy to an all-time high of $1,245 in November 2021.

Daily Chart

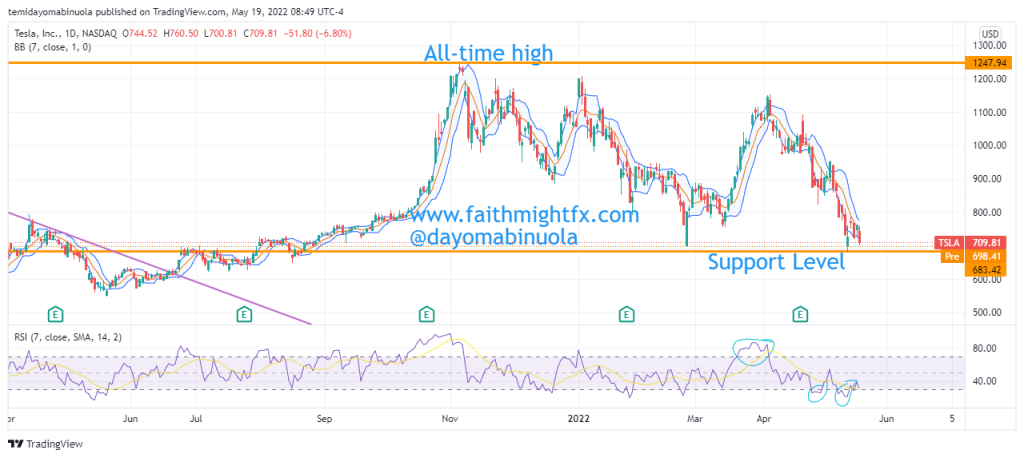
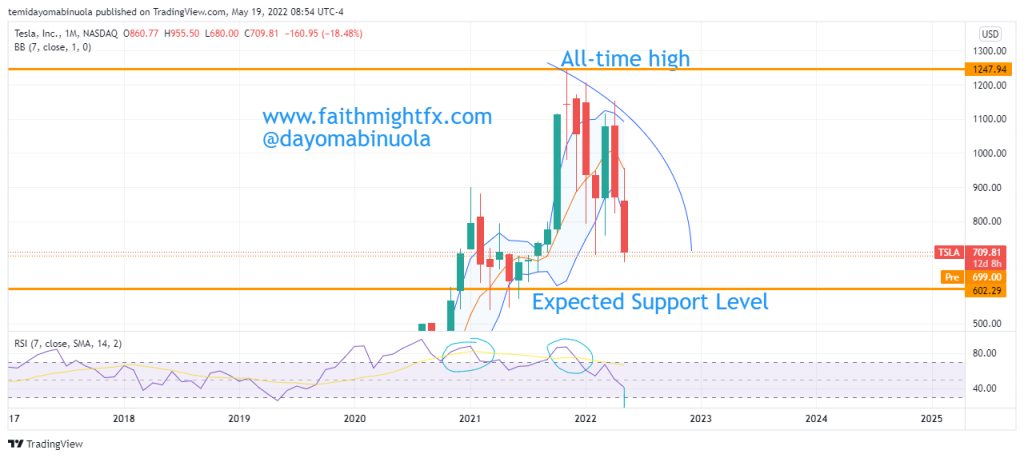
There has been a huge correction since the all-time high in November 2021 as price has been falling. This bearish run saw a little bullish movement which occurred in March 2022 with the price experiencing a temporary rally. The bulls, however, were counteracted by the bears and the price continued its downward trend.  In Q4 2021, our analysts concluded that the share price of Tesla could go below $1000 after reaching a new high at $1092 in October 2021.

Tesla’s price is currently at $709.81 per share. The worst closing price on the monthly chart since May 2021 was $625. This bearish run might push the price down towards $600 per share. RSI has indicated that the price has been overbought on both the weekly and monthly charts since November 2021.

Monthly Chart

Some of these ideas are in our clients’ portfolios. To understand if this one can work for you or for help to invest your own wealth, talk to our advisors at FM Capital Group. Would you like more information on how to get stocks in your portfolio? Schedule a meeting with us here

Tesla Share Price Reaches An All-time High

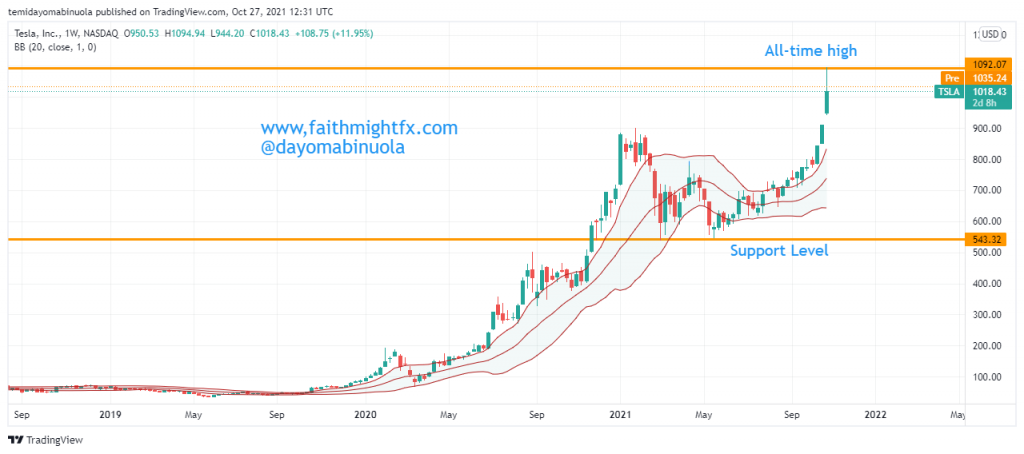
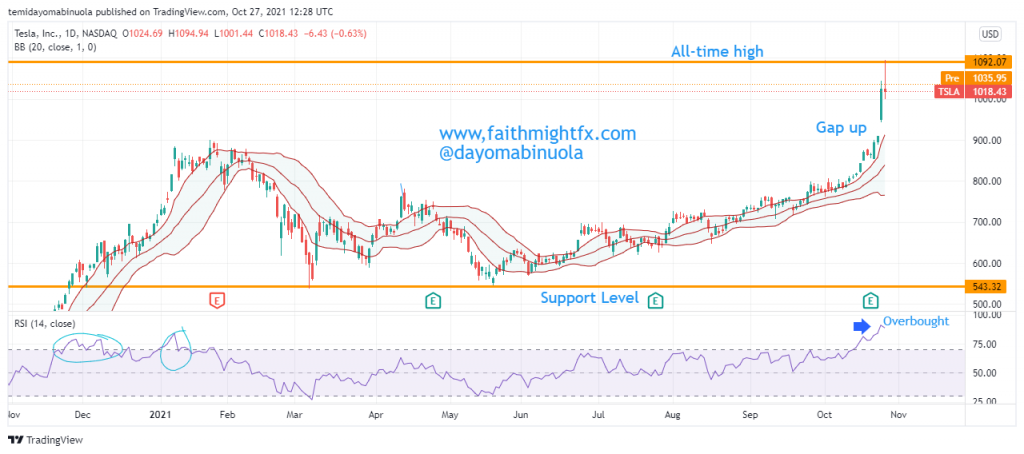
The American electric vehicle and clean energy company, Tesla surged to a $1 trillion valuation yesterday. The last two trading weeks have been bullish for $TSLA as the price broke the previous resistance level at $900 as the price closed at $910 on the week of the 22nd of October, 2021. The market opened this week, the 25th of October with a gap up at $946.71, then the price rallied $1092.07 which makes it an all-time after the last stock split that took place on August 31, 2020. The split was a 5 for 1, meaning for each share of TSLA owned pre-split, the shareholder now owned 5 shares.

Since March 2021, Tesla’s price has maintained a support level at $543.32 after the initial breakout to the upside in November 2020. Price retraced to touch the support level both in March and March 2021, before the most recent bullish movement to the all-time high.  On the weekly chart, there are a few gap-ups in the last few days, which indicates a possibility of a reversal of price below $1,000. Price has maintained the upper region of the Bollinger bands since the beginning of the second half of the year.

On the daily chart, the market closed yesterday with a Doji after reaching a new milestone. The price might reverse to close the gap ups, which might reduce the $TSLA share again below $1,000. Price has crossed to the overbought region of the RSI, this indication might lead to a reversal.

Tesla Trying Again for New All Time Highs

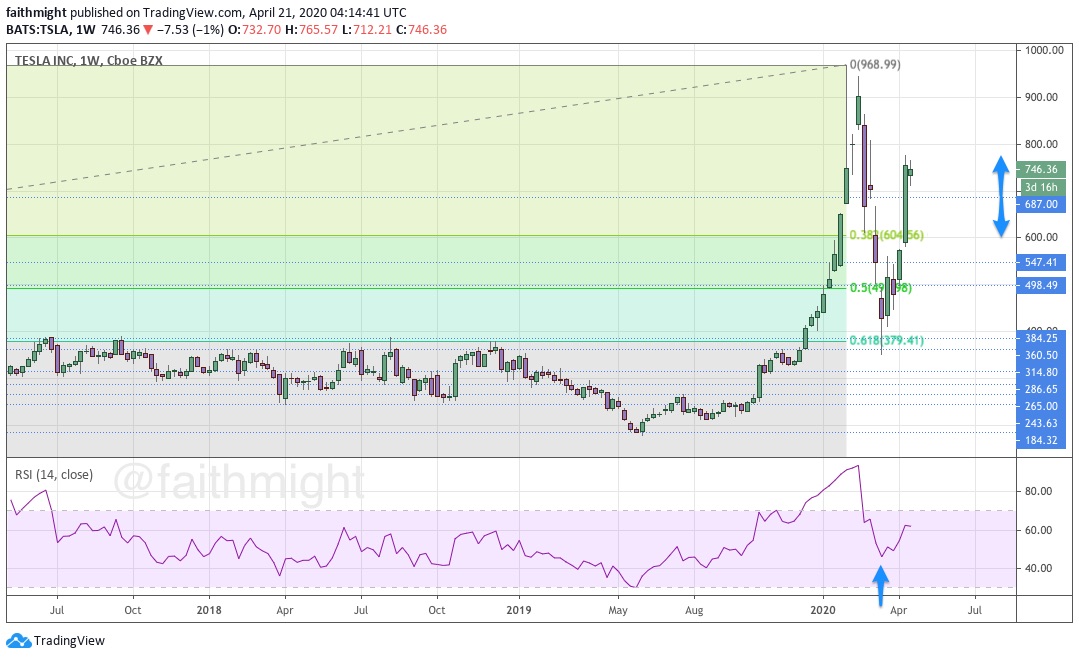
Back in January, Bay Street opened a new position in $TSLA at around $496 for its Lens of History fund. It had just made a new all-time high at the time. I didn’t like the price because I personally prefer to enter on a correction but making new all-time highs tends to be a rare exception to this rule. $TSLA went on to skyrocket to more all-time highs running all the way up to $968.99 in just 6 weeks.

TSLA WEEKLY CHART

Looking at the RSI, $TSLA was extremely overbought that entire 6-week run up. Then the coronavirus hit the United States and spooked U.S. equity markets sparking a selloff in everything. Not even $TSLA was not spared. But what is interesting is that while the correction in price was a very deep one, just past the 68.1% Fibonacci level, the correction in the RSI was not. Momentum never stayed bearish even in the midst of that vicious selloff in price.

Since finding a bottom at the support zone between $360.60-$384.25, price has rallied quite nicely signaling a move back to new highs. However, next week on the 29th, Tesla will be reporting first quarter earnings after the market close. We will be watching that report closely for future direction in price from here.


If you are interested in learning how I found these levels, please check out the CHARTS101 or CHART201 course. Read the charts for your Self so you can trade what you see and not what I think.