fbpx

Will Alibaba’s Share Price Continue To Rally?

Will Alibaba's share price continue to rally?

Alibaba had its IPO on the New York Stock Exchange at $94.11 in September 2014. After Alibaba’s share price reached its all-time high at $318.92 in October 2020, the share price began to slump and it reached a 2-year low at $58.26 in September 2022. The last time Alibaba’s share price got this low was in October 2015.

Weekly Chart

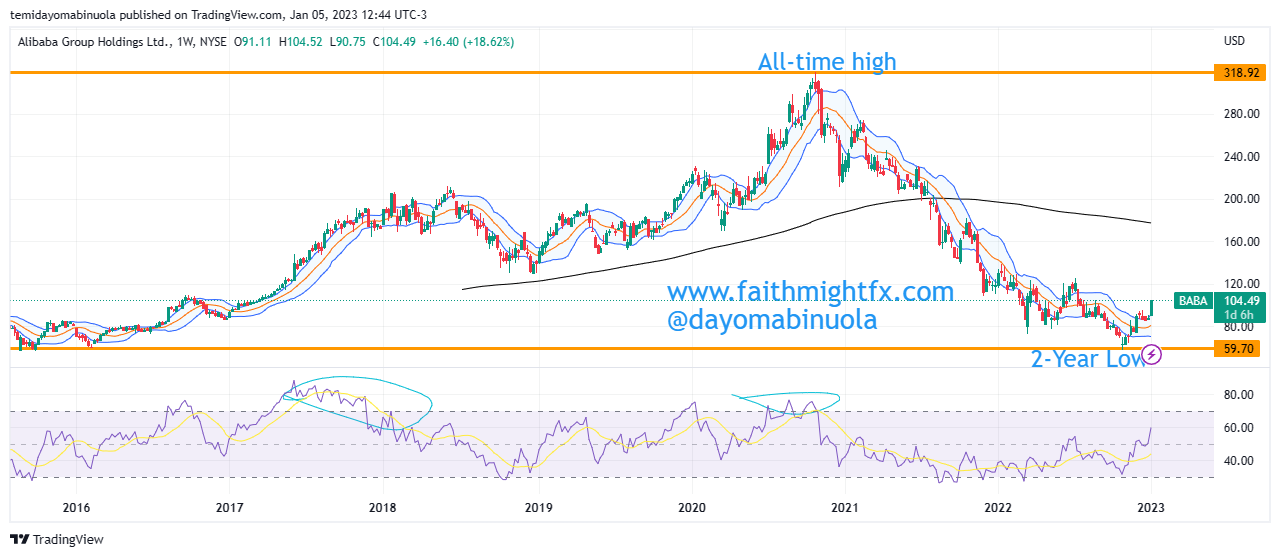
In November 2022, there was a bounce in share price from the support level. This bounce continued into the new year. The first few trading days of 2023 have been promising for Alibaba investors as price has rallied to $103.92 from the 2022 close of $88.45 which is about 17.4% appreciation in just two trading days.

Monthly Chart

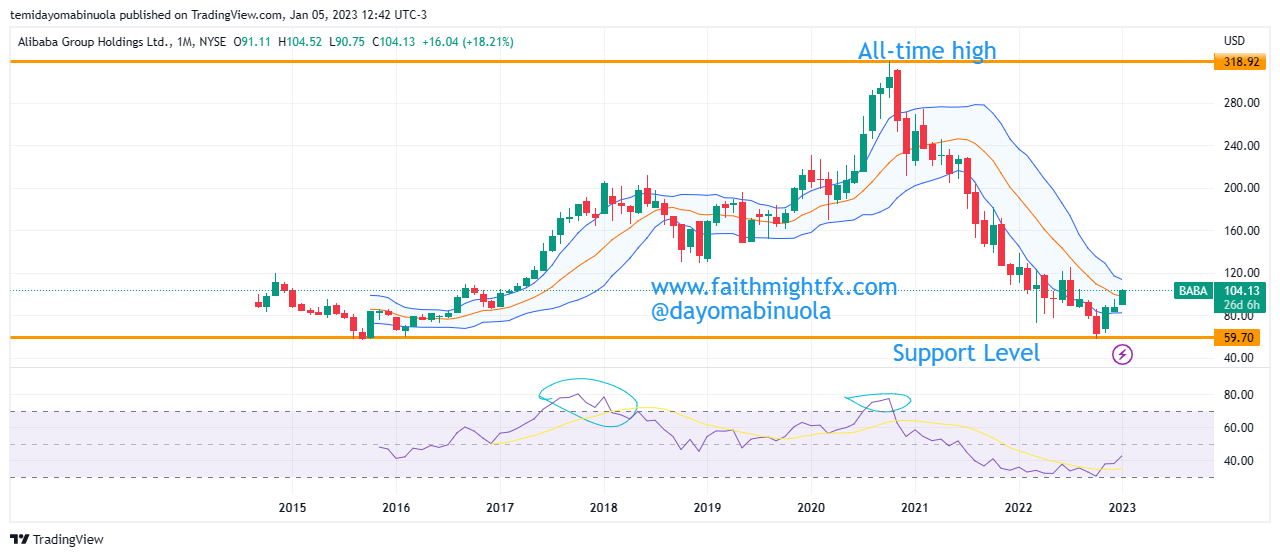
From a technical analysis standpoint, this rally could be a temporary one. Price may slump again in the coming weeks as bears are still in control. On the monthly chart, despite the bearish run for about two years, price is yet to be oversold which means price can still fall further. Our analysis shows that Alibaba’s share price might still fall back to the 2-year low at $58.26.

Some of these ideas are in our clients’ portfolios. To understand if this one can work for you or for help to invest your own wealth, talk to our advisors at FM Capital Group. Would you like more information on how to get stock your portfolio? Schedule a meeting with us here

Western Union Investors Are Having A Relief

The Western Union Company is a leader in cross-border, cross-currency money movement and payments. The share price of Western Union nosedived from April 2021 at $26.55 to reach a new low at $15.67 since October 2014. Just like many other stocks, $WU share price fell from a price level at $28.44 to $17.44 during the lockdown in 2020. The ease of lockdown from 2020 to the year 2021 made the price rally reach $26.64, a few points from the 2020 resistance level at $28.44. All Western Union profits made in 2021 were lost as a result of the price dip to $15.67.

Weekly Chart

A bounce from the support level at $15.67 started at the end of 2021. The $WU market closed yesterday at $18.77, which is a 17% rally. Whether price continues to rally or continue the fall is a major concern for the $WU investors. Since the price rallied above $15.67 in the year 2013, which is now the support level, the price is yet to close below it. Towards the end of last year, Western Union announced Devin B. McGranahan as the new Chief Executive Officer after Hikmet Ersek announces retirement at the end of 2021. The new CEO was able to appoint the new Board of Directors. Investors are hopeful that the appointment of the new CEO will bring about growth in the company’s share price.

Daily Chart

The Weekly Chart shows price is oversold on the RSI but still maintains the lower region of the Bollinger bands. $WU has a loss of 19% from 2021’s opening price. Nevertheless, the share price of $WU has been ranging since the beginning of this year. The price might drop to $16.16 if issues around sanctions continue among the world powers, as payments may be delayed and the cost of international payments might be increased. Later in the year, the price could appreciate to $25.16.

Some of these ideas are in our clients’ portfolios. To understand which ones can work for you or for help to invest for your own wealth, talk to our advisors at FM Capital Group. Would you like more information on Investment Advisory, Portfolio Services, and VC? Schedule a meeting with us here.

Virgin Galactic’s Price Falls To IPO, Loses Big

Virgin Galactic is an American spaceflight company founded by the Billionaire, Richard Branson with its headquarter in California, USA and operates from New Mexico. The company is developing commercial spacecraft and aims to provide suborbital spaceflights to space tourists. It had its IPO in the NYSE in September 2017 with the price at $10.15. The price was stable till October 2019, when the price fell a bit to $6.98. This price correction led to a huge rally in price to the all-time high before the global lockdown at $42,64. During the lockdown, the price fell to $9.18 which was about an 80% loss in value, the price recovery moved the price to $63.25.

Daily Chart

On 11 July 2021, Branson and three other employees rode on a flight as passengers, making them the first to travel on his own ship into outer space (according to the NASA definition of outer space beginning at 50 miles above the Earth). Since this event, $SPCE has lost about 50% in value. The share price was expected to rally, but the price continued to fall since the first flight.

Weekly chart

Regular paid passenger service flights have been scheduled to begin this year 2022 after two more test flights have been completed. The share price has fallen from the all-time high at $62.50 to $10.14, which is approximately an 84% loss.  The current price is at $10.14  which is very close to the pandemic lowest price was at $9.05.  The share price might rally as $SPCE prepares passengers flights this year. The rally might reach $43.49, which is about 3X of the current price at $10.14. On the weekly chart, price is still at the lower region of the Bollinger bands and RSI gives no indication of the price being oversold. On the other hand, the Daily chart has multiple indications that the price has been oversold.

Some of these ideas are in our clients’ portfolios. To understand which ones can work for you or for help to invest for your own wealth, talk to our advisors at FM Capital Group. Would you like more information on Investment Advisory, Portfolio Services, and VC? Schedule a meeting with us here.

Opendoor Is About To Open A Bullish Door For Investors

Opendoor Technologies Inc is an online company for transacting in residential real estate headquartered in San Francisco. Now, many real estate investments have done quite well since the lockdown. $OPEN’s IPO price in June 2020 was at $10. Since the IPO, the price has been able to reach $40, which is 4x, before this year’s price drop to the support level at $13.60. The all-time high price of Opendoor is currently at $39.77, which was reached in February 2021. Hope might be rising for investors as the second half of the year has brought about a significant rally in the price of $OPEN from the support level at $13.60 to the most recent high at $25.45.

The candlesticks have crossed to the higher region of the Bollinger Bands on the weekly, which signals that this could be a continuation of a rally. But in the last 3 trading weeks, the price is yet to breakout of the second half of the resistance level at $25.24. This week looks like a bearish one for $OPEN investors, as almost all gains in the month of October have been lost in the last 4 trading days.

A range in price has been occurring since May 2021, when the share price fell close to the IPO price at $10. The price range is between $13.48 and $18.56. Price of $OPEN closed on Wednesday at $20.86. If more bulls invest in $OPEN, the price might reach a new resistance at $30.56. The 4hr chart shows price has been able to breakout to the downside with this week’s correction. It could be a fake breakout.

Apple Gaining Momentum For A Rise

The face-off between the $AAPL bears may soon come to an end due to trade wars. In September, we saw a future fall in $AAPL shares. The fall in price was about 4500points before finding a new support at 170.48. The fall between October and November made $AAPL to lose 78.89% of its gain made in 2018. The second half of the year has been full of volatility in the $AAPL shares price movement.

Price undoubtedly has been oversold on the RSI, showing that sellers have been relentless. But this may be a good time now for $AAPL bulls. Price has broken out of the trendlines, and might likely reach 210.60 from 178.19. Before the end of the year, about 3000points might be gained back out of the total points lost if more buyers become active. $AAPL has been considered one of the cheapest stocks now after the oversold position was reached. This might be the right time for investors to take a position in $AAPL.

Source: These 3 Value Stocks Are Absurdly Cheap Right Now.  (NASDAQ)

Exxon Mobil Finding A New Resistance

The Exxon Mobil shares in 2018 has been of low volatility with several higher lows and lower highs. Price of $XOM had initially broken support in February leading to a fall in price. The highest point of $XOM price in 2018 was at 89.32 which was in February; then the bearish movement made price to reach 72.71, the lowest level in the year. The highest rate of volatility of $XOM shares was in the first quarter of the year. Price action shows a long range in price from April to mid September. Both the bullish and bearish movement within the range period were between 700points. The second resistance level in the year, 87.51 was only reached once in September after a bullish movement broke out from the range.

In September, when the price of $XOM reached an overbought position on the RSI, a reversal began. This reversal gave rise to price breaking the support level at 81.88. Price has since then been in the lower region of the Bollinger band. Price tried to retest back to the middle Bollinger band line which also stands as the resistance level. Price of $XOM is currently at 78.45, showing a trace of a bullish movement from the last 3 trading days. A breakout of the resistance level 1 at 81.88 could lead to a continuous bullish movement which might eventually reach 87.51. Investors might decide to go long on the $XOM since price is around a major support level in the year.


General Electric Shares Might Begin A Bullish Trend

In 2018, General Electric has suffered a setback in its share price. The highest point $GE reached this year was at 19.27 in the first two weeks in January. Since then, the bears have secured about 1200points in the year. We previously analysed a fall in share price of $GE. It has since found a new support. The fall between October and November alone was at an average of 25.69% of the total fall in the year.


Taking a good look at the $GE daily chart, there is a breakout of price from the trendlines as price consolidates. RSI shows an oversold position. Ichimoku is yet to show a reversal from the bearish trend. As the year comes to an end, the bulls might want to resume active roles. In over two decades, $GE has maintained a support around 7.92. If the support level holds again, price might reach 11.23. A breakout of the resistance level above 11.23 might lead to a continuous uptrend.

IBM Bulls Are Being Pressurised

Price movement of IBM for the most part of 2018 has been ranging. A major downtrend began in September to the last week of October. In October, price of $IBM shares reached 114.05, the lowest level in the year. The last time priced reached this level 114.05 was in May 2010. The highest level $IBM stock reached this year was in January at 170.25 level. Since then, RSI has never been overbought like it did in January. Since the beginning of November, the price has only moved from 115.58 to 124.98. This little bullish movement has given hope to the IBM bulls.


A new CEO will resume office in December 3. This was announced by Nielsen Holding Plc. The new CEO has been a member of IBM. Price is currently around 118.26 and might go upward to reach 129.27. RSI has shown an oversold position on the platform giving a signal for a possible buy. A breakout upward also occurred from the trendlines. All these indicators except the Ichimoku show that the bulls might take charge soon. As the year is coming to an end, and as the new CEO resumes office, share price might just maintain a bullish movement till the New Year. $IBM stock in 2018 has not been too favourable to the bulls but the latter part of the year might change the case.

Source: Nielsen Names IBMs David Kenny New CEO (MarketWatch)

FedEx Bears Take Over

The market value of $FDX showed a trace of reversal this week after maintaining a bullish movement for the past two weeks. Price touched the support level in the latter days of October since August 2017. Just like many stocks had a bearish turn in October, $FDX also had. The all-time high this year was in January when price was at 274.69. Price movement of $FDX in 2018 is between 274.69 and 208.02.


Since September, price has maintained the lower section of the Bollinger bands. Ichimoku shows the future is also on a downtrend. But RSI shows despite being on a downtrend, it is oversold, preparing for a bullish turn which temporarily occurred. A bearish breakout also occurred from the trendlines showing the continuation of the downtrend. News reaching me shows $FDX is about to raise ground and home delivery rates starting from January 7, 2019. The new shipping rate will increase by an average of 4.9%. Price is yet to cross over to the upper region of the Bollinger bands. Therefore, the bears are still in control of the $FDX stock.
Source: MarketWatch-(Fedex To Raise Ground, Home Delivery Shipping Rates Starting January 7)