fbpx

Apple, Microsoft Reach All-Time Highs

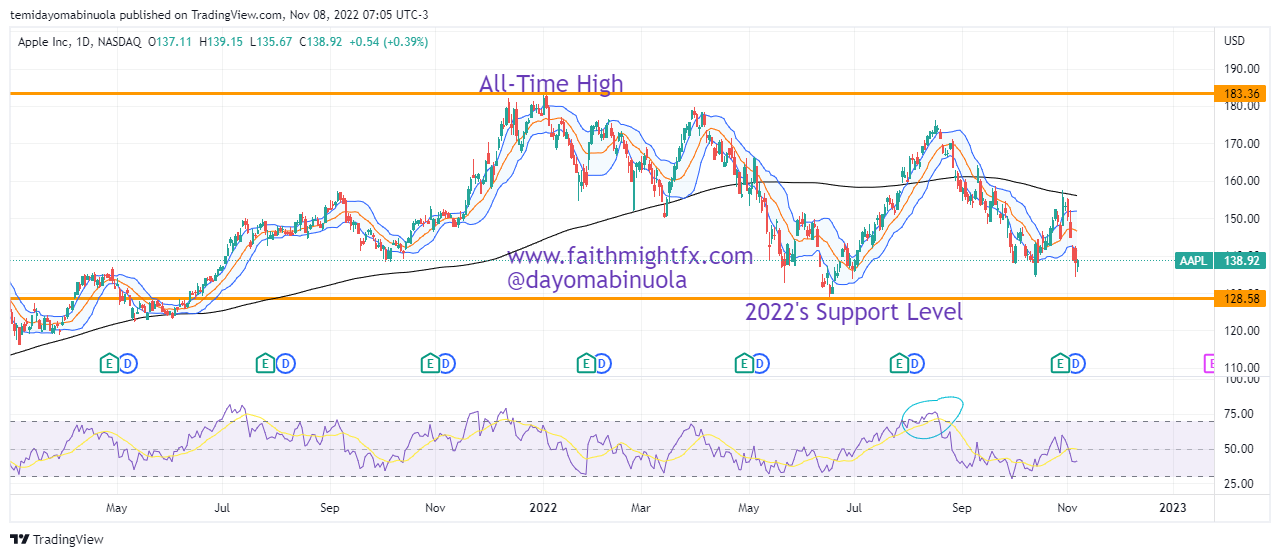
Apple is an American multinational technology company in the USA. Apple is the world’s largest company by revenue, with $383.93 billion in 2023. Microsoft on the other hand is also an American multinational technology corporation, with a revenue of $211.91 billion. These two companies are part of the Big five American information technology companies alongside Alphabet, Amazon and Meta Platforms.

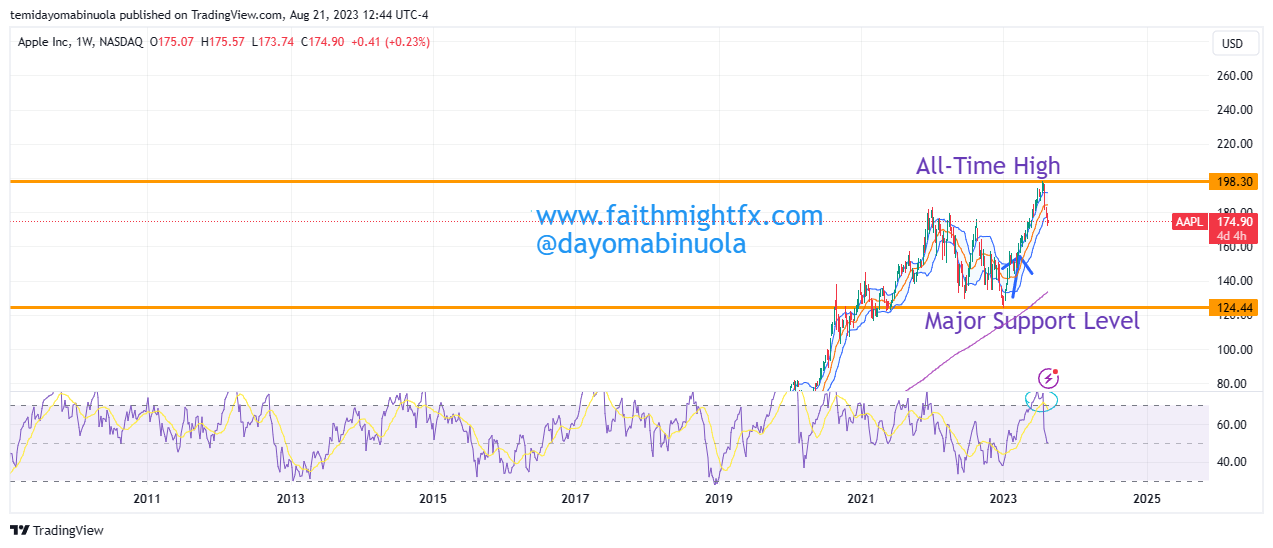
Based on market cap, Apple and Microsoft lead the companies globally with $2.738 Trillion and $2.366 Trillion respectively. The year 2022 was not a good year for Apple investors as price dipped to $124.44, from the highs of $174.44. The year 2023 has shown relief for investors after price jumped from the support level of 124.44. The rally this year has made the share price of Apple reach an all-time high of $198.50.

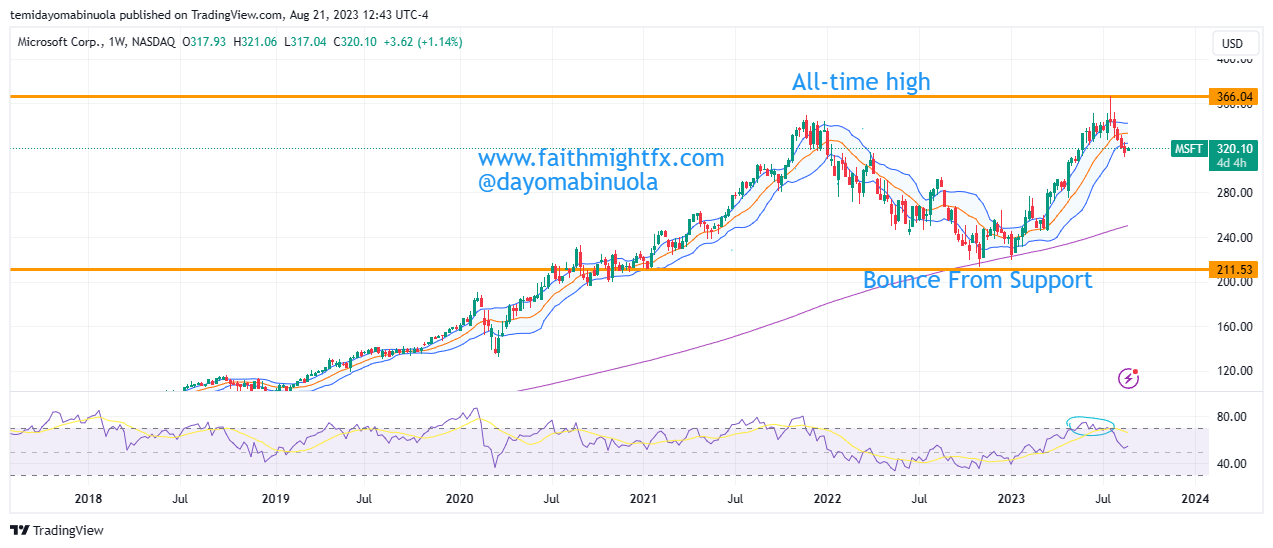
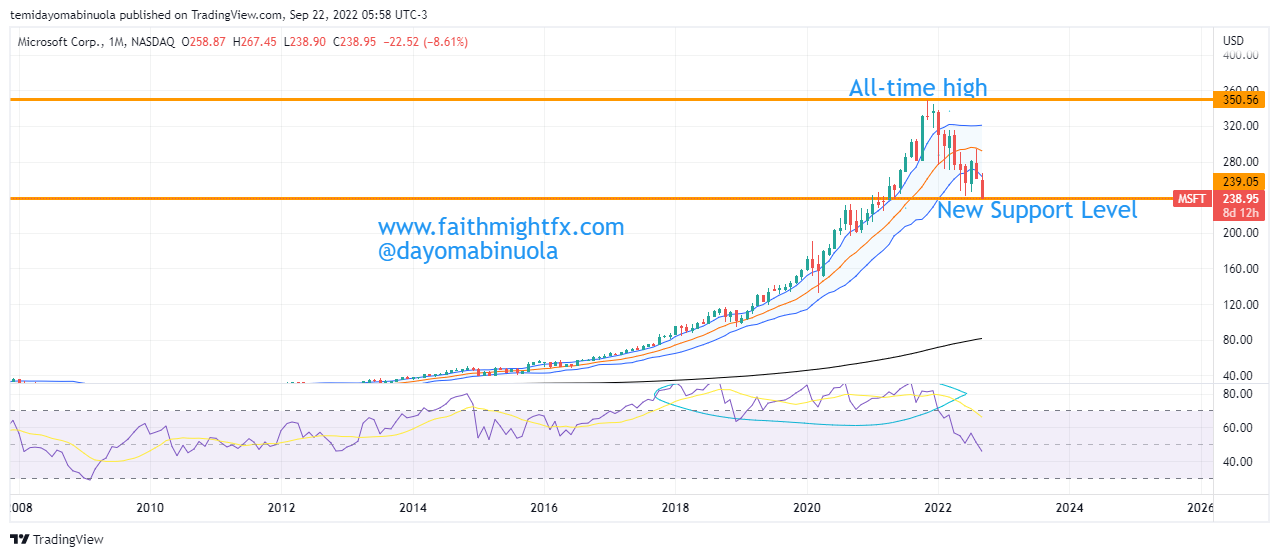
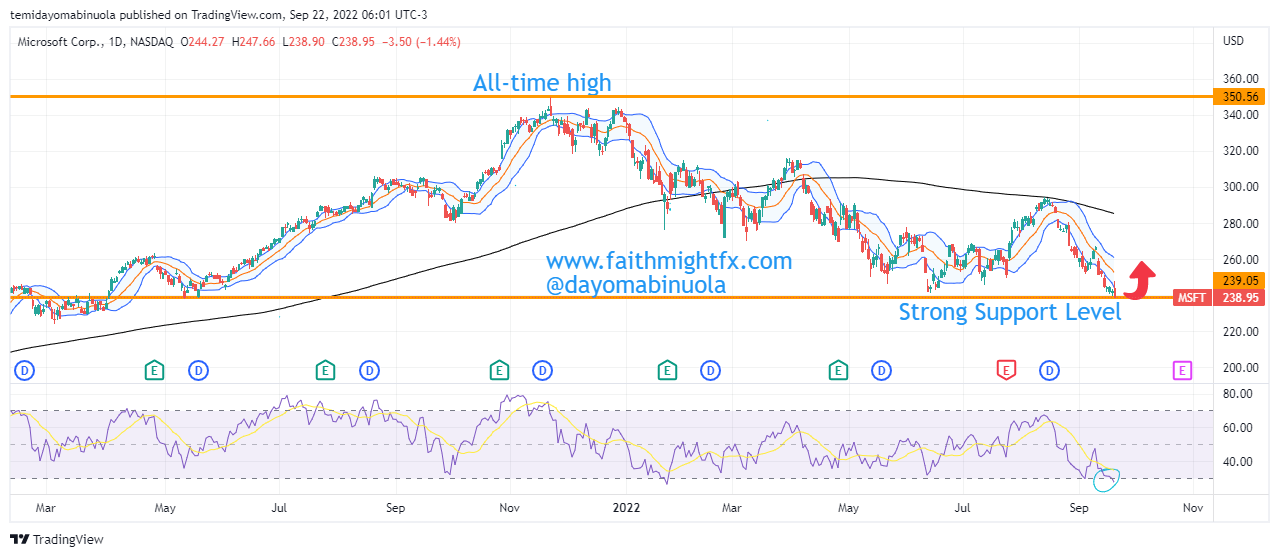
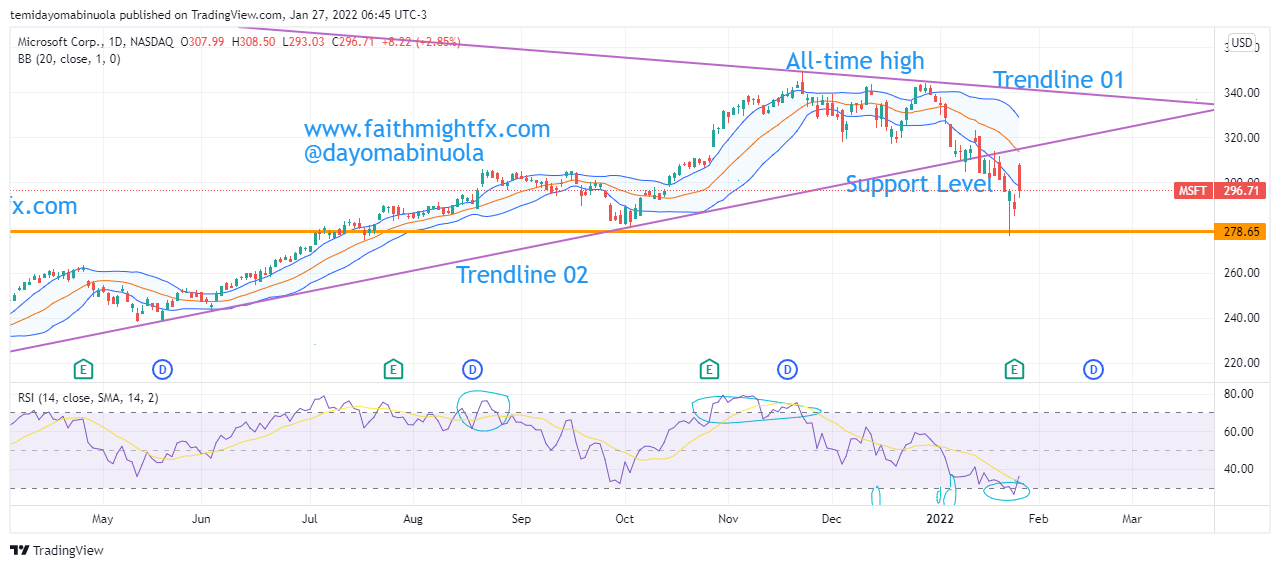
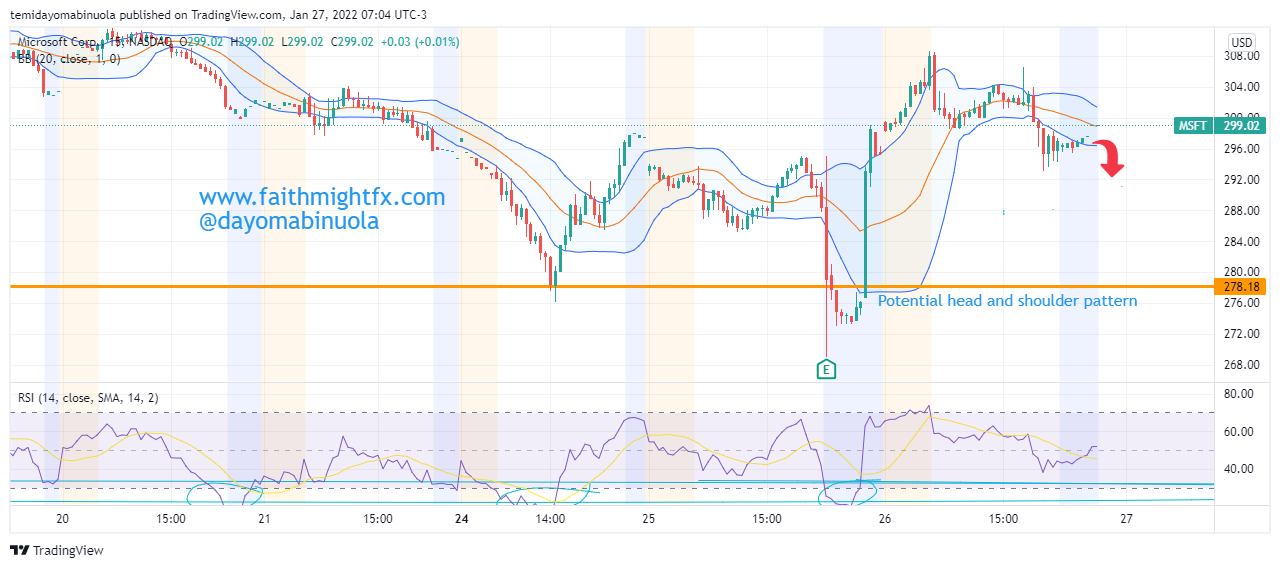
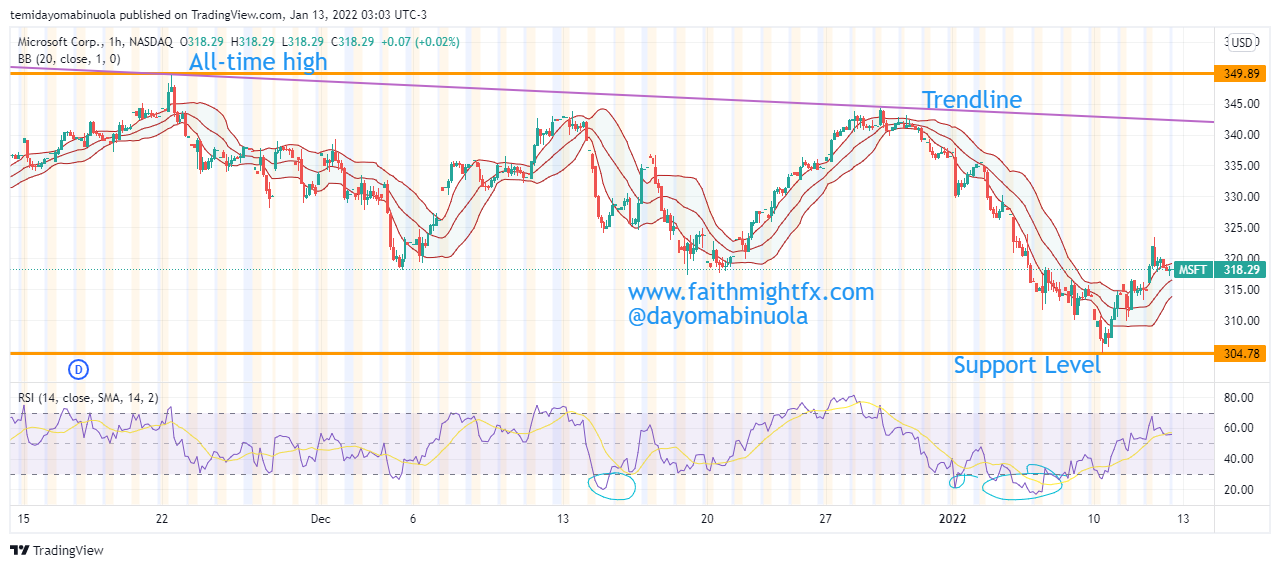
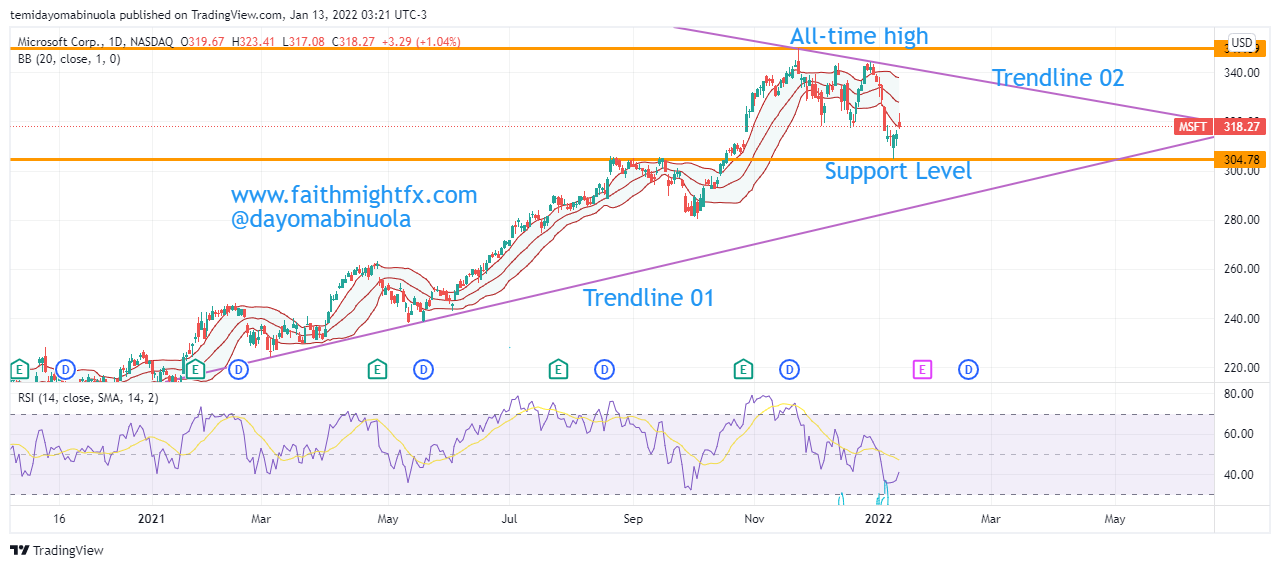
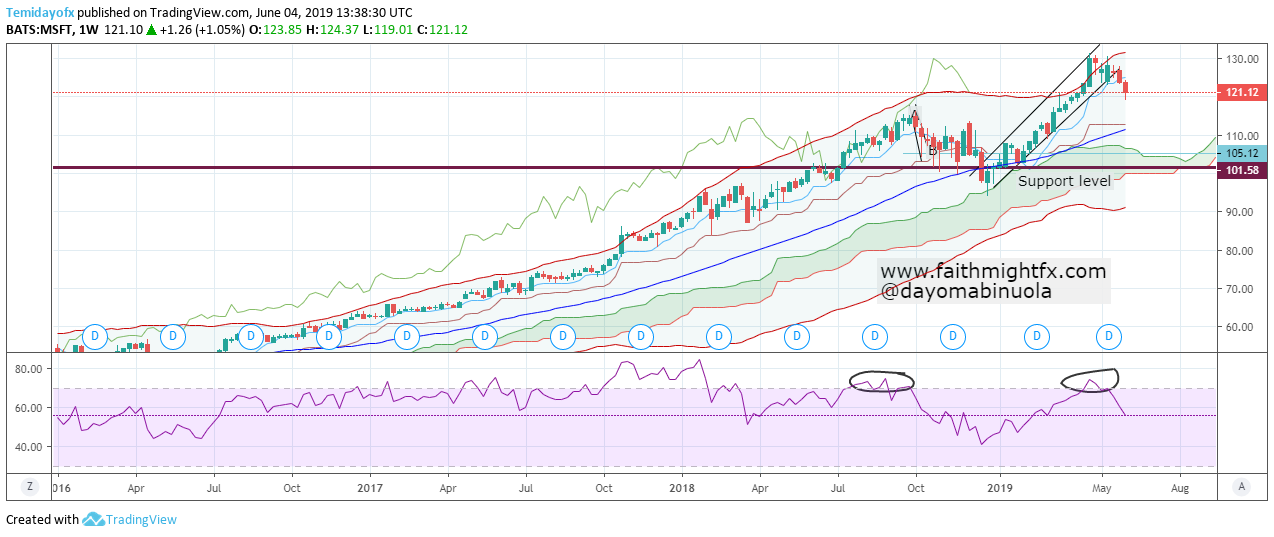
Microsoft also had a major bearish run in 2022 as price fell from the high of $350.02 to $211 in November 2022. The bounce in 2023 has made the share price of Microsoft reach an all-time high of $367 in July 2023. For both stocks, a correction has occurred this month. We might see a continued price rally in the coming weeks as $AAPL cold reach $195 per share from the current $174.74, and Microsoft could reach $340 from the current price of $319.

Some of these ideas are in our clients’ portfolios. To understand if this one can work for you or for help to invest your own wealth, talk to our advisors at FM Capital Group. Would you like more information on how to get stocks in your portfolio? Schedule a meeting with us here.

Microsoft Share Price Reaches 2023 High

Microsoft Share Price Reaches 2023 High

Microsoft is an American company that develops and distributes software and services such as a search engine (Bing), cloud solutions and the computer operating system, Windows. As of April 2023, Microsoft has a market cap of $2.129 Trillion. This makes Microsoft the world’s second most valuable company by market cap. According to Microsoft’s latest financial reports the company’s current revenue is $204.09 billion. In 2021, the company made a revenue of $184.90 billion which was higher than that of 2020 at $153.28 billion.

Last year was not so good for $MSFT after price dipped from the year’s high at $326 and closed at $238. There seems to be a bit of hope as Microsoft share price has rallied and it is about to reclaim the $300 threshold. Price currently stands at $286.89.

On the 6th of April, Microsoft’s share price reached $292, making it the highest point that Microsoft’s share price has reached in 2023. The stocks of several tech firms are currently appreciating, which is reflected in the S&P 500. Our analysts see Microsoft’s share price reclaiming the $300 pyschological level in the coming weeks.

Some of these ideas are in our clients’ portfolios. To understand if this one can work for you or for help to invest your own wealth, talk to our advisors at FM Capital Group. Would you like more information on how to get stocks in your portfolio? Schedule a meeting with us here

Apple and Saudi Aramco Still Above $2Trillion Market Cap Despite Market Dip

The world is yet to fully recover from the damage Covid-19 wreaked on the stock market. A few companies have been able to increase their market capitalization despite the global economic downturn during and post global lockdown. Only four companies have a market capitalization of over one trillion dollars. These companies are Apple ($2.201 trillion), Saudi Aramco ($2.046 trillion), Microsoft ($1,650 trillion) and Alphabet ($1.121 trillion).

Amazon Chart

As of January 2022, Apple became the first publicly traded company to reach $3trillion. Both Amazon and Tesla have surpassed $1trillion in the past, but due to the recent stock market crash, their market caps are currently at $928.15Billion and $645.43Billion respectively. The first company to ever reach $1trillion market cap was PetroChina but the gas company is currently at #122.05Billion in market cap.

Google Chart

Saudi Aramco tops the list of highest earners among the publicly traded companies with $279.3Billion. With the hike in inflation rate in many countries of the world, the stock market might not appreciate this year. The next major rally for global stocks could occur in 2023. By this time, we will have more companies with market cap of over $1trillion.

Apple Chart
Saudi Aramco

Some of these ideas are in our clients’ portfolios. To understand if this one can work for you or for help to invest your own wealth, talk to our advisors at FM Capital Group. Would you like more information on how to get stocks in your portfolio? Schedule a meeting with

Microsoft Sees Worst Close Since May 2021

Microsoft investors have enjoyed bull runs for 13 years as the lowest price within that time frame was at $15.10. Despite the worldwide lockdowns and the negative impact on many stocks across the world, Microsoft’s share price didn’t see a major reversal. What the Microsoft share price saw, at worst, were corrections. 

Monthly Chart

In fact, during the lockdown, Microsoft saw a correction between February and March after which it began to rise. This rally continued up until November 2021 as price reached $350, which stands as the all-time high. After this all-time high was reached, the activities of the bears can be likened to those in 2008 as price is currently at $238. Also, since 2015 using the monthly time frame, this is the first time four candlesticks will be seen in the lower region of the Bollinger Bands.

4hr Chart

We might be seeing a rally to $250 per share in the next few weeks. The 4H timeframe at two different times in September shows that price has been oversold. This could be an indication for the next appreciation in price.

Some of these ideas are in our clients’ portfolios. To understand if this one can work for you or for help to invest your own wealth, talk to our advisors at FM Capital Group. Would you like more information on how to get stocks in your portfolio? Schedule a meeting with us here

Microsoft Appreciates After Earnings Report

Microsoft reported earnings beat analyst expectations. The earnings per share came in above what analysts had forecast, rising 22.2% year over year. Revenue also surpassed analyst estimates, up 20.1% compared to the same quarter one year ago. Microsoft’s opening price at the beginning of 2022 was $335.87. The price has since fallen to $296.71, making it the worst monthly fall ever. That is an 11% decline since the beginning of the year.

Daily Chart

Furthermore , the company’s shares fell as much as 5% in post-market trading on Wednesday. Over the past year, Microsoft’s shares have made a return of 26.7%. The share price of $MSFT reached an all-time high at $349.69 in November 2021. Before the global market tanked a few days ago, the price had been ranging since that all-time was reached. The price of $MSFT reached $276.02 on the 24th of this month before a price correction. The last time price of Microsoft was at the $276.02 level per share was back in July.

15mins Chart

The 15mins time frame is showing that an inverted head and should pattern is about to form, which, in the long run, leads to a massive bullish run. In the next few days, the price should fall to complete the head and shoulder. If this is completed, the price could reach $339.98. The market opened yesterday after a gap-up but closed on a bearish note. The global market has been very bad this week. The next rally might just be what investors have been waiting for since the holidays are over. The RSI daily chart already shows that the price has been oversold. This could be the indication the bulls are expecting.

Some of these ideas are in our clients’ portfolios. To understand if this one can work for you or for help to invest your own wealth, talk to our advisors at FM Capital Group. Would you like more information on how to get stocks in your portfolio? Schedule a meeting with us here.

Microsoft Bounces From The Year’s Support

After the all-time high of Microsoft was reached on the 22nd of November, 2021, the price has continued to drop from the highest close on the 28th of December 2021 at $343.00. From the trendline drawn from the all-time high in 2021, the price is yet to break it to the upside. Microsoft investors have little or nothing to worry about, as the price has appreciated in the last two decades. 

1hr Chart

Just recently, Microsoft hired a top Apple Engineer, Mike Filippo, to work on custom chips as it looks to expand its own server-chips efforts, according to people with knowledge of the matter. Filippo’s exit is a huge loss to Apple after he has served as a top designer of semiconductors at ARM for a decade. Microsoft’s 2022 opening price was $335.24. The $MSFT bulls have failed to show up since the holidays were over. Price keeps falling as low as $304.78 on the 10th of January, 2022, making it the year’s support level. A gap-up occurred yesterday from $315.06 to $319.57.  This might lead to price recovery as our analysts look forward to the price of Microsoft reaching $341.48.

Daily Chart

There is no indication of price reaching a new all-time high as we look forward to receiving the earning report of Microsoft on the 25th of January 2022. On the daily chart, RSI shows the price is overbought while on the 1hr chart price is currently oversold. The hire of Filippo might boost the share price of Microsoft in the coming weeks. The trendline 01 on the chart shows that price is on a bull trend despite the bad start in 2022. RSI though shows price is overbought on the chart.

Some of these ideas are in our clients’ portfolios. To understand which ones can work for you or for help to invest for your own wealth, talk to our advisors at FM Capital Group. Would you like more information on Investment Advisory, Portfolio Services, and VC? Schedule a meeting with us here.

MICROSOFT CURRENTLY RANGING AROUND THE ALL-TIME HIGH

In the early trading days in 2018, Microsoft’s share price broke out comfortably above $100. And since then, the price is yet to reverse toward $100. The bull run continued until February 2020 when the price reached $190.82. As at that time, a resistance level was formed around $190.82, which lasted for about 3 months, as the support level was $134.07 in March 2018. This correction was the longest one since 2018, which was about 29.7%. The next rally after the correction has made a price of $MSFT attain $281.11 price.

Over the years, $MSFT has been investing hugely in products with Augmented reality and Virtual reality. These investments could be the major reason for the bullish run in the past few years. The most recent all-time high was reached at $281.11, on the 7th of July. The chart has the majority of higher low and higher highs patterns. Since the beginning of June 2020, RSI has shown many levels where price has been overbought.

A reversal could occur as a gap down and a gap up was shown on the chart when the price was below $250. A higher low might begin, which might push the price lower to reach $262.03. Also, many stocks are currently at the all-time high or ranging around the all-time high.

MICROSOFT REACHED AN ALL-TIME HIGH, PRICE MIGHT REVERSE.

The monthly chart shows that $MSFT has indeed enjoyed a bull run since 2009. That’s about a 2,000% gain in the last 12years. Despite Bill Gate stepping down from being a member of the board at Microsoft, the share price of $MSFT has continued to increase. In March 2020, the month Bill Gate resigned from being a Board member at Microsoft, the share price of $MSFT closed at $157.60, which means the appreciation was about 72%.

In the past, there have been several all-time highs with minimal reversals. The current share price of $MSFT is at an all-time high at $271.77. There are indications showing that there might be a reversal to the downside, to new support at $249.04. That shows that about 9% might be lost from the current price of $MSFT at $271.77.

RSI has shown 3 obvious levels that price has been overbought. In April, the all-time high was at $263.03, after which a correction occurred which made the price reach $238.11. Price is currently at the upper region of the Bollinger bands. In the month of June, the price touched the middle line of the Bollinger Bands two times.  This might be an indication of a possible reversal.

Who Wants To Buy TikTok?

The future of TikTok remains unknown. TikTok along ,with other popular Chinese based apps like WeChat, have come under scrutiny for its data sharing and alleged lack of data privacy. President Trump has ordered TikTok to either close its U.S. division or be acquired by another company.

Microsoft seems to have gained the most attraction to the app due to its user data potential while adding yet another platform to attract more consumers to its constantly expanding software capabilities. Despite Microsoft seeming to be the company that will buy Tiktok, Twitter has recently sparked an interest into the social media app as well.

Twitter over the years has gained attraction among users through its live streaming capabilities combined with its real time newsfeeds. Twitter has also more recently gained the spotlight through its newly enforced censorship policy regarding misinformation, which has been a catalyst for social media platforms to combat the spread of fake news. These defining attributes are what gives Twitter a leg-up on Microsoft and allows Twitter to easily integrate TikTok into its platform.

$TWTR has relative short-term strength with no foreseeable long-term gains.

According to our chart, $TWTR has had some similarity to $MSFT with its downtrends and corrections from the major March dip. On the contrary, $TWTR has been known to be the “underperformer” among other social media stocks. This is due to $TWTR history of having weak earnings its inability to break its lowest correction lows, and the never-ending political atmosphere that surrounds it. Based on the RSI and H, it is apparent that $TWTR can either be weak and volatile or steady with few and far corrections in between.

Overall, we believe $TWTR in the long-term investing won’t be a huge gainer but steady in terms of price gains with occasional lengthy troths. As for the short-term, we think that $TWTR performs its best under distress especially with the pandemic combined with its political affiliations. Therefore, gains can certainly be made in the short-term especially with $TWTR pattern of gaining before correcting itself.

Microsoft Share Price Reaches New Resistance Level

Microsoft share price was able to attain an all time high in April 2019. The rise made $MSFT price reach a new resistance level at 130.24. The previous all time high was in October 2018 at a resistance level of 115.63. The price of $MFST has refused to cross over to the lower region of the Bollinger bands for over a decade. With the recent highs reached, price might cross to the lower region of the bands depending on the activities of the sellers.

MSFT Weekly Chart

The trendlines have been broken this week. This might be a likely change of trend where the bulls might reduce activities for the bears to take over. The future of Ichimoku has refused to show a downtrend despite a break down from the trendlines occurring now. $MSFT investors over the years have reaped a bountiful harvest in their investments. At several instances, the RSI has shown price of $MSFT to be overbought. The downward breakout might make price of $MSFT to reach 101.58 as the current market price stands at 124.76.