fbpx

More Relief for the Euro

The $EURGBP ended last week back above the key 0.7000 support level. After breaking last week’s low, the EUR/GBP printed another failed low at 0.6949. The first failed low at 0.6984 was a result of a euro relief rally. Just when it seemed as though the $EURGBP was moving lower within its Fibonacci move, the BoE released its dovish policy statement and inflation report. The unwinding of interest rate expectations is now the reason for the latest rally in the $EURGBP. As a new fundamental shift in the markets, this rally looks to carry much more credibility than the last. As such, the failed low looks to target new highs above the previous high at 0.7159. The one obstacle for bulls is the 0.7100 resistance level. The rally into the end of the week held below this important level for another weekly close below 0.7100. When there is a close below the 0.7100 level, there is a subsequent drop in prices. When there is a weekly close above the 0.7100 level, the $EURGBP typically rallies after the subsequent hold of support. So last week’s close looks like a bearish signal for the $EURGBP. However, it is more likely price met profit-taking at the key level after a bullish week. It is expected that the $EURGBP continues to rally in the new trading week to break above the 0.7100 resistance level.

EURGBP DAILY CHART

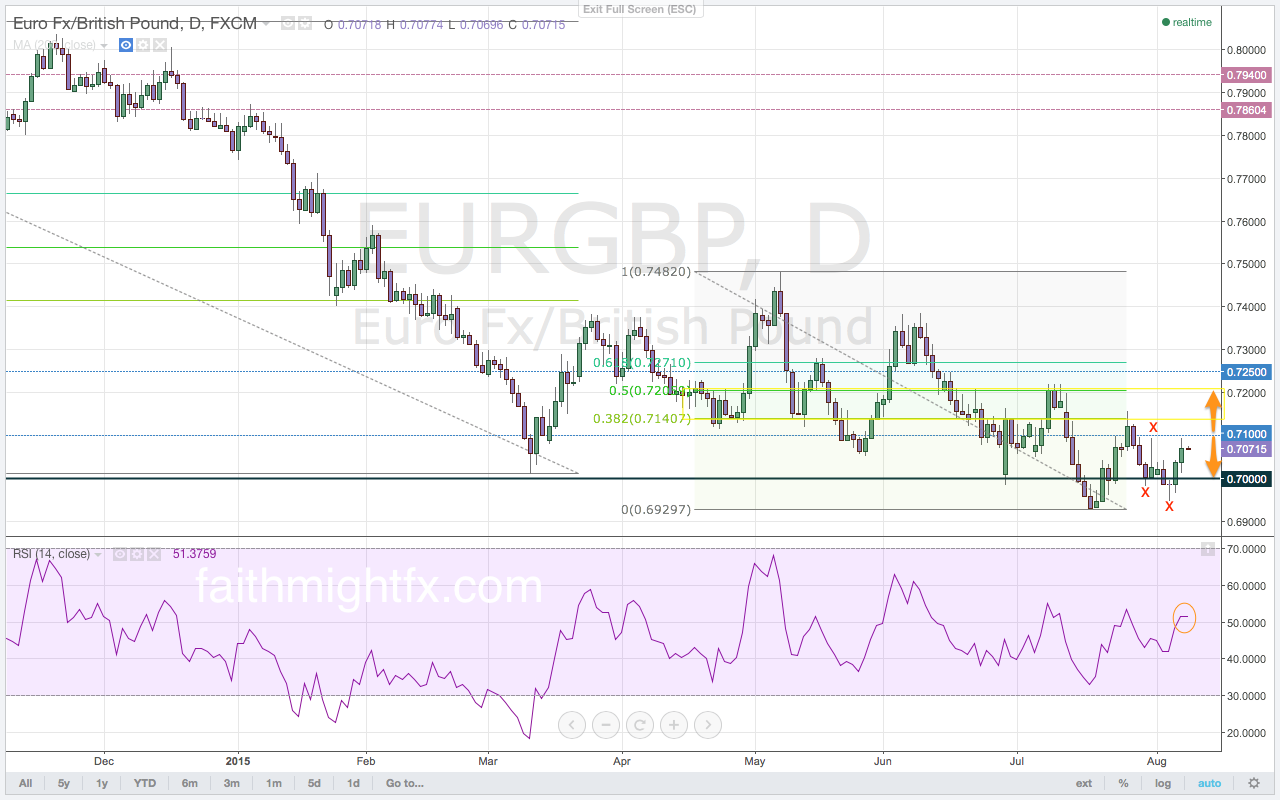
The $EURGBP repeated price action last week from the week prior. The failed low led to a rally that held below the 0.7100 resistance level. However, the new trading week is opening very differently from last week’s open. Last week, the $EURGBP immediately slumped lower as the market anticipated a bullish BoE Thursday and a hawkish BoE in the coming week. Now as the market processes new expectations in interest rates and a more dovish BoE, the $EURGBP opens the new week still elevated just below the 0.7100 resistance level. Momentum on the daily chart is back in bullish territory to start the new trading week. The price action at the open this week versus last week leads to a conclusion that the $EURGBP is looking to break to new highs. If the $EURGBP is unable to make a new low below the 0.6949 failed low, then a rally will set in that targets a new high above the 0.7159 high. It is important to note that a new high can still respect the sell zone for a Fibonacci move lower. However, with a second failure to make new lows below the 0.6929 lows, the probability is tilted towards a move higher above the key resistance level at 0.7100.


This is an excerpt from this week’s issue of QUID REPORT. Subscribers receive my research on all major GBP pairs at the beginning of the week, including access to @faithmightfx on Twitter for daily, real-time updates to the weekly report. AVAILABLE NOW.

CHART OF THE WEEK: RBA WAGS BACK

The $GBPAUD daily chart posted this week is the clear winner.

I like the Reserve Bank of Australia (RBA). They have actually been neutral for weeks. It’s not their fault that their stance against any more accomdative easing this year fell on deaf ears. Blame commodities. Buyers have been fixated on commodity markets. As commodities, including copper and iron ore, crashed into bear markets, forex traders sold AUD in like manner. The $GBPAUD rallied over 20,000 pips. Since MAY. That’s an incredible bull rally, by an measure. Markets simply ignored the RBA. Until this week. Monetary policy action and the statement this week showed an adamant central bank in their stand to allow the interest rate cuts this year to do their work. The RBA even appreciates the weak AUD. It bolsters domestic demand in the face of slowing exports. So no complaints there. Unlike their counterparts in Switzerland, the RBA is happy to have traders do their dirty work. Smart.

The price action and close this week do serious technical damage to this chart right here.


GBPAUD DAILY CHART


This chart is an excerpt from this week’s issue of Quid Report. Subscribers receive my research on all major GBP pairs at the beginning of the week, including access to @faithmightfx on Twitter for daily, real-time updates to the weekly report. AVAILABLE NOW.

BoE Thursday Provides Clarity

After three weeks of trading, the USD has been unable to move the $GBPUSD lower since the lows at 1.5329. The rout in the commodity markets, from wheat to iron ore and from oil to diary, has strengthened the USD. Federal Reserve Governor Yellen continues to hint towards higher interest rates in 2015. The Federal Reserve rather be ahead of the curve on inflation by increasing interest rates even as oil falls and despite the already strong USD. With weak commodities and a pending U.S. interest rate increase, the $GBPUSD looks to resume its overall downtrend. However, the $GBPUSD has become stuck in a range of increasingly higher lows and higher highs. As such, the bullish bias has returned to the $GBPUSD. The longer the $GBPUSD remains above the 1.5500 level, the probability increases for the next move to be to the upside. Such an upside move looks to the complete the Fibonacci move with a rally that breaks above the 1.5929 highs. The 1.5700 level is now a key level for direction to the upside. A confirmed break above that area of resistance signals a resumption of the rally. Momentum is in bullish territory though the hold below the 60.0 level on the RSI holds bearish implications. The 1.5250 support level is a key level for direction to the downside. A confirmed break below this level will accelerate $GBPUSD losses back to the 1.5169 lows to complete the reversal kicked off by the break below 1.5459 (Volume 19).

GBPUSD DAILY CHART

Over the last several trading weeks, it has become peculiar to see the $GBPUSD unable to move lower as the USD surges against commodities during the same time period. The $GBPUSD carved a range of consolidation in the sell zone on the daily chart. The highs of the range above the 1.5600 level are simply a series of failed highs after bouncing out of the Fibonacci levels on the weekly chart. Without a move back to lows after spending four weeks above the 1.5500 support level, the $GBPUSD now looks to move higher still. The USD rally continues to loose momentum with every weak economic release. A weakening economy may be enough to delay interest rates hikes in the U.S. despite the hawkish hints from Governor Yellen.

The biggest driver of a hawkish Federal Reserve was increasing inflation, particularly in wages. The release of the employment cost index showing a decline holds big implications for the release of the U.S. jobs report. If hourly wages decline in the release this week and confirm the weak employment cost index, the $GBPUSD aims to breaks above the top of the range. A break of the range to the upside looks to complete the Fibonacci move of the weekly chart. If, however, the jobs report is another strong report, the $GBPUSD will move lower in an attempt return to the 1.5329 lows. The key level to watch on a break of these lows is the larger 61.8% Fibonacci level at 1.5086. Given that this the bottom edge of a buy zone, there remains the possibility for a rally off new lows.


This is an excerpt from this week’s issue of QUID REPORT. Subscribers receive my research on all major GBP pairs at the beginning of the week, including access to @faithmightfx on Twitter for daily, real-time updates to the weekly report. AVAILABLE NOW.

RBA Remains Neutral

Since consolidating in a triangle pattern back in March, the $GBPAUD has extended its break of the triangle pattern to stage a breakout rally to 2.1527. This breakout above the 2.000 resistance and major psychological level to highs took out the former highs on both the daily and weekly charts. The monthly chart must be studied for the potential of a continuation higher. Having broken above the large 50% Fibonacci level at 2.0720, this breakout rally now targets the 61.8% Fibonacci level at 2.2217. The break above the 50% Fibonacci level is a very bullish development for the $GBPAUD as it signals that price will continue to move higher. A break of the 61.8% Fibonacci signals a complete reversal. The rout in commodities has been a sore spot for the Australian dollar. Iron ore and copper, two of Australia’s largest exports, have suffered steep declines in price along with oil. Though the RBA did not move on monetary policy last month, they have stated that they were unlikely to ease monetary policy again this year despite its economy softening in the face of commodity weakness. Despite the RBA reducing calls for more easing, AUD selling has not abated. Copper, oil and gold have all opened the new trading week accelerating to new lows. If the RBA can stand firm with this more neutral sentiment in their interest rate announcement this week, the $GBPAUD may begin to turn lower.

GBPAUD DAILY CHART

The $GBPAUD completed its Fibonacci move from last week when it moved to new, multi-year highs at 2.1527. Despite the new, multi-year high in price, momentum is still diverging on the daily chart. This bearish divergence signals for another corrective price move lower in price. As the correction works price lower, momentum should find support at the 60.0 level. This level on the RSI has been a strong support for momentum during corrections in the $GBPAUD since breaking above the all-important 2.00, now turned, support level. With momentum currently out of overbought territory, price will have supportive buying momentum to move the $GBPAUD to new highs again. If momentum were to take out that support level on the RSI that would be a tentative signal that the $GBPAUD may be looking for a reversal. However, the bearish divergence alone is not enough to deter buyers. The $GBPAUD can still rally to new highs but if the RBA continues with more neutral sentiment after their interest rate announcement that could, in fact, trigger a selloff.


This is an excerpt from this week’s issue of QUID REPORT. Subscribers receive my research on all major GBP pairs at the beginning of the week, including access to @faithmightfx on Twitter for daily, real-time updates to the weekly report. AVAILABLE NOW.