fbpx

FTSE 100 Index consolidates above 7000

The FTSE 100 Index is a share index of 100 companies listed on the London Stock Exchange. The total market cap as of April 2022 was £1.996trillion. It was launched on the Stock Exchange in 1984 by the FTSE group at an IPO price of 1650. Over the last three decades, long-term investors in FTSE 100 have seen its price reach an all-time high of 7900 which occurred in May 2018.

Weekly Chart

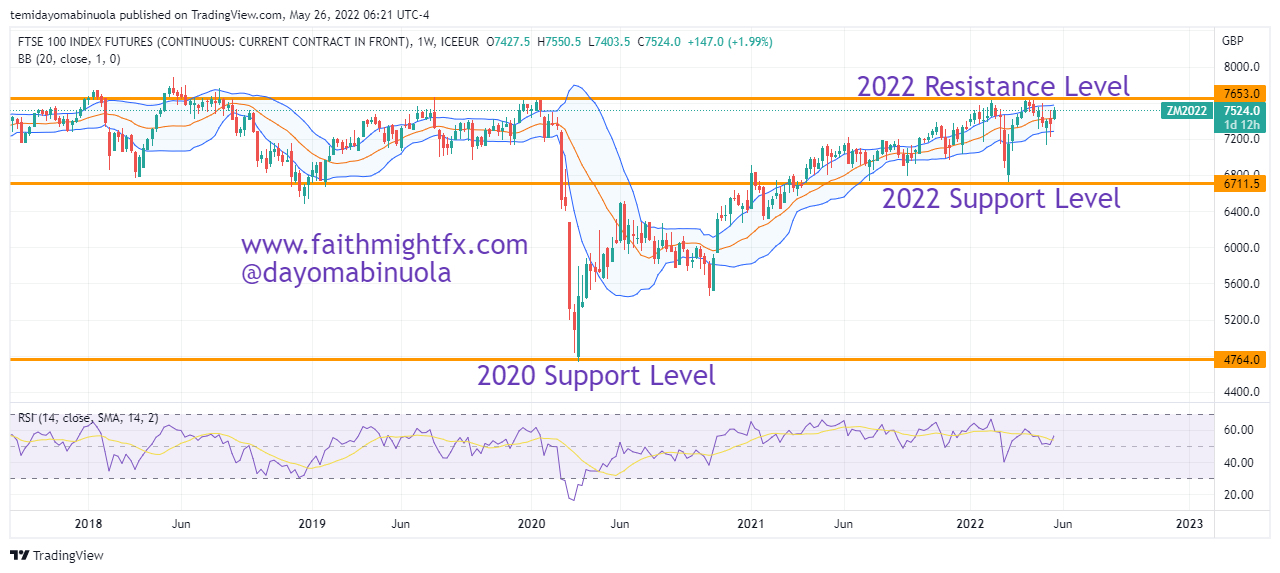
Enter COVID-19. FTSE 100 had been ranging pre-Covid after the all-time high in 2018. In March 2020, the price fell as low as 4800 which could have been a result of the slump in stocks across the world during that time. Following the lockdown ease, price rallied back above 7500 which was close to the all-time high of 7900 in 2018. 

Monthly Chart

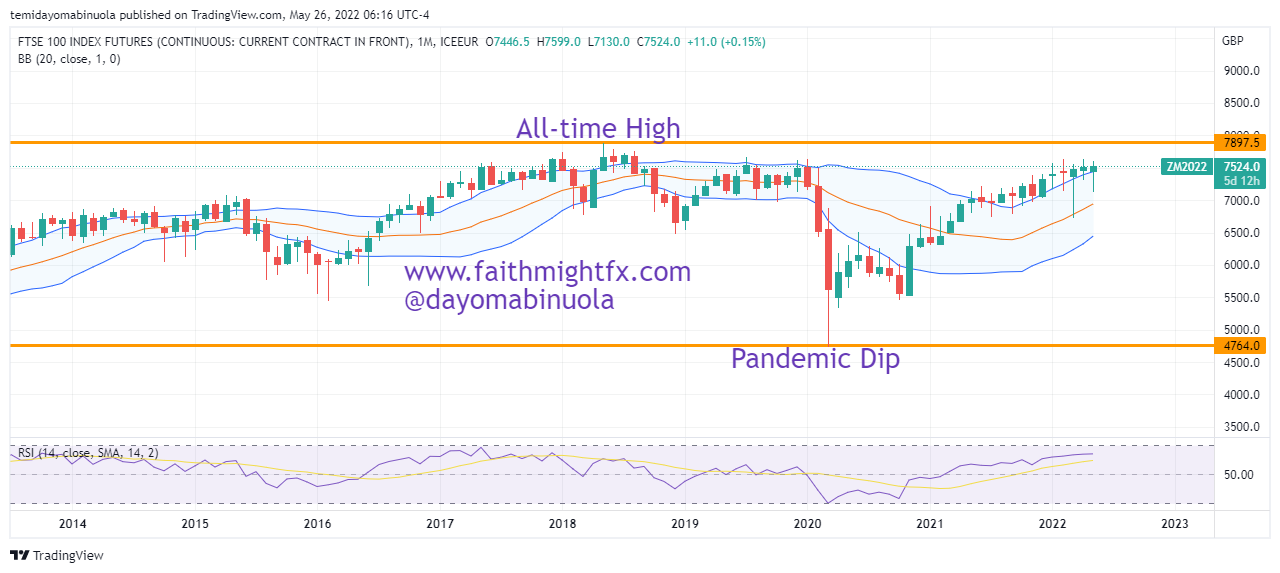
Since the beginning of 2022, the highest opening price on the monthly chart is 7523 which was in February 2022. The worst close also was in February 2022 at 7388. RSI gave no indication that price has been overbought both on the weekly and monthly charts. Price is currently in the upper region of the Bollinger Bands on the longer timeframes. A breakout to the upside might occur as price looks to hit a new all-time high at a psychological level of 8000.

Some of these ideas are in our clients’ portfolios. To understand if this one can work for you or for help to invest your own wealth, talk to our advisors at FM Capital Group. Would you like more information on how to get stock indices in your portfolio? Schedule a meeting with us here

What I Wish I Said

I was honored today to be on @spz_trades’s last show on BFTD.tv with @NicTrades. @NicTrades is a superwoman who chatted markets in the middle of a power outage. She rocks. Some of her key observations for 2014 that I took away:

  • $AUDUSD to 0.9000 off the double bottom
  • $USDJPY to 112
  • USD lower and USD pairs higher
  • $EURUSD to 1.43
  • Correction in $SPX, $DAX and $FTSE
  • Stocks will have to rally on their own merit, not QE

I was clearly the student in the room and now in hindsight there are a number of thing I WISH I could say now. SMH. Face plant. So I’ll say them here.

  • I do see $EURGBP higher to 0.8600. I also still see heading lower in 2014 to 0.8000. It might happen way sooner than I imagined if current price action is any indication.
  • $GBPAUD is due a correction lower. Much lower. But if it were to correct to 1.7670 the 50% Fibonacci level, hold, and rip to new highs at 2.10, it would be the trade of the year.
  • Other great follows right now on Twitter for new traders that I didn’t mention: my traders list

I love that this blog gives me the opportunity to reflect on myself and remain true to who I am. I don’t know if it was nerves (Nic is a rock star!) or because I had company the night before, but I don’t feel like I came off myself today. Hopefully, you all can enjoy listening in on this chat about markets and trading for 2014.