fbpx

The Loonie Might Appreciate Against The Buck

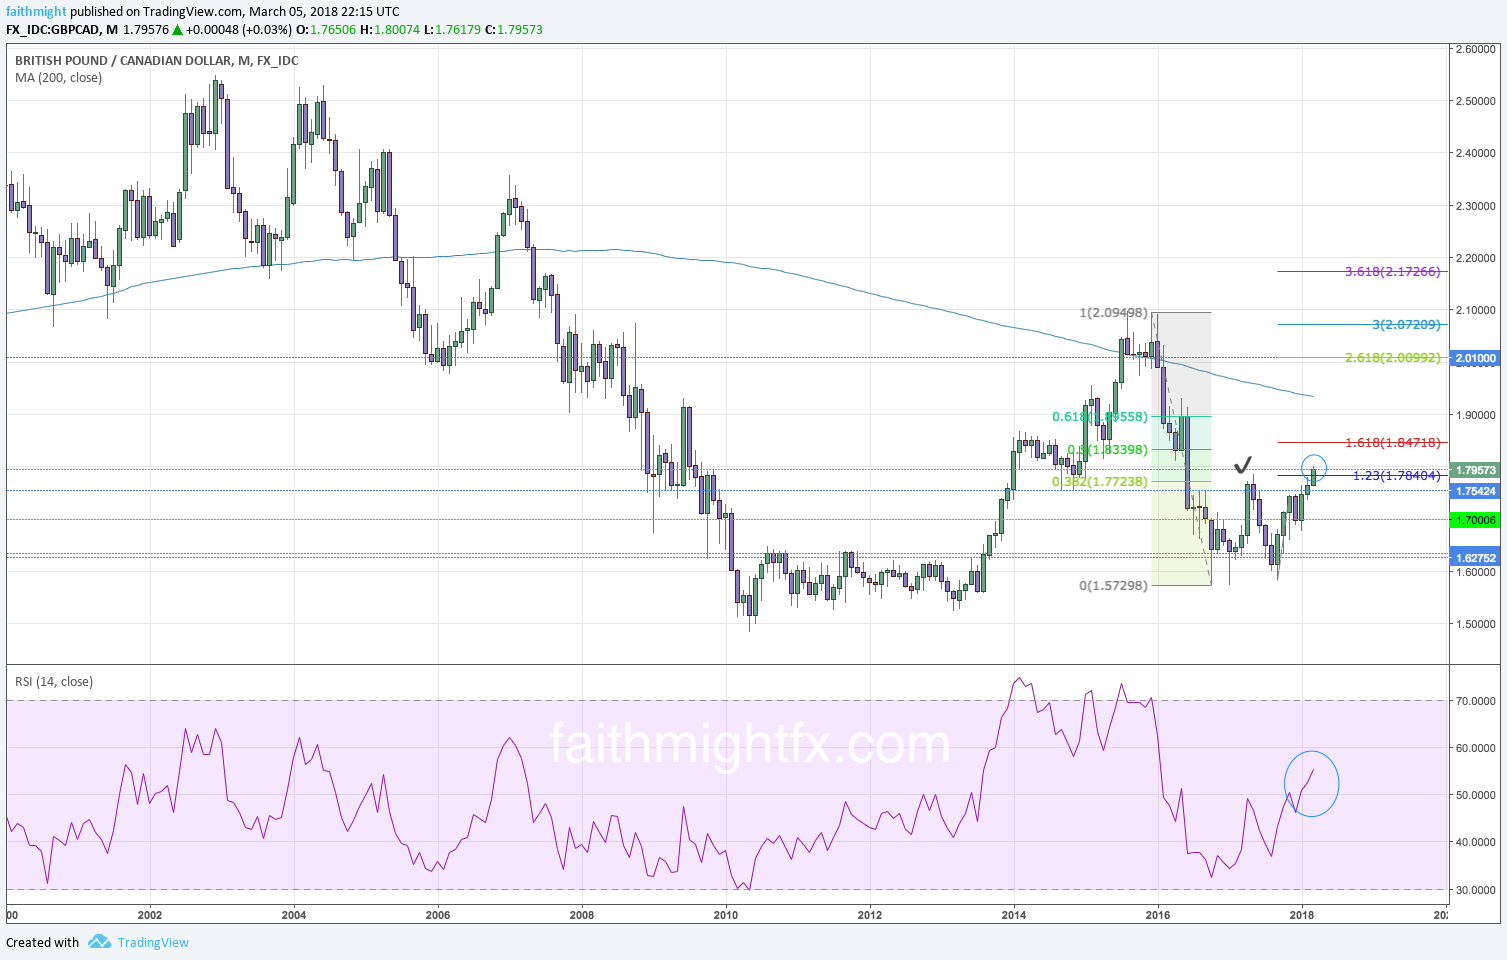
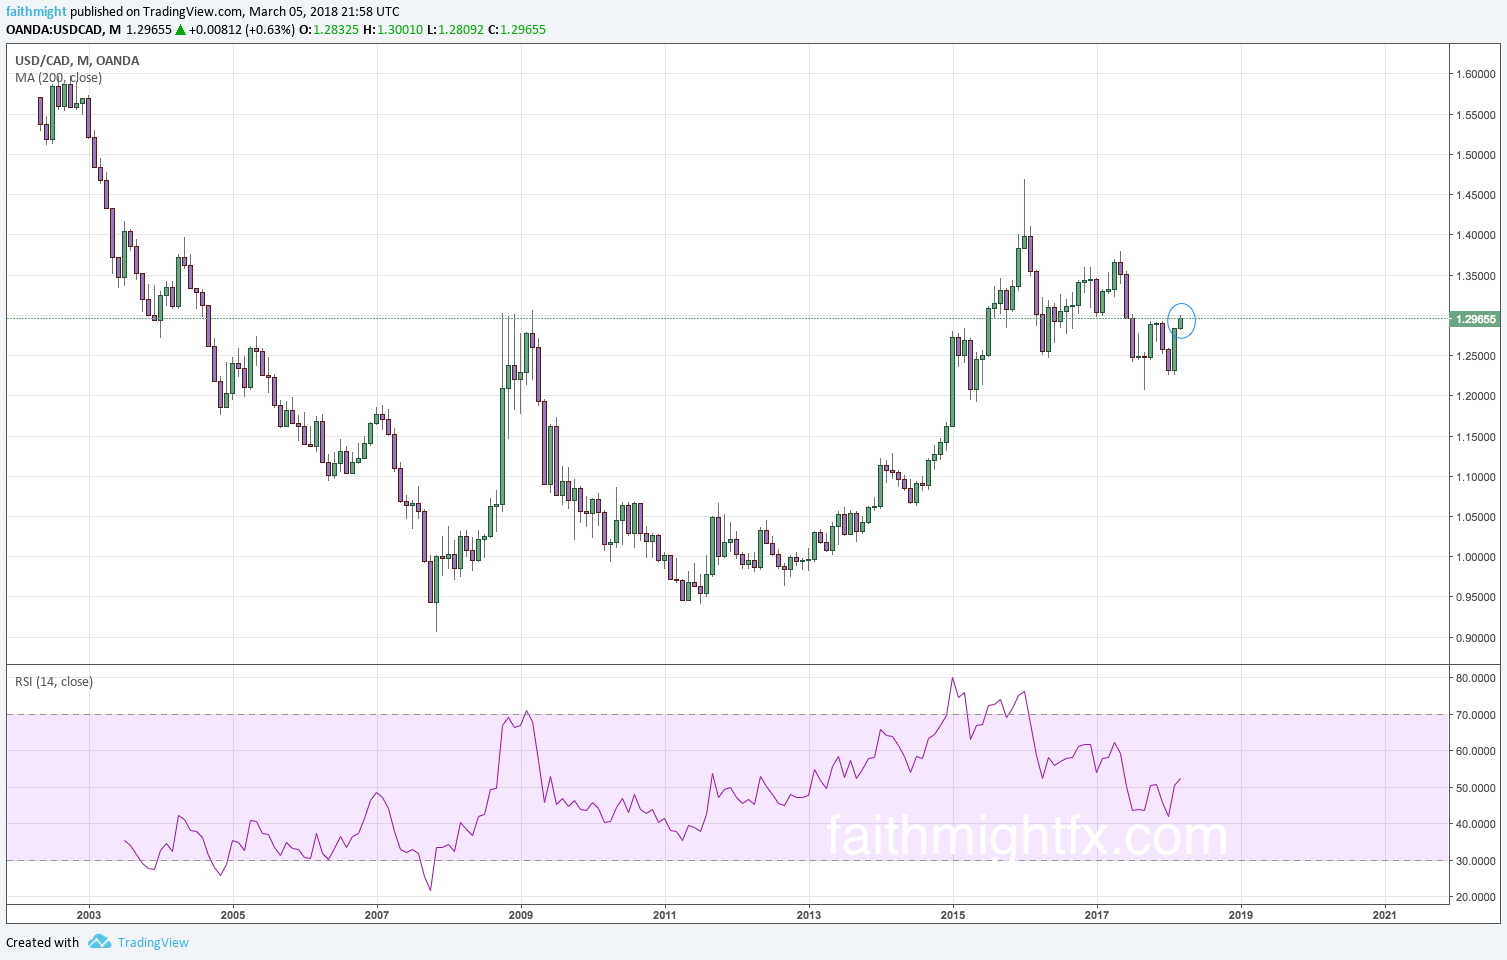
At the beginning of the global lockdown in 2020, the bucks gained massively against the Canadian dollar as prices moved from the ranging market between 1.29582 and 1.33864. This price range was before the lockdown, which lasted for more than 6 months. A breakout of the range occurred in February when the price rallied to 01.46710. That rally was about 150pips. The price of $USDCAD was last reached 1.46710 in January 2016 until the rally before the lockdown. After the lockdown easing, the loonie gained against the dollar which made the price reach 1.20193 in June 2021 after 6 years. 

Monthly Chart


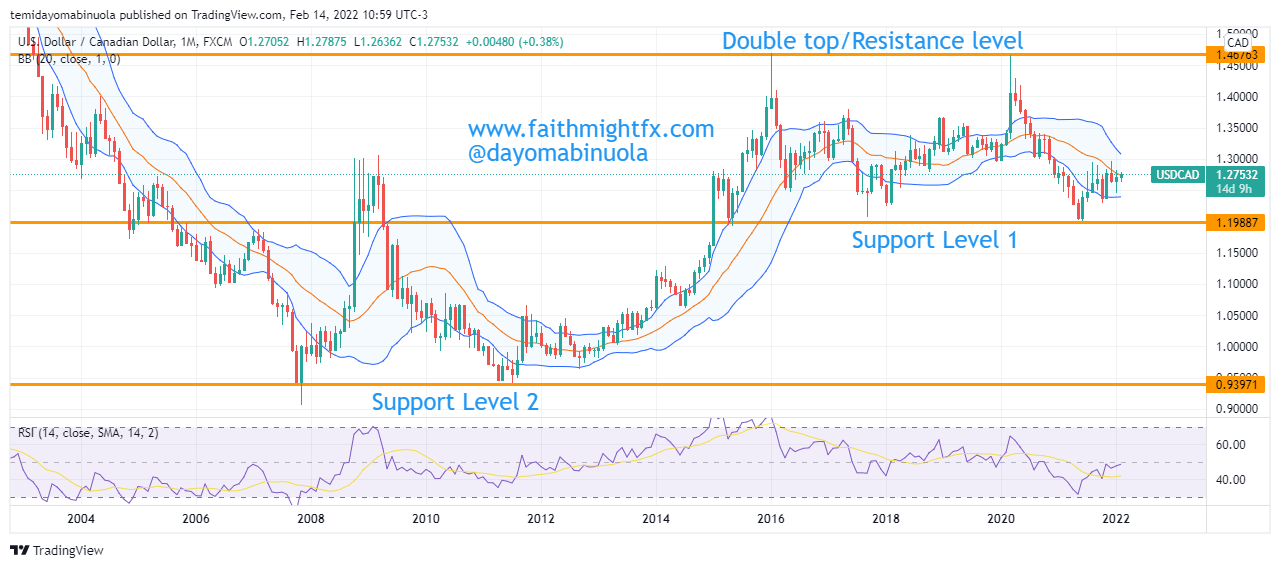
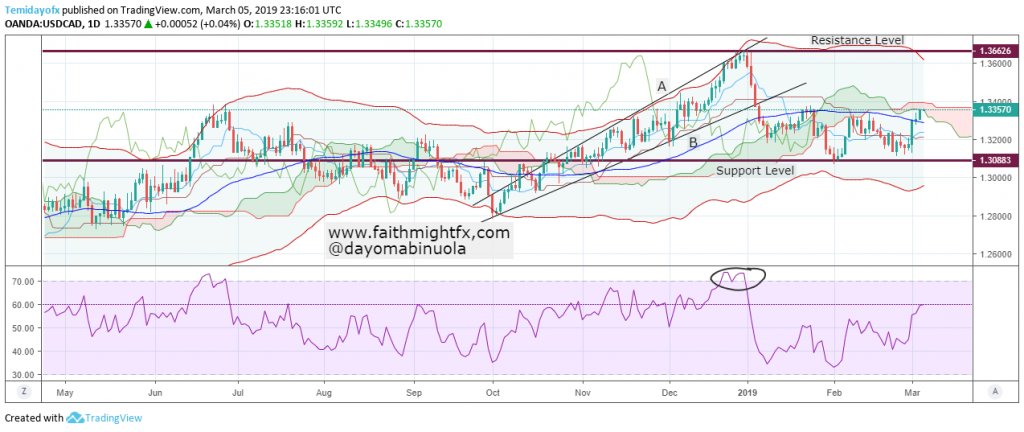
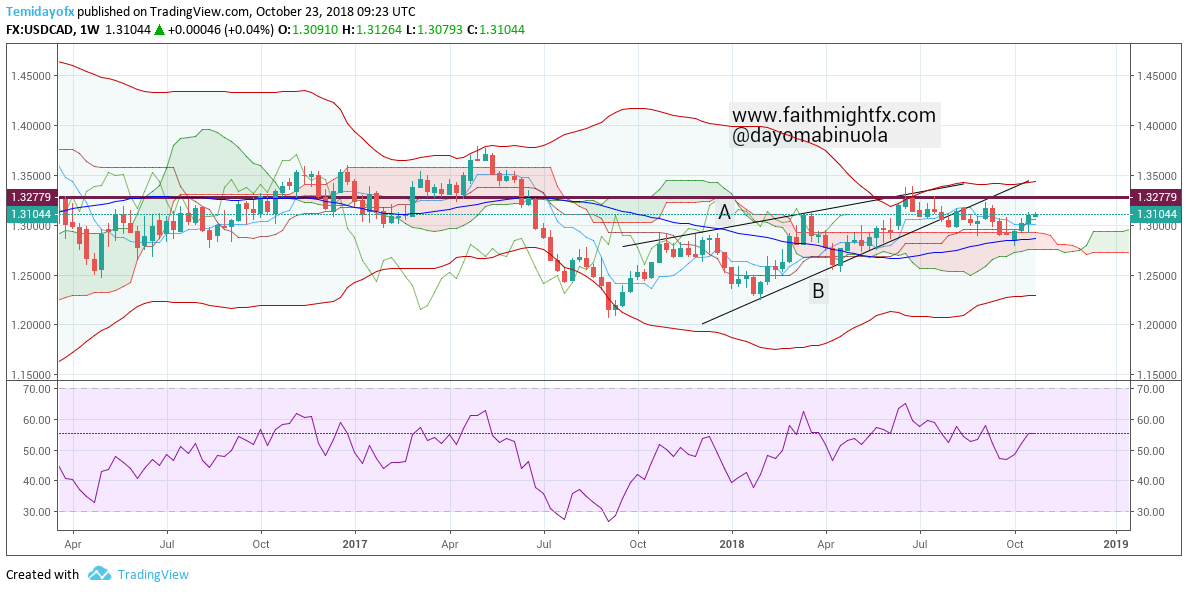
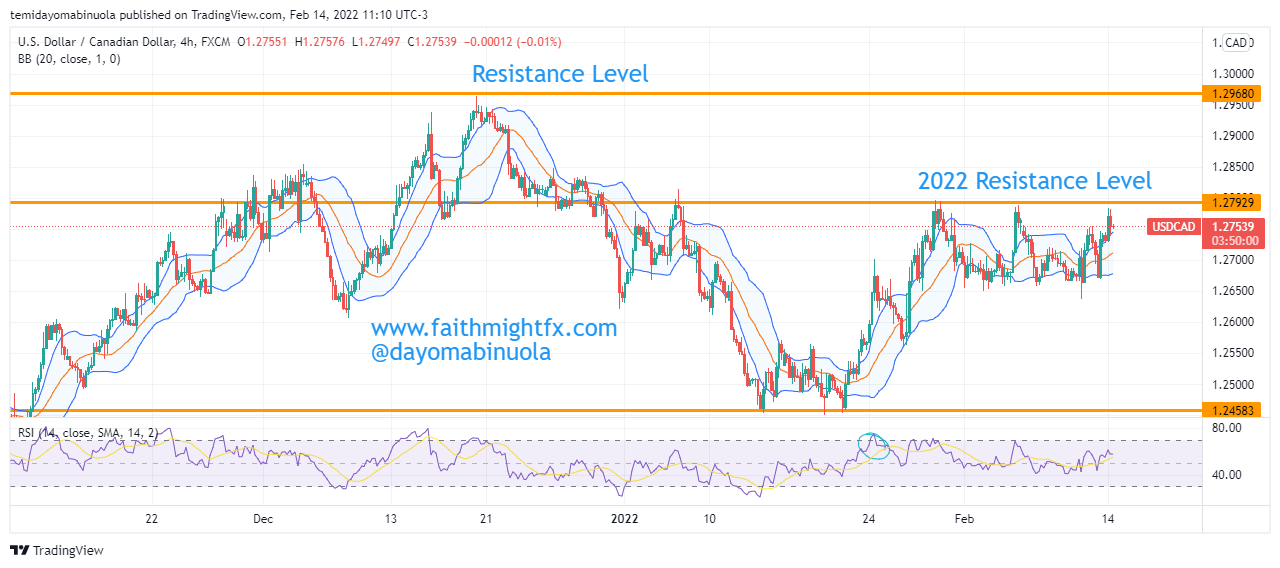
As the $USDCAD maintains support at 1.20103 since last year, a bounce has occurred as the price reached 1.29658 from the support level. Though RSI shows price has been oversold, the bears could still push lower to 1.24754 from its current 1.27472. RSI  shows the price has been oversold on the 4hr Chart. Looking at the monthly time frame, the price has been ranging for about 6 months with the bulls more active. The bears might take charge in the next trading days. 

4hr Chart

Some of these ideas are in our clients’ portfolios. To understand if this one can work for you or for help to invest your own wealth, talk to our advisors at FM Capital Group. Would you like more information on how to get currencies and stocks in your portfolio? Schedule a meeting with us here.

Extreme Positions

Check out the positioning in the forex market as we were headed into today’s FOMC meeting. Though Walle Smith points out here the crowding into GBP shorts, look at the USD positioning last week as reported by the CFTC. In light of today’s 25bps rate cut, 2 dissenting FOMC members who wanted to hold on interest rates, and verbal confirmation during the press conference from Federal Reserve Governor Powell that there will be no cycle of interest rate cuts, the positioning in the market is not at all stretched. With all of that just happening, there was still room in the long USD trade. Which is very interesting when you look at the trends against the other major world currencies. The market has significant room before it even is considered crowded with long USD positions.

My take is that the Fed has pretty much given markets the green light with no real reason to sell the USD. And it is likely that the USD continues to move higher still.

US Dollar Might Lose Against The Canadian Dollar

The highest point $USDCAD reached in 2018 was at the last 4 trading days at 1.36583. After this high, a bearish trend began and since then, price has refused to go back to a level of 1.36583. Price has since then fallen to the lower region of the Bollinger bands. 2019 has been bearish for the $USDCAD.


The trendlines broke down after price touched the upper line of the Bollinger bands. RSI is already showing an overbought position which is also shown with the price action. After a new support level has been reached in 2019 at 1.30883, a range in price has been dominating the price movement. Ichimoku also shows the bears are in the market and this might continue for a while. Price of $USDCAD might fall about 900pips which the $USDCAD bears have gone down with 300pips already. Price might continue the downward movement for a few weeks to come.

ON THE AIR with Futures with Ben Litchenstein

? I was back on the TD Ameritrade Network with the Futures with Ben Lichtenstein Show bright and early this morning ?? talking Bank of Canada, Brexit and the U.S. dollar. Ben always asks the tough questions providing a great interview of insights for viewers.

It looks like the Bank of Canada did, indeed, back down off their hawkish rhetoric as the Canadian dollar is weaker after the monetary policy announcment. The U.S. dollar is starting to react a bit to that poor U.S. trades number but the market will likely keep a muted reaction as it waits for the spotlight event of the week, the U.S. jobs number. Don’t forget about the Canadian jobs report released at the same time. Another weak economic report just may send the Canadian dollar over the cliff for good.

Watch my full segment below:

Lydia Idem on the Futures with Ben Litchenstein Show on the TD Ameritrade Network
Click the image to watch!

Price Obeys USDCAD Bullish Movement At Resistance

The $USDCAD direction has an upward zigzag movement throughout this year. Price has been retesting on the resistance level several times this year. For the most part of 2018, price has been bullish. The USD obviously has been taming the strength of the CAD for some time. The highest price movement of $USDCAD this year has been at level 1.33419. The last time price touched this point was in June 2017. A bearish signal shows through the breakout in the trendlines, which tend to move downwards.

The Bollinger bands still holds price in the upper region of the bands. A reversal might happen anytime soon, which will make the CAD to gain more leading to a new trend downwards. Since RSI shows no trace of price being overbought, price has been able to touch the upper part of the band before touching the middle band line. Since a breakout occurred from the trendlines, price is meant to touch the lower band line in the coming weeks. As I expect bearish movement to start, this is dependent on sellers of the $USDCAD currency pair. The price of $USDCAD might reach 1.2840.

Given that price is still 500 pips away from there, this breakout to the downside could also be a fakeout.

Twitter GOLD?

I thank God for my follows. I follow great people on twitter. Reading through the news and got this awesome retweet from @AdamPosen:

Read the entire thread. And then let’s talk about the Canadian dollar. The loonie is swooning. It’s been weak against the Great British pound all year. But today’s market open weakness seems buttressed after the announcement of the trump’s steel and aluminum tariffs.

GBPCAD monthly chart

The $GBPCAD hit new highs today. New highs that are plowing through the 123% Fibonacci extension and a psychological level at 1.80. Today’s new highs are finally confirming the near-double bottom off last year’s (2017) low.

And to really look at the engine of this new shift in Canadian fundamentals, a girl has to look at the $USDCAD. Of course, there are new highs there too.

usdcad monthly chart

Momentum has plenty of room to build. And these are large timeframes. Of course, price won’t move in a straight line but we like the trend potential in the loonie.

There are ebbs and flows to every market. Trade what you see. Invest with a pro.