fbpx

Walmart Had A Gap-Up, As They Prepare 3 for 1 stock Split

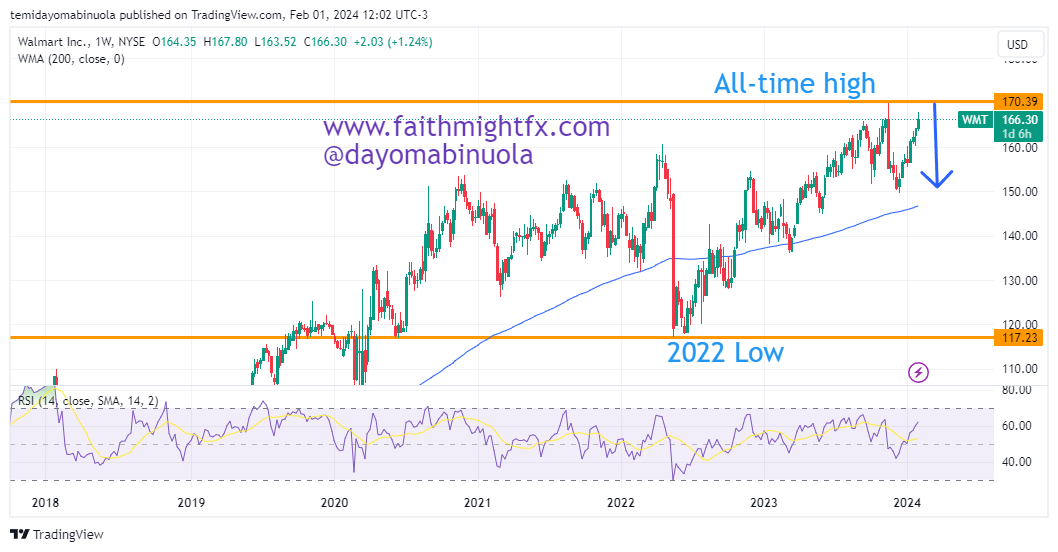
Walmart Inc. is an American multinational retail corporation that operates a chain of hypermarkets (also called supercenters), discount department stores, and grocery stores in the United States. Walmart reached an all-time high at $170 per share on 15 November 2023. After the all-time high, there was a gap down, which made the price of $WMT reach $158.69. The price continued to fall to $149.55 on 11 December 2023, which is currently a support level.

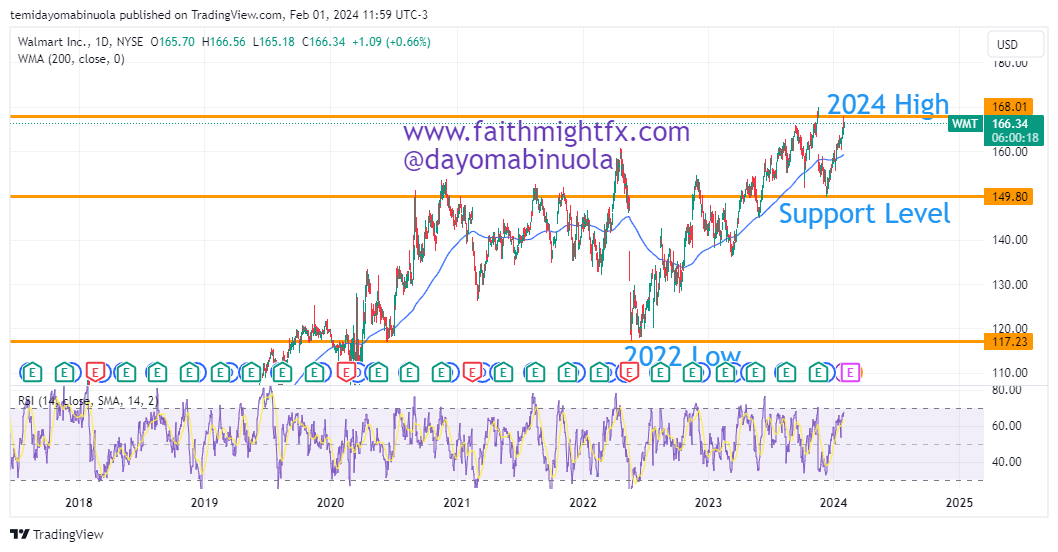
From the support level in December 2023, price rallied to the 2024 high at $167.95. On the 30th of January, Walmart announced that it will conduct a split of its outstanding shares of common stock at a ratio of 3:1. That same day, the price of $WMT closed at $165.64. The opening price the following day was $167.95 which indicated that a gap-up had occurred. The stock split is part of Walmart’s ongoing review of optimal trading and spread levels and its desire for its associates to feel that purchasing shares is easily within reach. We might see the price of $WMT at $150 in the coming weeks.

Some of these ideas are in our clients’ portfolios. To understand if this one can work for you or for help to invest your own wealth, talk to our advisors at FM Capital Group. Would you like more information on how to get stock in your portfolio? Schedule a meeting with us here

Walmart Bulls Set To Recover

The opening price of Walmart at the beginning of 2022 was at $144.03 per share. Price ranged for the most part of January before the bears took control, although this bearish turn was for a short period of time. The first major support level of 2022 was at $132.02 per share which was in February. From that support level, Walmart’s bulls pushed price to a new all-time high in April at $160.77.

Weekly Chart

After the all-time high was reached, the next trading day opened with a bearish turn as price went as low as $117.16. This price doubles as both the current year’s low and the current support level. Since that year’s low, each time the price tried to rally, the bears counteracted the bullish movement. On the daily chart prior to the fall to the $117.16 support, there were a few gap downs which are yet to retrace. 

Daily Chart

On the 16th of August, there was a gap up from the close of the 15th. The close of the 15th was at $132.56. The opening price of the 16th was at $138.81, about a 5.1% increase in a single day. This gap up could be a light at the end of the tunnel for Walmart investors as it could lead to a rally to a new all-time high above $160. RSI on the daily chart indicates that price is oversold. The daily chart also shows that the candlestick is in the upper region of the Bollinger Bands.

Some of these ideas are in our clients’ portfolios. To understand if this one can work for you or for help to invest your own wealth, talk to our advisors at FM Capital Group. Would you like more information on how to get stocks in your portfolio? Schedule a meeting with us here

Walmart Share Price Falls to A Two-Year Low

The American multinational retail company reached an all-time high at $161.03 in April 2022. This point was reached after price ranged from the latter part of 2021 to March 2022. Following the range, price broke out and headed for the aforementioned point that became the all-time high. 

Weekly Chart

The month of May 2022 ended bearish after the price opened at $154.82 and closed at $128.38. The month of June 2022 has begun on a bearish note but $5 has been lost from the opening price of the month of June 2022 which was at $154.82. In May 2022, the price fell to as low as $117.05. Price last hit this point in July 2020.

Monthly Chart

RSI showed in Q4 2020 that price has been overbought. The trendline is yet to be broken despite the corrections. The 4-Hr Chart shows there was a gap down in the price of Walmart mid-May 2022. This gap down might close up and it could be an opportunity for the Walmart bulls to push price higher from the current price of $123.30. We might see price reach a new all-time high in the coming weeks.

Some of these ideas are in our clients’ portfolios. To understand if this one can work for you or for help to invest your own wealth, talk to our advisors at FM Capital Group. Would you like more information on how to get stocks in your portfolio? Schedule a meeting with us here

Walmart Has Lost Its Uptrend Grip

A resistance level of 103.95 was reached on the 25th of April 2019. For the most part of 2019, the Walmart bulls have been in charge of the market . A gap down occurred on the 26th of April, after which a temporary correction occurred. There was a very low volatility in the price movement of $WMT from mid February to the end of March. The share price of Walmart is beginning to drop after a bounce downward occurred at the resistance level.

Daily Walmart Chart

A breakout from the trendlines occurred to the downside which also complements other indications that the price of $WMT has begun a downtrend. RSI has been able to show an overbought position on the chart. The future of Ichimoku shows the $WMT bulls are still in charge of the market. Also, price maintains the upper part of the Bollinger band, which is yet to cross lower. The bears are gradually taking charge of the market.

Walmart Bulls Might Begin To Relent


Ever since Walmart hit an all time high in January 2018, the bullish strength began to depreciate. Though a correction occurred, price only reached the resistance level 105.99. Since then, the Ichimoku has been having a rough shape which gives a dicey signal for the $WMT market. As price of $WMT is currently at 98.32, price might go lower. It is obvious there is a tussle between the $WMT bears and bulls since the all time high was reached.

Indications with the RSI have shown 2 overbought positions in 2018. Price is yet to retrace fully and still maintains the upper region of the Bollinger bands. At two different instances, price crossed to the lower region of the bands but crossed back to the upper region. A breakdown from the support level 89.76 might make price to continue the downtrend to reach 77.92 in the coming weeks.

Are The Wal-Mart Bears Trying To Overpower The Bulls?

In the year 2018, $WMT share price has been stable for the most part with a few volatile moments occurring in price movement. The all-time high of $WMT was in January when price was at level 109.79. Price had dropped since then to around 81.82 which stands as a major support level for the year. Unlike other stocks in October, $WMT broke out of a ranging market to begin an uptrend. Before the upward breakout in October, there was a bullish signal in August.


The RSI on the daily chart showed an initially overbought position and now in November, showing another overbought position. Since price crossed over to the upper region of the Bollinger band in June, it is yet to cross to the lower region. In the early days of October, price touched in the middle line of the Bollinger bands. If the support level is broken, it might trigger a major sell off for $WMT stock. The bearish movement might reach 88.94 from 101.33. Indications show a strong bearish movement might occur. For now, we will wait to see what price will do.