fbpx

GBPCAD Fails To Hit Bottom

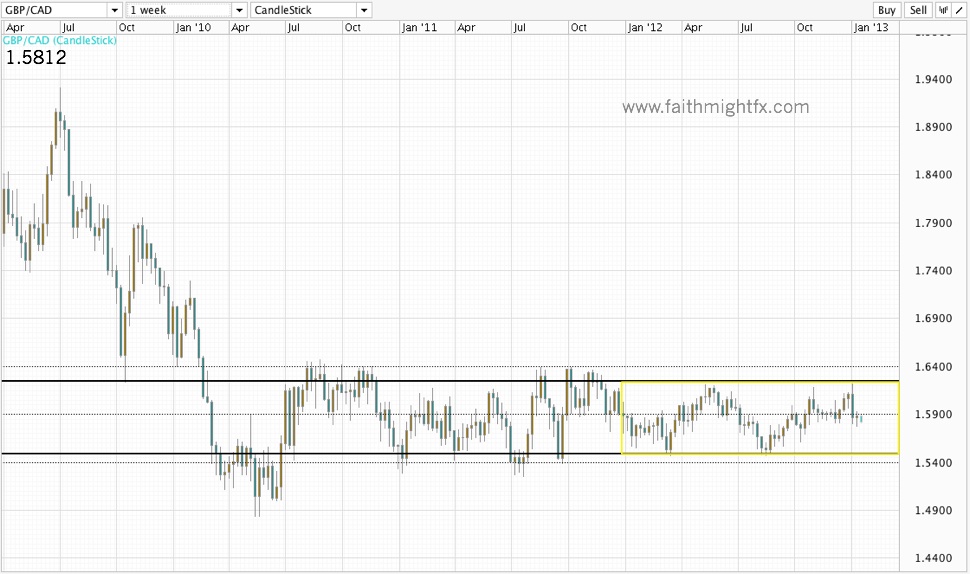
After hitting the top of the range at 1.6214 to begin the new year, the $GBPCAD has been working its way down towards the bottom of the range all month. Last week, it hit a low of 1.5670 before it abruptly turned and rallied higher on the dovish Bank of Canada rate decision. While the BoC left rates unchanged, they downgraded the Canadian economy sending the CAD lower. Prior to this statement, the market viewed the BoC as hawkish helping drive the $GBPCAD currency pair lower. With this shift in fundamentals, albeit temporary most likely, the currency pair has turned higher on a weaker CAD without the pair hitting the bottom of the range at 1.5400.

GBPCAD weekly chart

With the new high last week at 1.5965, is the $GBPCAD poised to go higher still towards the range highs at 1.6200?

GBPCAD daily chart

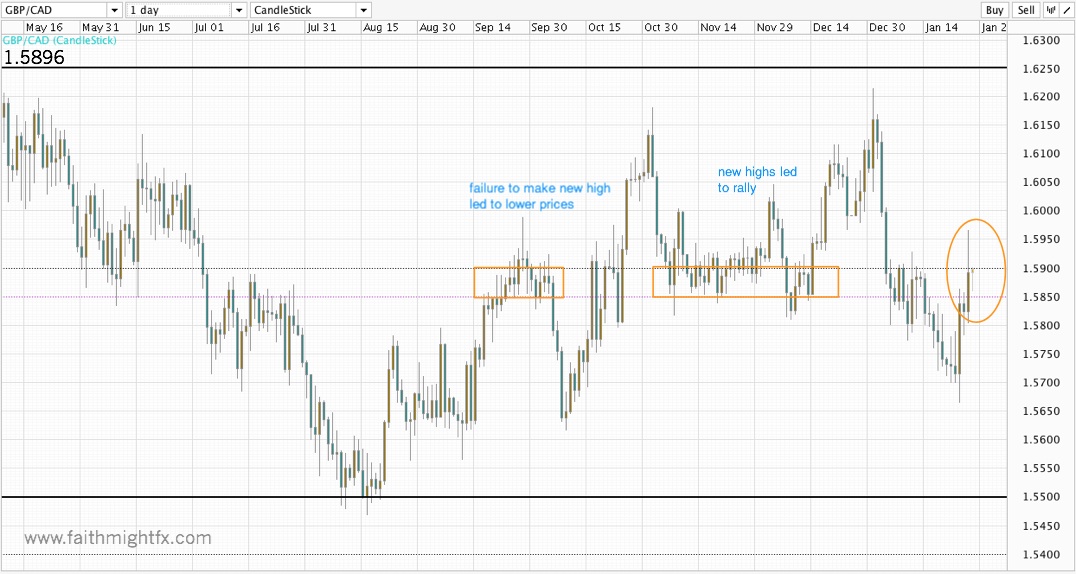
For the answer, watch the area between 1.5850 – 1.5900 for bids. If the $GBPCAD can remain supported by 1.5850 AND make a new high higher than 1.5965, then I suspect this pair can continue higher to the top of the range above 1.6000. After Monday’s trading session, $GBPCAD failed to do either and fell to lows at 1.5780. Price action confirmed its bearish direction with a daily close below 1.5800 support. As Tuesday’s session opens, the pair is poised to finish its business and hit the bottom of the range.

gbpcad

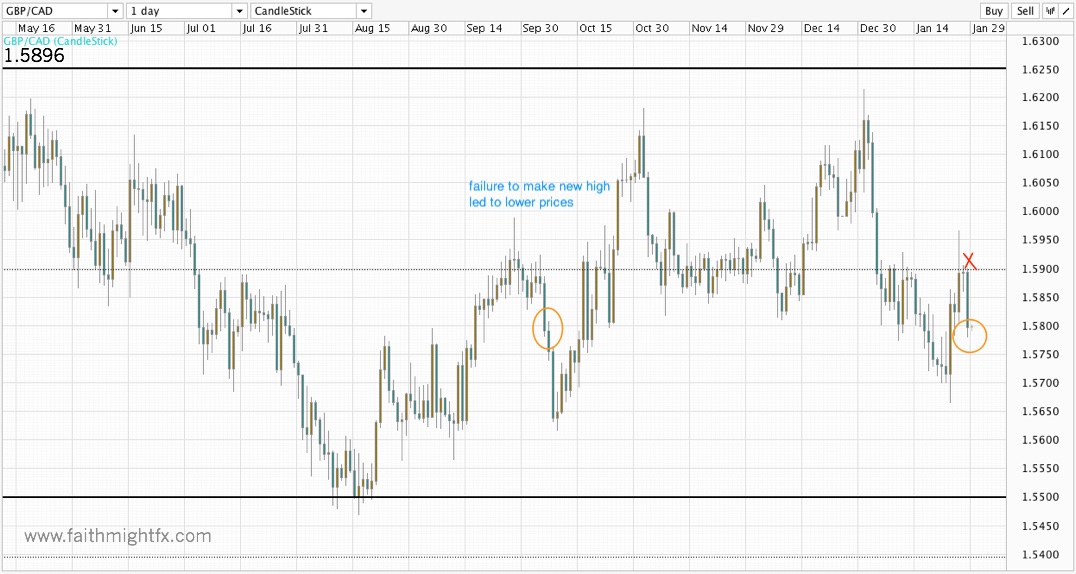
With a very light economic calendar out of the UK and Canada this week, it is entirely possible that we see the CAD continue to strengthen into Canada’s GDP release on Thursday. In contrast with the contraction in the UK economy reported last week, the market may rally CAD vs. GBP on a simply positive number. Any number higher than expected will move the $GBPCAD decisively lower to the range bottom at 1.5400.

This EURGBP Breakout Is Just Getting Started

The $EURGBP has been building a breakout rally since the last quarter of 2012. Then, the pair was still dealing with European sovereign debt issues making it very difficult for bulls to gain any ground. However, the new year opened with great optimism as the ECB’s OMT scheme shore up investor confidence. And the pair has staged an incredible breakout. In fact, the $EURGBP has exceeded expectations with a breakout above the major psychological level at 0.8500.

EURGBP DAILY CHART

And while the psych level is a big one, it is really 0.8530 that was key resistance for $EURGBP.

EURGBP WEEKLY CHART

As last week ended, $EURGBP made highs above 0.8530 but did not manage a close above the resistance level. However, it remained supported by 0.85 and closed the week above the major whole number. Now, as the new week opens, the pair has climbed back above 0.8530 with the hourly chart registering candle closes above the resistance level. This is good news for bulls as price action continues to be very constructive. A pullback into 0.8500 and 0.8470 will be met by bids as price targets the next key resistance level at 0.8670.


Sterling Digest, January 27 2013: follow the trend

KAL Cartoon in The Economist
Can the British economy really afford to abandon the EU?

Last week was epic for sterling. The $EURGBP rallied to new highs above the psychologically important 0.8500 level. The $GBPUSD, $GBPNZD, $GBPAUD, and $GBPCAD all fell to fresh 2013 lows early in the week heading to the Bank of England minutes release. However, when the BoE minutes revealed that it was ready to end quantitative easing and unemployment in the UK fell to new lows, sterling rallied off the lows. In fact, thank in large part to the Bank of Japan, the $GBPJPY rallied to its highest levels in over 2 years. Despite policy makers in the BoE calling for an end to QE, the economic realities of the UK may not allow that to happen. And since BoE meeting minutes are backward looking, sterling may not be able to sustain its Friday gains in this new week of trading. With a very light economic calendar from the UK this week, expect sterling to trade very technically and at the whims of the USD with the $FED rate decision looming mid-week.


Image credit


Sterling Digest, January 20 2013: Safety issues

Goodbye Europe. The Economist cover

Sterling has weakened considerably to kick off 2013 with several themes at play here. One is the fundamental fact that the British economy stands to enter a triple dip recession having ended 2012 with no growth. Secondly, the EU is looking  much more attractive to investors. While 2012 will be remembered as the year investor fled euros and parked their money in sterling and swiss francs, 2013 sees these same investors putting their money back in euros. Lastly, I have noticed that sterling is correlating to the USD much differently than it had in 2012. While a strong GBP saw a strong USD (and visa versa), that correlation is no longer. Now sterling is weak across the board with currencies of the stronger economies (CAD, AUD, NZD) leading the charge.

Image credit

GBPUSD Flips Bearish

The $GBPUSD has finally closed below 1.60 for the 1st time since November. And as such, I have finally acquiesced my bullish stance on $GBPUSD.

GBPUSD daily chart

Moves above 1.60 will be met by sellers all the way into 1.6077, the 50% Fibonacci retracement level. However, we should be aware that the 1.6050 level has previously capped rallies when we closed below 1.60. Price then fell to lower levels.

Bears target the 1.5828 low with possible support coming in at 1.5950. Despite the clearly bearish close, this currency pair continues to be very choppy due to USD quirkiness. Best to be patient and deliberate when taking trades in this market.


GBPCAD Stays Rangebound

$GBPCAD in in a long term bear trend evident on the weekly chart. However, it has spent the last 2.5 years stuck in a wide 1000-pip range between 1.6400 and 1.5400.

GBPCAD weekly chart

It also interesting to note that this range has been narrowing over the last 12 months. A narrowing range is typically a small hint that the prevailing trend is getting ready to resume. Fundamentally, the Canadian economy has posted some surprisingly strong numbers so far in 2013. Meanwhile, the British economy is not fairing very well at all. This sharp contrast in fundamentals helps fortify the long-term bear trend.

For now, the $GBPCAD is very much rangebound. Even a close below the range bottom at 1.54 still would not signal a resumption of the long term trend. It would take a close below the 2010 lows at 1.4835 before this pair can truly break out to the downside. And that level is still a long way off. Best for now to trade the range.

AUD Finds Its Legs

Looking to the left of the chart, we can see that previous breaks lower that closed the week below 1.55 saw momentum carry price lower.  Even on a smaller time frame, the daily chart, a candle close below 1.55 followed by a subsequent candle close below 1.55 saw a price drop as low as 1.5250.

This was how I closed my new year post on the $GBPAUD. In today’s Wednesday session, the pair actually broke that support at 1.5250 to reach a low of 1.5191 before bouncing back to the 1.5250 to end trading just below the former support level.

GBPAUD daily chart
Minutes before Chinese data released

Now China has just released its trade balance numbers (9:00pm EST) and they beat market expectations by a wide margin. As such, the AUD is rallying big time in reaction to the positive news. Already down 70 pips in 20 minutes, the $GBPAUD has made new lows than the previous 1.5190 lows and is still falling. With no real support until the 1.50 major psychological level, $GBPAUD is on track to test its 2012 lows at 1.4700.

Euro Gains Optimism in 2013

Last I wrote on the $EURGBP, the pair was building a bullish scenario above the major psychological level at 0.8000. Since then, the $EURGBP managed to move higher making new monthly highs at 0.8230 to end 2012.

Now, the fundamentals have aligned to make this trade even more attractive. First, the Olympic glory has faded from the British economy with calls for a triple dip recession in store for 2013. EU fundamentals, on the other hand, have stabilized as ECB President Mario Draghi managed to calm financial markets with new QE schemes introduced and bolstered in 2012. To be clear, the economies in Germany, France, and the PIIGS are still very weak. But after dealing with Greece and the PIIGS for so long, the UK managed to get through 2012 with very little market attention to its own weak economic state. Now that the ECB has finally decided to shore up the EU, the market’s attention has now turned to the UK. This new contrast in fundamentals could help bolster the $EURGBP to new highs in 2013.

 EURGBP daily chart

Since the new December high, the pair has corrected lower to the key 0.8100 level to kick off the 1st trading days of 2013. Despite spikes below the level, $EURGBP never managed any bearish momentum below 0.81. After the week’s close well above 0.81 and the new shift in fundamentals, look for this pair to make new highs above 0.8230 in the days and weeks ahead.


Sterling Digest, January 5 2013: Trust the crosses

Cover artwork from The Economist 2012 Christmas double issue
Happy new year?

To kick off the new year, the global fundamentals still stink. Currency wars still rage across the globe. American politics continue to debase the world’s reserve currency. And after entering recession in 2012, the British economy is poised for depression in 2013. As terrible as the fundamental landscape seems, I agree with @kathylienfx (read her articles below). The trades that make the most sense in 2013 are the currency cross pairs. While the majors are mired in USD murkiness (fundamentals vs. risk appetite), the crosses more clearly reflect the fundamentals. And as such, these currency pairs seem to have the best trading opportunities in the current forex market environment.


Image credit


Be US Dollar Wary in 2013

The USD is mired in political nonsense. From the debt ceiling showdown last summer to the fiscal cliff this new year, American politics has toyed with the USD for much of 2012. If magazine covers are any indication, we can expect more ratchet politics in 2013.

Another great (and hilarious) @BW cover on TwitpicThe Economist cover: America turns European


With the fundamentals so foggy, I have become very weary of trading the USD. Its price action has been a reflection of both risk and fundamentals which hasn’t always led to very clear swing moves. And as such, I have been trading my favorite currency pair less and less these days.

The $GBPUSD moved higher as expected since the Thanksgiving move back above 1.60. When 1.63 held as resistance, it looked as though cable would remain rangebound. But thanks largely to the fiscal cliff nonsense, cable staged a breakout above the 1.63 resistance level and managed a daily candle close above 1.6300.

Despite the current bullish momentum, the $GBPUSD is still rangebound in the longer term…We still do not have true direction in this pair until it can close above 1.6300 or below 1.5230. (November 25, 2012)

Though we got a daily candle close above 1.63, price crashed. But cable is not exactly bearish…yet.

GBPUSD weekly chart

The 1.6381 high broke a triple top at 1.6300-10 and rallied 70 pips higher before exhausting. In addition, the new 1.6381 high is a higher high after price held the 61.8% Fibonacci retracement level which is very constructive price action.

GBPUSD weekly chart

The recent price drop is still merely a correction of the rally. This quote I saw today on StockTwits also makes me think that the recent high is a range expansion. If that plays out and cable holds the 61.8% Fibonacci level at 1.6039, we can expect $GBPUSD to rally back above 1.63. However, if 1.6039 is broken below, a daily close below 1.60 confirms the currently bearish price action.