fbpx

Sterling Digest, 30 July 2013: forward guidance

Mark Carney as Buzz Lightyear cartoon
FORWARD!

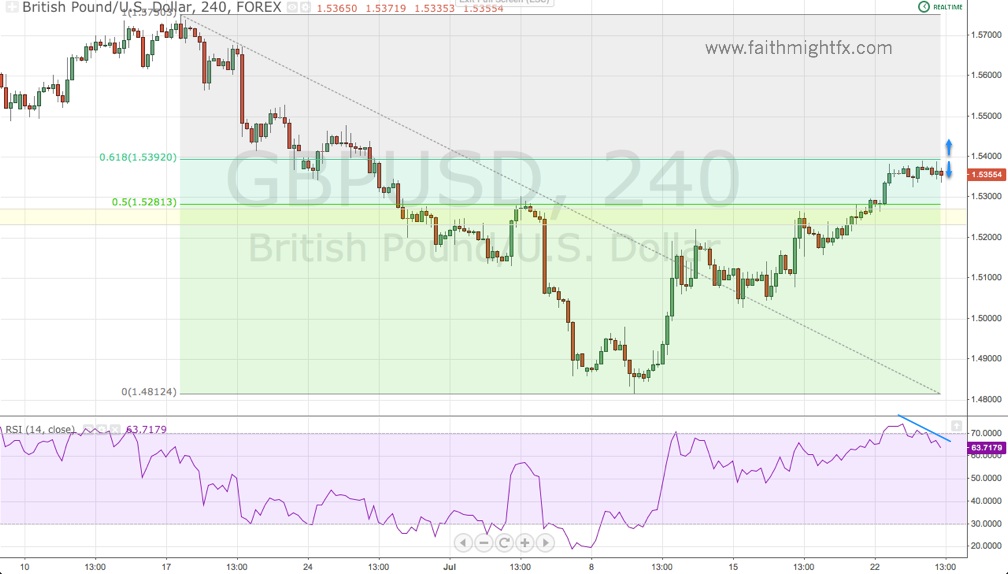
The new fancy buzzword in sterling markets is forward guidance and Carney is supposed to deliver a hardline version of it after the Bank of England (BoE) announces its decision on monetary policy on Thursday. However, there are mixed views on how markets will react. Some expect $GBPUSD to move higher to challenge to the 2013 highs. Many others, on the other hand, believe the $GBPUSD to move back below 1.50 in reaction to forward guidance. Given sterling’s reaction to the soft forward guidance delivered after last month’s BoE meeting and in light of a progressing economic recovery in the UK, it appears that anything is possible. It quite likely sterling satisfies both bears and bulls in the 2nd half of this year.

Image credit (Read the article too)


GBP/USD Ahead Of Key Data

The $GBPUSD has met all expectations here with its move right into the 61.8% Fibonacci retracement level of the latest bearish wave.

GBPUSD 4HR CHART

The market now waits on the UK GDP release. The expectations in the market are high for a positive beat which actually increases the downside risks in cable. If GDP disappoints, I believe the rally will be over. The technicals support a resumption of the bear trend with the 61.8% Fibonacci level capping the rally so far and a diverging RSI at these new highs. However, an upside beat or even an inline print will fuel this rally right back to 1.5500. A daily close above this psychological level will mark the beginnings of a reversal in the $GBPUSD.

Trade what you see.

Mentioned above:

UPDATE:

I corrected my thoughts on an upside or inline GDP print in my interview chat with FXStreet (at the 3:00 mark).

Sterling Digest, 23 July 2013: #royalbaby bump

royal baby announcement
It’s a #royalbabyboy!

The UK monarchy has a new addition and the hype surrounding the birth of the new prince could arguably be called overdone. But sterling opened the week to news that Kate Middleton was in labor and rallied very nicely in the wake of the good news. $GBPUSD made new highs at 1.5384. $EURGBP broke to new lows at 0.8582. The baby has been here less than 24 hours and he has become responsible for lifting the UK into economic recovery. Talk about influence! In all seriousness though, with the economic calendar extremely light this week, sterling traders are looking ahead to Thursday’s UK GDP release. In light of the some robust numbers from retail sales and PMI in the past weeks, GDP is expected to surprise to the upside. Such a surprise will continue to fuel sterling strength and possibly induce a reversal in the $GBPUSD and $EURGBP. However, GDP expectations are so high that a disappointment may just end the rally.

Image credit


Decision Time For EUR/GBP

The $EURGBP is at a crossroads at this 0.8600 level.

EURGBP daily chart

Of particular interest is this zone between 0.8600 and 0.8570. It has been a buy zone when $EURGBP has traded above it and a sell zone when the pair has traded below. As the $EURGBP entered the zone last week, it was met with bids as the pair closed the week at 0.8609. Now as trading kicks off in this new week, price has slipped back into this zone. Where will $EURGBP go from here? With a very light economic calendar this week, this pair will be particularly driven by the UK GDP and German IFO releases. Either the bulls return or the bears step in.

Trade what you see.


EUR/GBP Reversal At Hand

I hardly think so. But yesterday I read 2 analyses on $EURGBP that spelled out opposing views on the future direction of the pair. And I think, as traders, it is always important to consider both sides of a trade no matter your own opinion on price action.

The Bear Case

EURGBP monthly chart

Despite the recent new highs (today at 0.8710), price does remain in this downward channel that has been forged over the past 4 years. The fundamentals weakly suggest that the UK economy is doing relatively better than the rest of the EU economy. The bears do have a case especially at these levels.

The Bull Case

After trading in a range for over 10 weeks, the $EURGBP broke that range to the upside. Typically, a breakout ensues in the direction of the break when there has been a well-established range. And the $EURGBP did break out to a high today at 0.8710. However, the Bank of England minutes of Governor Carney’s 1st meeting revealed a much more hawkish central bank. Additionally, UK unemployment data came out much stronger than expected. As such, the $EURGBP has pulled back into the Fibonacci levels of the rally after the range break.

EURGBP DAILY CHART

Even on this pullback, the bullish picture remains intact. The market now awaits the testimony from Fed Chairman Ben Bernanke. Dovish comments from Bernanke could support the EUR and push the pair back above 0.8700. However, if the pullback extends beyond the 61.8% Fibonacci level, only a daily close below 0.8574 would indicate bearish price action in the short term targeting 0.8500.

Trade what you see.

Mentioned above:


Sterling Digest, 16 July 2013: beware the squeeze

Illustration squeezing housing building
The squeeze always shakes out the weak. Don’t be weak.

Sterling sits on a fence depending on which currency you trade it against. After hitting new 2013 lows last week, the $GBPUSD has since rallied as high as 1.5220. Unable to get back below 1.50, there is a threat that cable rallies even higher. The $GBPAUD, after hitting new 2013 highs, has since retreated back to 1.6350. The $EURGBP is enjoying a nice, albeit slow, breakout to the upside reaching as high as 0.8700. While this week’s data threatens to be GBP-negative, particularly the release of the Bank of England meeting minutes, pay attention to price action. Lower prices may simply translate to better buy opportunities for rallies. With many GBP bears in the market, the squeeze higher could come slowly and painfully. Be aware.

Image credit


Sellers Strong But May Need More Time

The $GBPUSD rallied back to the support/resistance zone between 1.5230-70. But the rally exhausted far earlier than expected. In fact, offers stepped in ahead of the zone as price topped out at 1.5220 before falling back to 1.5100 level to end the week.

Now at the start of the week, sellers have taken the $GBPUSD below the 1.5075 support level. The early morning bounce in the European session was capped by the former support level and led to further losses to  1.5027 lows.

GBPUSD 4hr chart

However, the psychological level at 1.50 is always the big obstacle for cable when we trade at these levels. With the disappointing US retail sales sending $GBPUSD higher above 1.50 (to 1.5115 so far), it is likely now that price may, in fact, rally higher back to 1.5230-70 support/resistance zone and even higher into the Fibonacci levels on the 4 hr chart. This failed attempt lower is likely to be met with more fuel for a corrective rally to new highs this week. Of course, this scenario largely depends on how the market reacts to the slew of US and UK economic data including Bernanke’s testimony before Congress and the release of the Bank of England meeting minutes.

Trade what you see.

Mentioned above:


Bernanke Talks Down USD

Bernanke gave a speech yesterday afternoon commemorating the 100-year history of the Federal Reserve. However, it was the Q&A portion of the program where Bernanke revealed that the $FED monetary policy could remain accommodative far long after the 6.5% unemployment rate (forward guidance) was reached. I, myself, was not expecting the $FED chair to be as dovish as he was. US economic data has been fairly positive. The US NFP released Friday was a surprisingly  robust report. The economy seems to be going in the direction the $FED wants and expects it to go. Nevertheless, Bernanke communicated that monetary policy will remain accommodative even as the economy seemed to improve.

From there, the USD was pummeled. $GBPUSD moved nicely from 1.4910 to 1.5050 during Bernanke’s Q&A. Then in a blink of an eye price action jumped to new highs at 1.5193. It was incredible to watch in real-time.

GBPUSD 4HR CHART

Now that $GBPUSD has taken out the Fibonacci retracement levels of the latest bearish wave, all eyes have returned to the 1.5230-70 support-now-turned-resistance zone (yellow). The 50% Fibonacci level of the entire collapse from 1.5750 to 1.4813 lies just above there at 1.5280. Even if price manages to rally above 1.5300, cable remains bearish until there is a daily close above 1.5500. We can expect rallies from current levels to be met viciously with offers. Given capital flows, it makes more sense for swing shorts to come in at 1.5250 and higher in order to take out the 1.4813 lows. Thus, I believe we still have some more $GBPUSD rally left in the very short term.

Trade what you see.

Mentioned above:


Sterling Digest, 9 July 2013: the Carney effect

Mark Carney face on 20GBP note
Too soon? Or not soon enough?

Last week, on the 4th of July, Mark Carney made his 1st move as Bank of England governor. While the BoE did not move on monetary policy, it was Carney’s introduction of forward guidance that sent sterling tumbling across the board. Under the Carney effect, GBP has been unable to recover as the fundamentals have completed shifted in a very unexpected manner. Many market participants expected Carney to wait until next month to bring any changes to monetary policy. Carney’s big surprise  should bring sterling to new lows across the board during this 2nd half of the year. The Carney effect will only be exasperated by poor economic data as we saw today and merely slowed, not reversed, by any upside surprises in data.

Image credit


The Range Breaks

Last week the $EURGBP finally broke the range. It broke that range to the upside and confirmed with a close above the 0.8600 range top.

EURGBP DAILY CHART

$EURGBP opens the new trading week trading above 0.8600 level for the first time since March. This is a bullish move with a potential move to 0.8750 now in the works. Any dips should be supported by the former 0.86 range top. A daily close below 0.8570 invalidates this bullish setup.

Mentioned above: