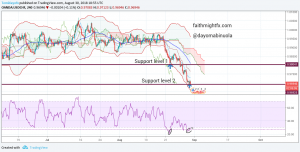
The US dollar has been losing to the Swiss Franc since the 20th of August, 2018. The Swissie might relinquish its strength to the greenback. On the 4hr chart using the RSI, there has been two obvious oversold spots. The last time price passed through the 2nd major support level was in the latter part of April, 2018. Price tried to maintain the support level 1 but continued the downward trend till a new support level was reached.
These indications might lead to a change of trend; though the ichimoku shows a continuous downward trend. Also, it shows on the 4hr chart that the candlesticks have been ranging for almost a day. An uptrend might resume soon in favour of the dollar. Investors might choose to go long on the USD majorly because its long due, ever since the first support level was breached. Price has also touched the edge of the Bollinger band and now on range, ready for a breakout on the opposite direction.

Leave a Reply