fbpx

Yen Positioning for the New Year

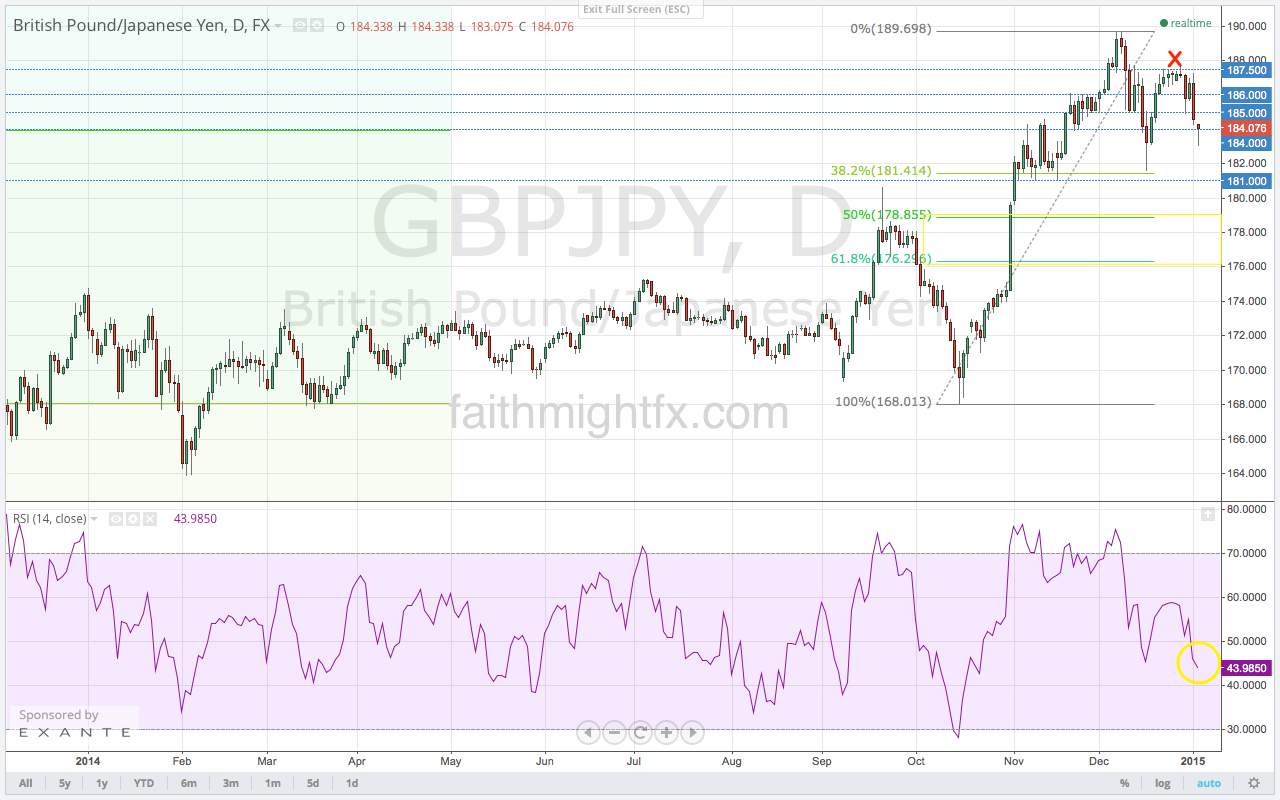
After finding support at 181.41, the 38.2% Fibonacci retracement level, the $GBPJPY was able to stage a rally back to the 187.50 highs. However, the rally petered out before it could make a high higher than the previous 189.69 high. This leaves the bias to the downside for price action coming into this trading week. As such, price has moved lower to close last week at 184.63.

GBPJPY daily chart Jan 4 2015

With the RSI already printing a new low on Friday’s price action, price has bias to move lower still. Given that the 38.2% Fibonacci support resulted in a failed new high, I expect that the $GBPJPY make a move into the 50% and 61.8% Fibonacci levels.

However, the 181.00 support level is very formidable. If we look at the bigger timeframes, we can see that 181.00 has maintained support for price even with several false breakdowns when price trades at these current levels. Now that price has moved lower this week, 181.00 is the level to watch.
The Battle for Weakness

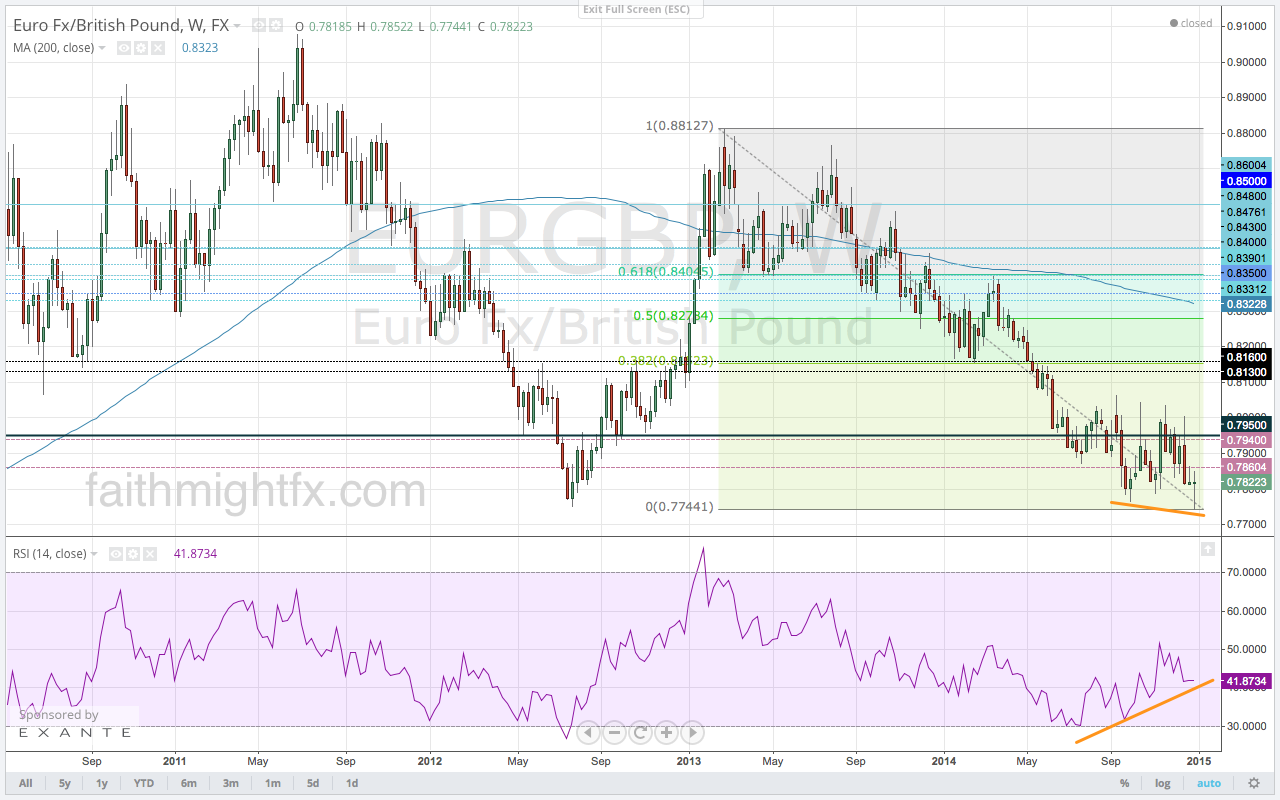
The $EURGBP broke to marginally new lows in last week’s trading. Only slightly new, by 22 pips, but new lows nonetheless. The EUR collapsed against all currencies because European Central Bank Governor Mario Draghi continued to deliver dovish rhetoric last week. So on the back of his comments, the $EURGBP fell down to the long-term support at 0.7750.

The $EURGBP had been rangebound for months heading into the new year between 0.8050 and 0.7750. Upon pressing into new lows last week, we note that the RSI on the daily chart put in a higher low. In fact, this bullish divergence on the RSI is even more pronounced on the weekly chart.

EURGBP weekly chart as of Jan 4 2015

The RSI is very suggestive of bullish price action. However, the bulls cannot get too excited. Because also on the weekly chart is a candlestick candle of indecision. For when you see that the $EURUSD has fallen to multi-year lows, it stands to reason that the $EURGBP should have broken this long-term support level quite handedly. However, what we see is that GBP weakness overtook this pair as buyers stepped in at the support level. So given what we see on the weekly chart with this false breakdown coupled with the bullish divergence in the RSI, the prudent action may be to set up at the lows for a move higher especially as we see continued weakness in the $GBPUSD.

GBP Weakness Just Getting Started in 2015

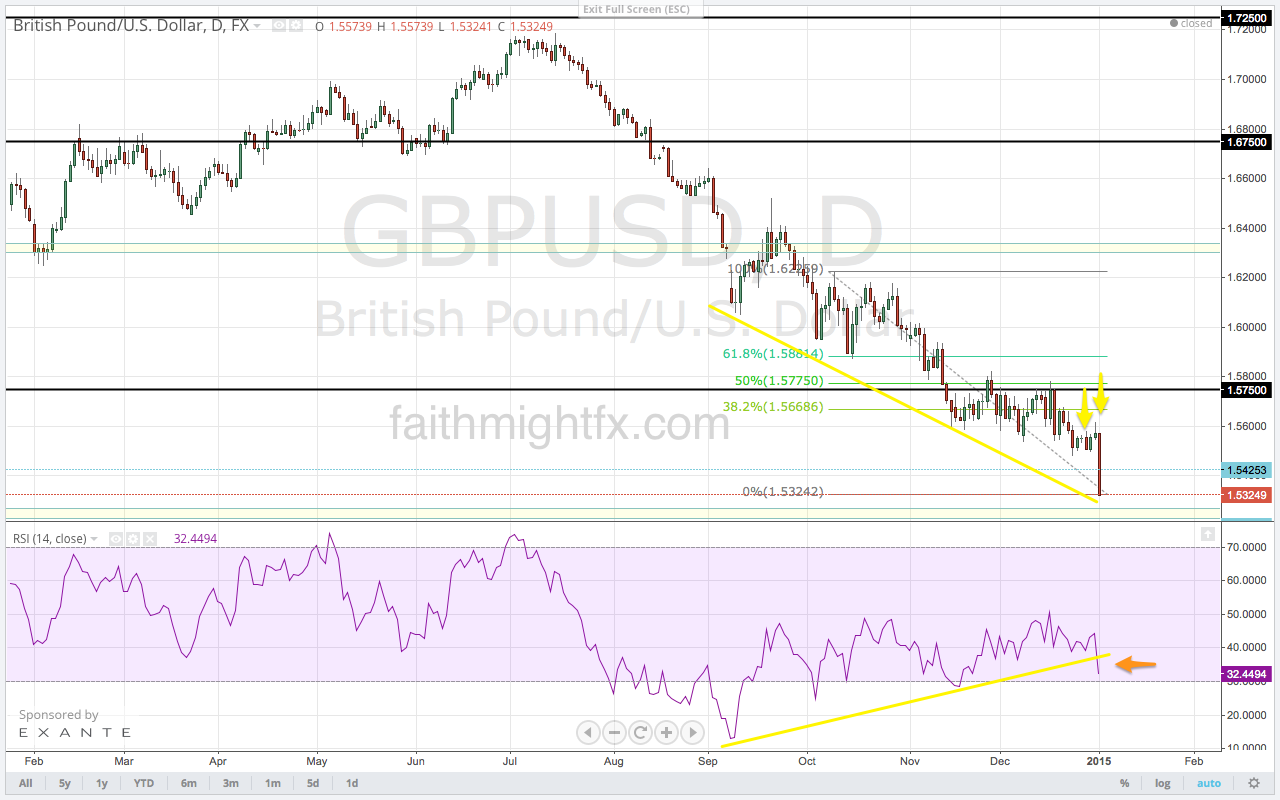
Happy new year! And it certainly has been a good one so far for GBP bears. On the last trading day of 2014 (December 31) and the 1st trading day of 2015 (January 2), the $GBPUSD completely broke down. Economic data out of the United Kingdom has done a complete turnaround from the economic data of 2013. Friday’s manufacturing data missed and sterling broke support nearly across the board. The weakness continued this week with a miss in both construction and services PMI. Both releases are sending sterling lower still against every major currency.

GBPUSD daily chart on Sunday Jan 4

Until Friday’s breakdown, the limited downside was very restricted by the bullish diverging RSI that had been developing since September. But price didn’t care at all about the diminishing selling momentum as $GBPUSD continued to probe new lows. Now that price has broken down again to new lows, we see that momentum is finally following suit. The momentum of Friday’s price action has broken the bullish trendline on the RSI. This break lower in the RSI suggests that $GBPUSD will continue to fall lower. But remember that nothing moves in a straight line. A bounce is very possible as price heads into 1.5150, 1.5100 and 1.5000 support levels. Trade what you see.

Don’t Trade Against The Central Bank

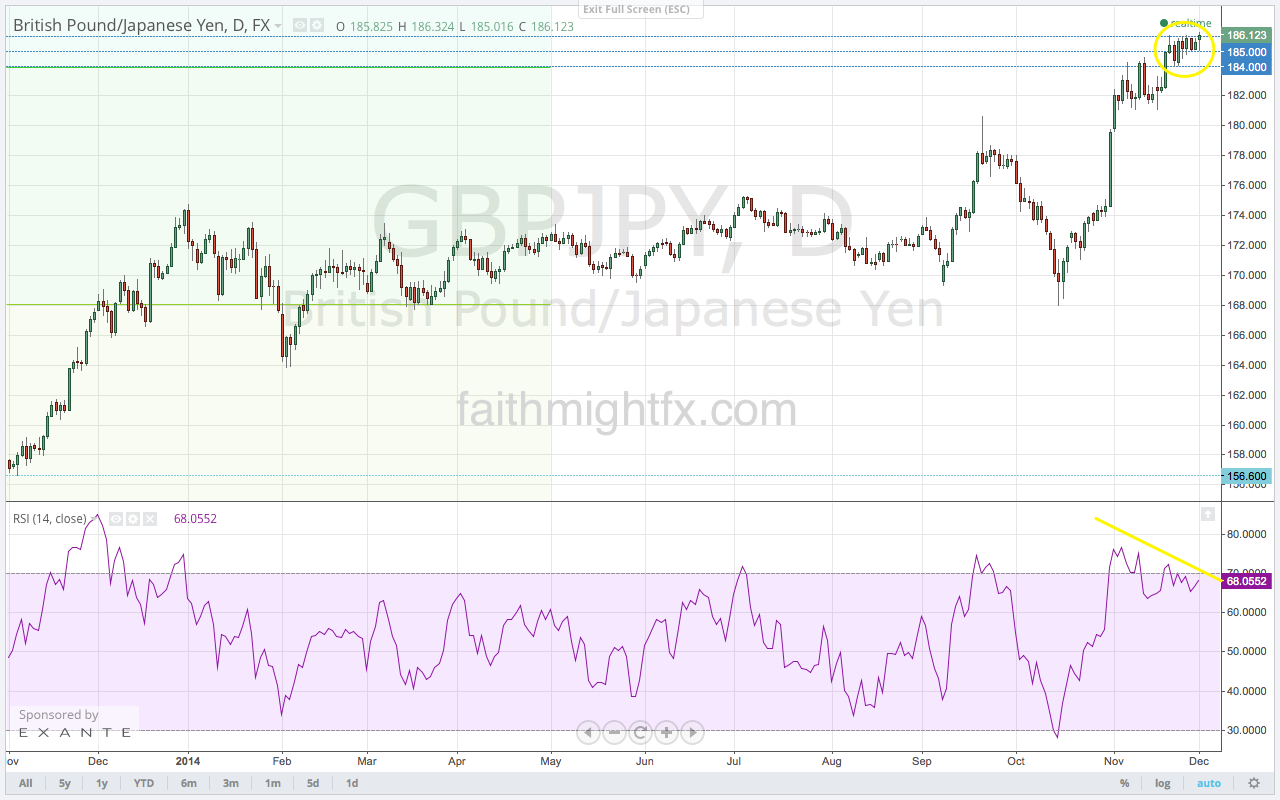
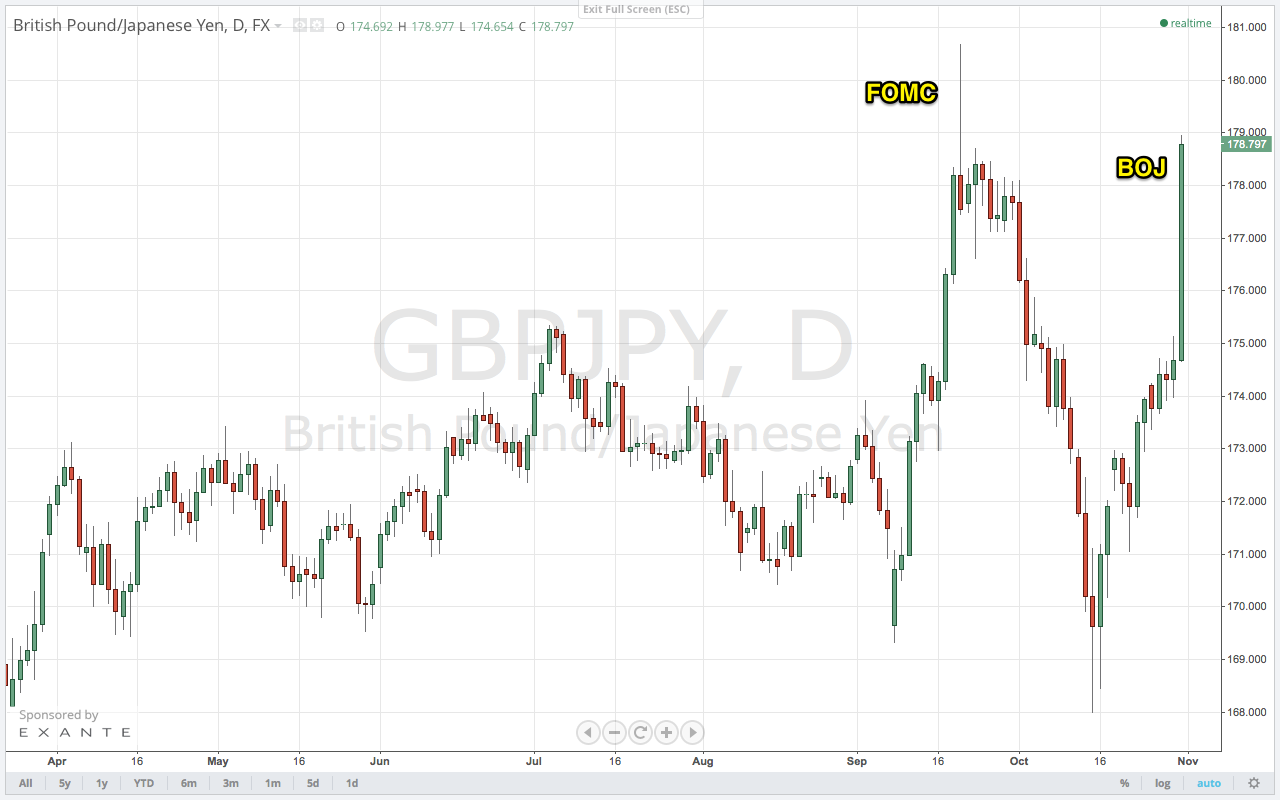
The Bank of Japan has its massive QE program well underway after announcing it almost 4 weeks ago. The central bank has committed to massively supporting its economy and markets to the decline of the JPY. With little reprieve in sight, many expect the short JPY trade to work for weeks to come.

GBPJPY daily chart

While it looks like the beginnings of a breakout as price break the top of the range at 186, the RSI is telling quite another story. This bearish divergence in the RSI relative to price gives the bull in me pause. Perhaps there is another correction lower still left in the GBP/JPY. The timing for such a correction couldn’t be better with an expected dovish outcome from the BoE this week.

Given the highs and the bearish diverging RSI readings, no new buys should be initiated at these price levels. While it is a tempting short at these resistance levels, we will not trade against the Bank of Japan regardless of the charts. Instead, the higher probability play is to set up to go long on a pullback. A close above 186.00, however, is also a signal to initiate long positions if we don’t get a move into support from here.

GBP/NZD Sets Up

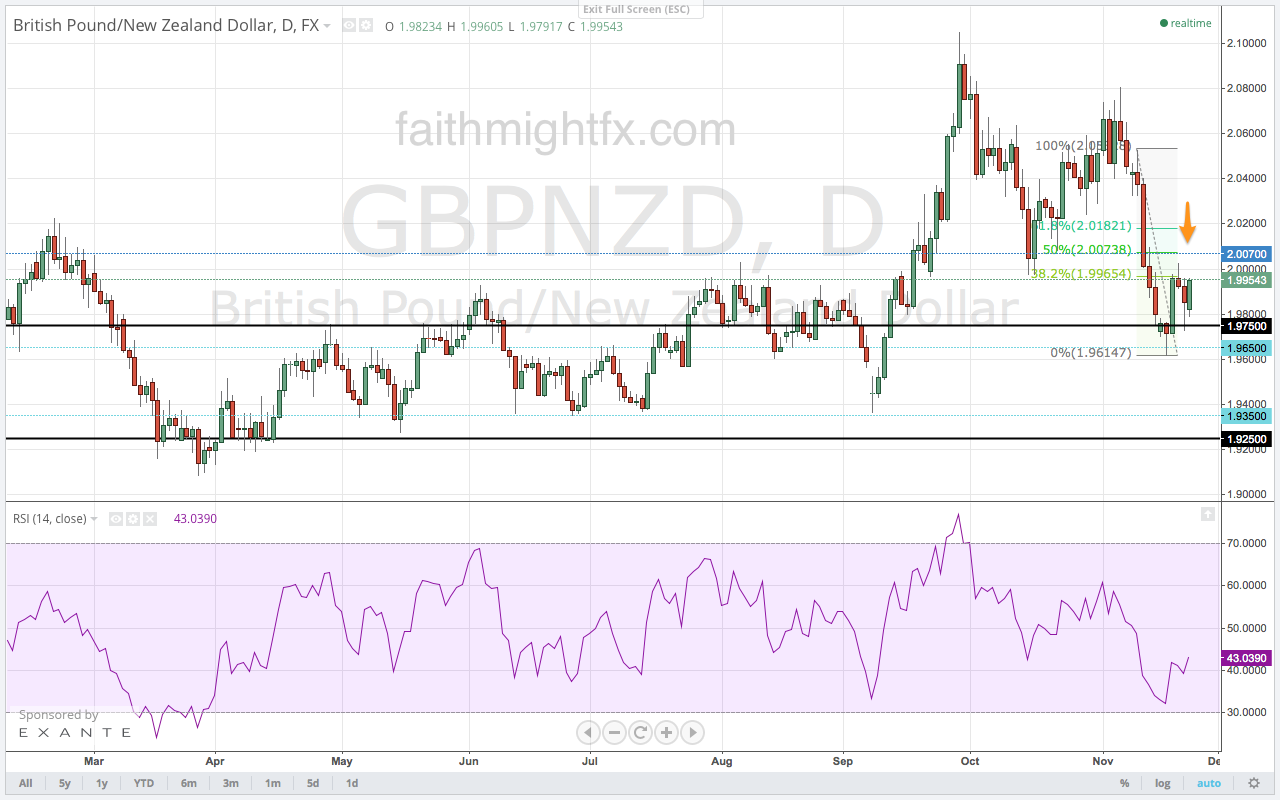
The GBP/NZD opened the week very bullish as signaled by its close above 1.9750. The rally this week has already recovered all of last week’s losses. However, the GBP remains a sell as the rally this week has been capped at the 61.8% Fibonacci retracment level.

GBPNZD DAILY CHART


Double Whammy

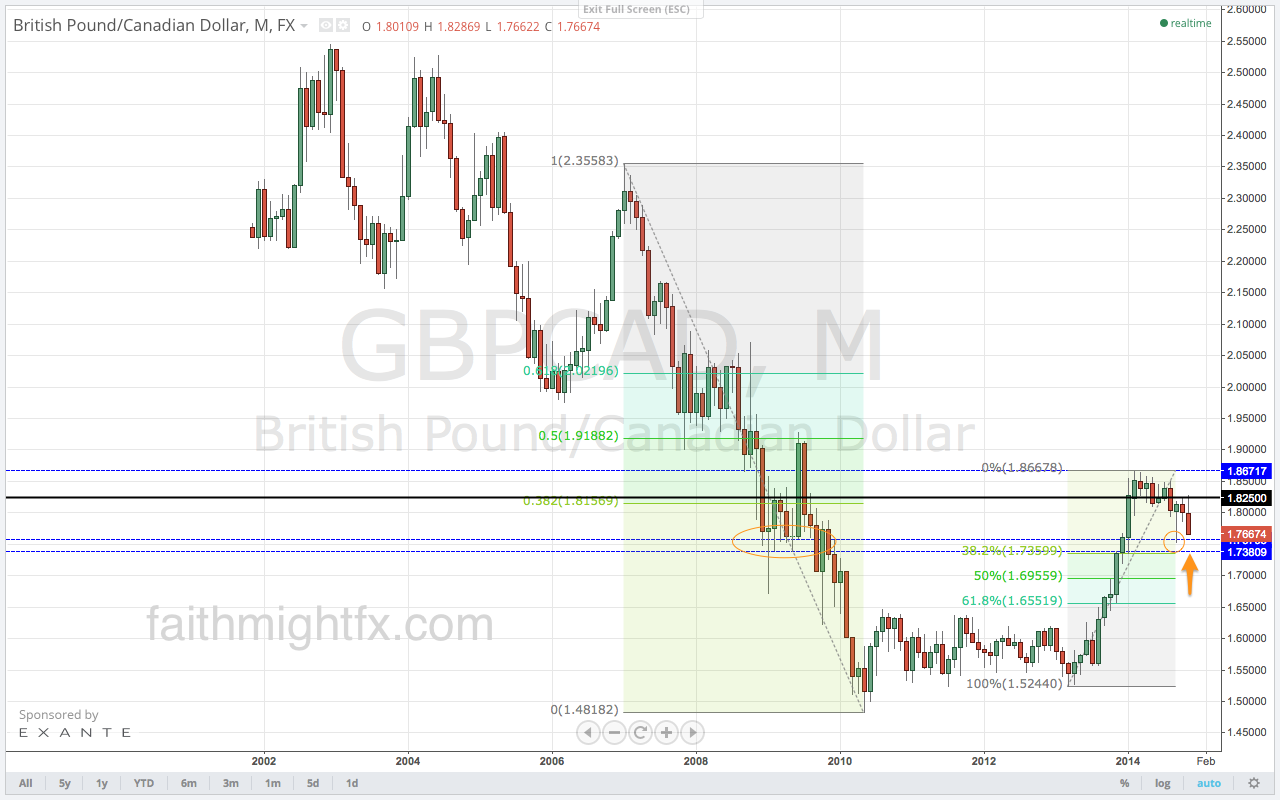
The CAD has enjoyed considerable strength as the Canadian economy strengthens on the back of its robust trading partner, the United States. As a result, we have seen a huge move lower in the $GBPCAD as sellers enjoy the double whammy of a strong CAD and a weak GBP.

GBPCAD monthly chart

As $GBPCAD moves lower, we see that there is a significant support zone ahead that dates back to 2009. Price found support at the top of the zone at 1.7580 back in September so this is the level to watch. Until we get to the previous low at 1.7580, the $GBPCAD can continue to benefit from the double whammy. However, watch price action in this support zone. Profit-taking is sure to take place given the move lower. However, it remains to be seen if a corrective rally on profit-taking turn into a reversal higher or if the $GBPCAD can break this long-term support zone and continue even lower.

The Setup of the Year?

Though I don’t trade commodities, I have to agree with CEO Technician here. Oil does look very interesting here. Then I think about the implications of a bounce in oil on the forex market. Everyone is bearish oil. The decline broke key support levels with price going for this long-term, big-time support level around $75. While the USD had its own strong reasons to rally, the weakness in oil did serve as a nice tailwind.  Now as price heads into a huge support zone, can oil continue to weaken?

All eyes on crude.

Euro Looks Higher

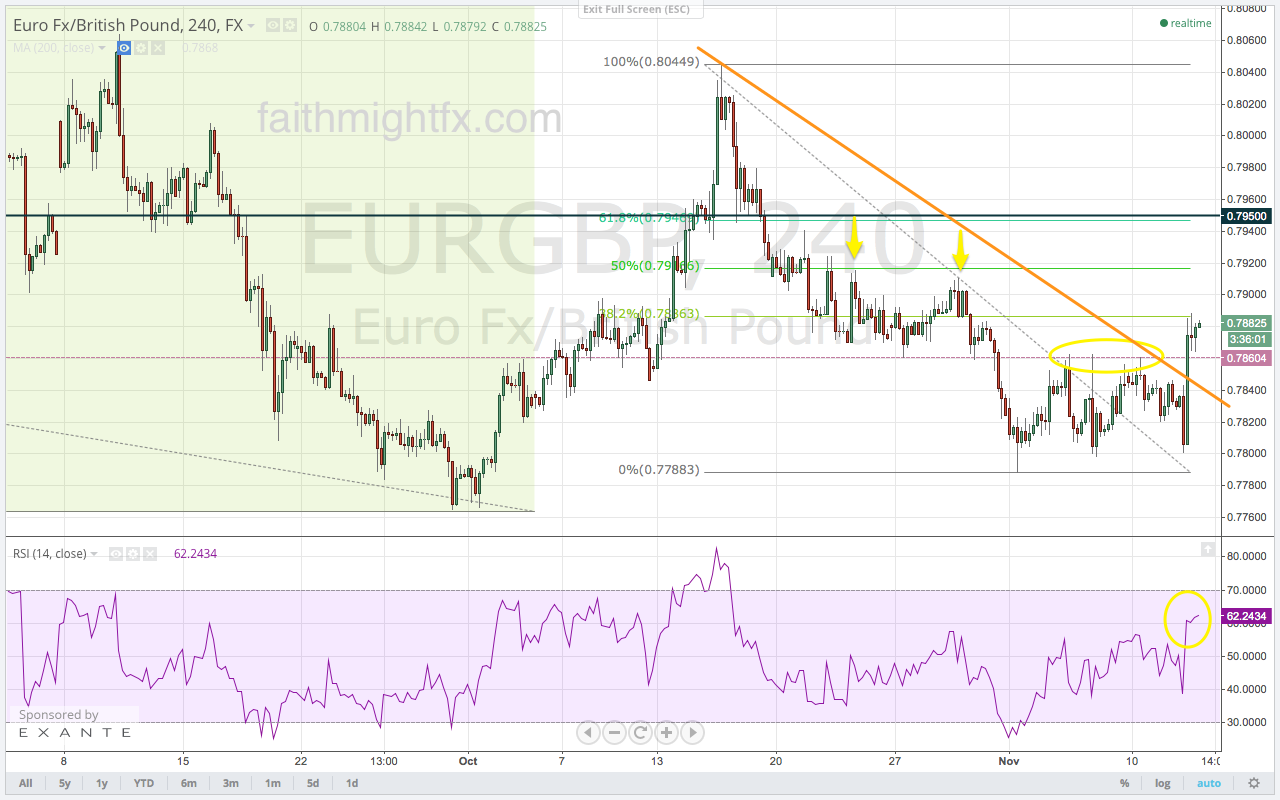
So far, the $EURGBP remains stuck in its huge wedge formation. Price has found resistance all trading session at the 0.7860 level. However, swing traders are looking to the 38.2% Fibonacci level at 0.7880 and 0.7920-70 for an indication of supply and demand. That’s the upside potential.

Since publishing the above at the start of October, the $EURGBP did go higher to 0.8050-70 only to fall back again and put in a higher low. In fact, there are several factors at play currently that may suggest that price could actually rally a little higher still:

  • Euro sentiment is a extremely bearish levels. The premise goes that when sentiment for asset classes are at extreme levels it is usually a signal in the opposite direction. Thanks to J.C. for sharing his EUR sentiment chart at Stocktoberfest.
  • GBP weakness fundamentally continues to show through in the economic data. Data releases are still a mixed bag but a year ago we had much stronger data released month-over-month than we having been getting now in recent months.
  • Today’s break of resistance is supported by a break higher in the RSI which has supported a move higher since price put in the higher low last week.
  • Bonus: For all you trendline followers, today’s price action has moved the $EURGBP comfortably above the trendline resistance coinciding nicely with the 7860 resistance level was capping price all week .

EURGBP four hour chart

On the bigger timeframes, the $EURGBP still favors bears long-term. However, it is hard to ignore the price developments of the past 24 hours that point to higher price levels. Expect swing sellers to set up at the higher levels. But if price rallies through the 0.8050 resistance levels, expect the EUR to look for higher still.

Another Bailout

Kuroda said the BoJ’s easing was unrelated to portfolio allocations by the Government Pension Investment Fund (GPIF), but the effect of the day’s two major decisions means that the central bank steps up its buying of Japanese government bonds, offsetting the giant pension fund’s increased sales of them.

Source: International Financing Review


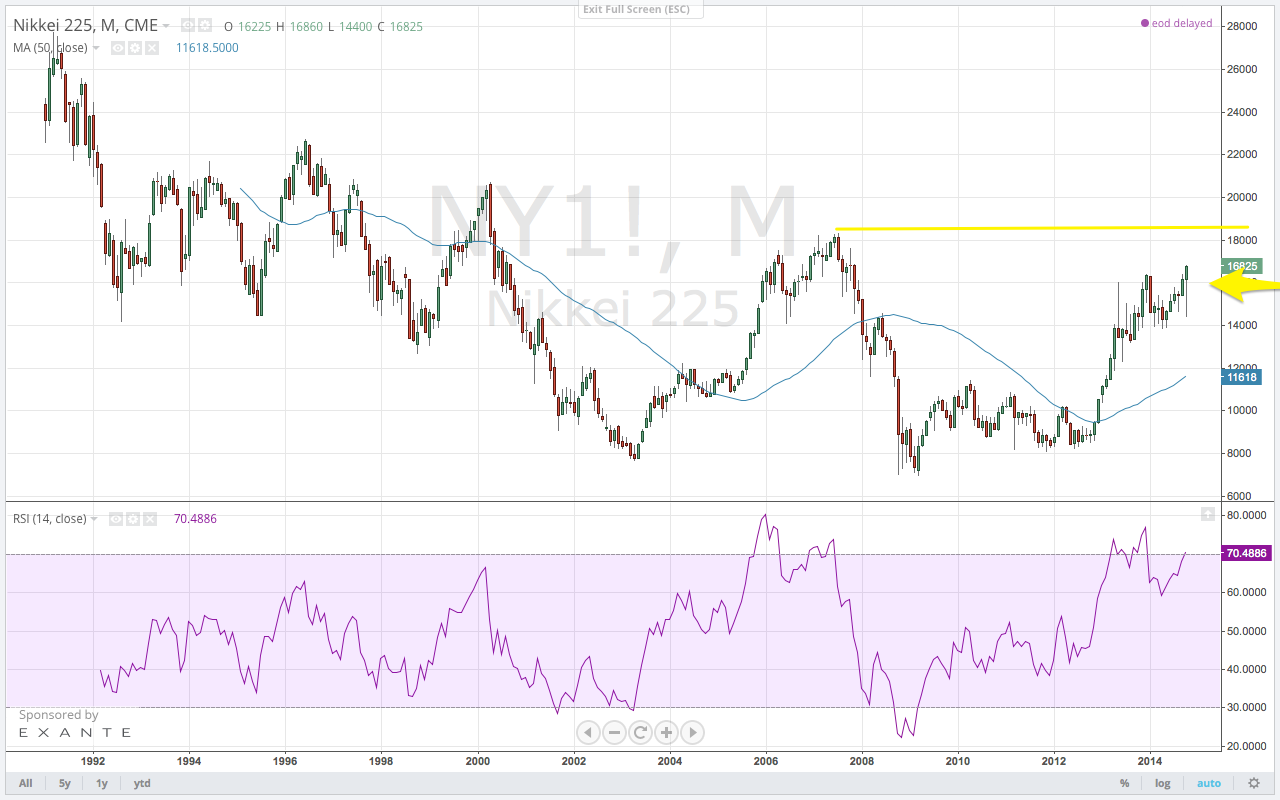
Disguised as monetary policy decision to increase quantitative and qualitative easing, the BoJ basically bailed out the pension this morning. With Japan’s population aging, pension payments are coming due. Japanese equities have basically gone nowhere in the last 15 years. So pension has probably been loosing money once you consider fees paid on those assets. The Federal Reserve has basically proven to the world that QE works. We can debate the inequality of its distribution, but needless to say, the US economy is buzzing at 3.5% GDP. That’s right where we need and like to be. So the financial engineering looks to be sound and Japan has no problem using the instrument to increase wealth for its citizens too. QE today promises that the GPIF can meet its obligatory payments to policy holders AND increases the value of the GPIF’s asset holdings. Very win-win. The market likes it.

Japanese equites long term chart GBPJPY DAILY CHART

Read also: