fbpx

Cable Drops to Fresh Lows

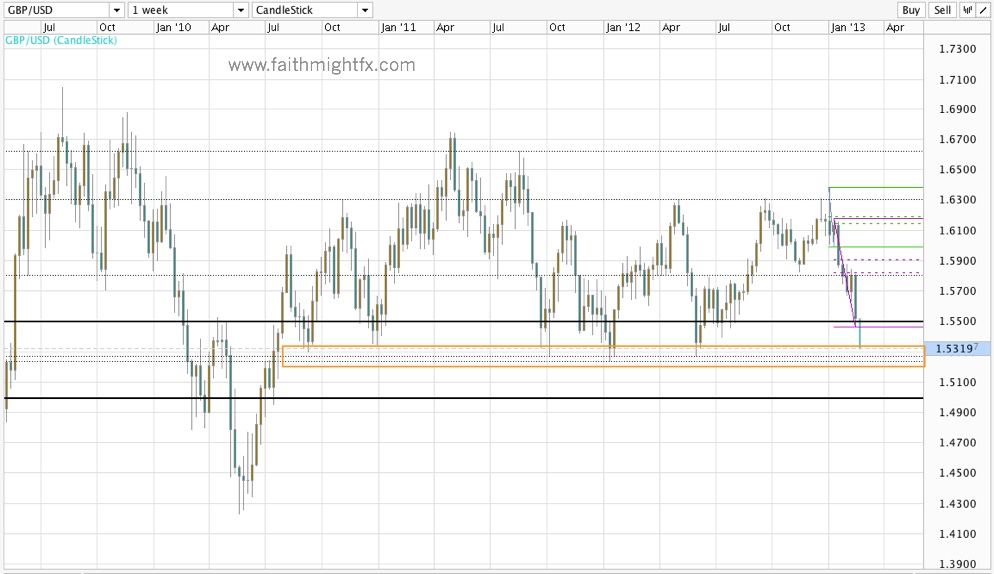
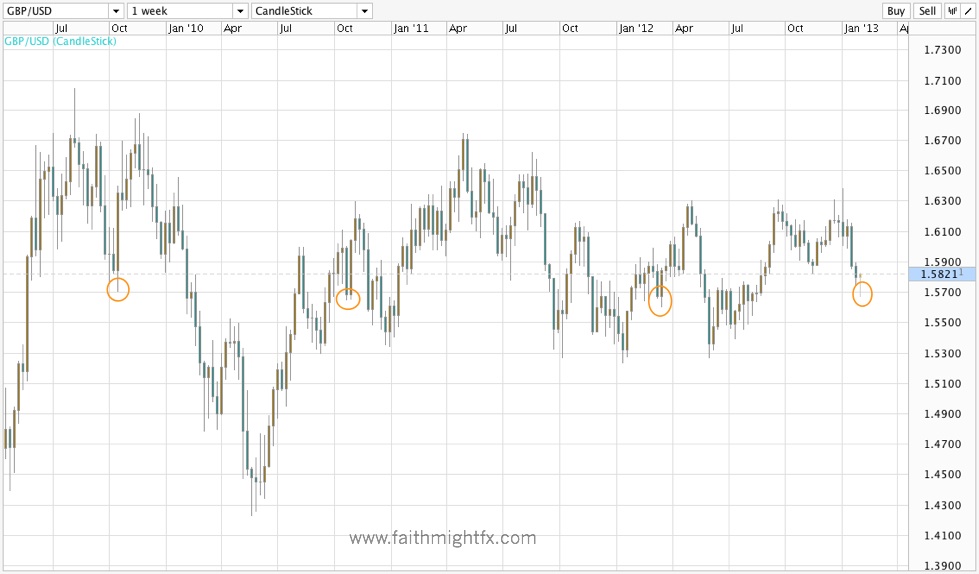
And this is the zone (between 1.53 – 1.5230) everyone is watching.

GBPUSD WEEKLY CHART
We have failed 5 times in the past 3 years to break lower (below 1.5230). With COT data showing traders still very light sterling shorts and UK minutes being ultra-dovish, there is a very good chance $GBPUSD finally breaks through this support zone. If so, the major psychological level at 1.5000 becomes the new target for bears short term.

The Other Side of The Euro Party

On Friday, I laid out price action that could suggest a weak euro in the short term. Today, Kathy Lien laid out the fundamentals that could shift market sentiment euro bearish.

… investors look to economic data and the European Commission’s forecasts for clues on whether the 5% decline in stocks and sharp contraction in Q4 GDP growth means that euro’s problems have returned.

The decline in Eurozone GDP growth in the fourth quarter raised concerns that the complete lack of growth last year and the prospect of a flat first quarter will make budget deficits in the region even more unsustainable.

Germany has been carrying the Eurozone on her shoulders and this week we learn whether she continues to do so vis a vis the IFO and PMI reports. If economic activity in Germany continues to surprise to the upside, the euro could find support but if there are any downside surprises, the currency could tumble quickly.

This week could be epic for euro or just a non-event. Either way, the holiday-shortened week has already been volatile and choppy for euro positions. The $EURGBP has already tested higher to 0.8650 as 0.8600 holds. So the euro is trying to keep the party going. Time will tell.

Read Kathy’s entire piece, Have the Euros Troubles Returned?

Sterling Digest, February 18 2013: serious shifting

New Design of UK Pound Sterling Coins, Flickr
GBP shifts bearish but not everyone agrees

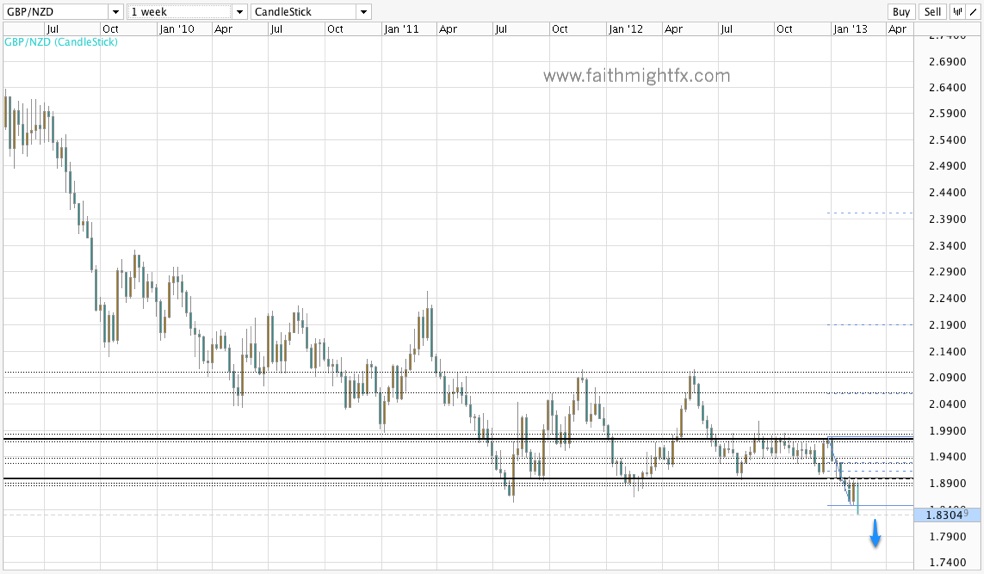
One of the most interesting bits of news last week that went largely unnoticed was Ray Dalio’s positive take on sterling. Talk about a bold, bullish call in the face of new lows and poor fundamentals. While the week ended with sterling rallying on profit-taking, GBP pairs are still very bearish. $GBPUSD, in particular, is especially vulnerable as it finally shifts below the major 1.5500 level. The $EURGBP is the most bullish GBP pair but that comes at the whim of a weak euro. However, the market hasn’t quite made that weak euro shift yet. And the $GBPNZD has staged a breakout to the downside after 2 years of consolidation. With the BoE minutes and unemployment numbers the only UK releases this week and profit-taking already underway, watch for GBP pairs to shift back to their long-term bear trends or move higher still on more price correction.

Image credit

Is The Euro Party Over?

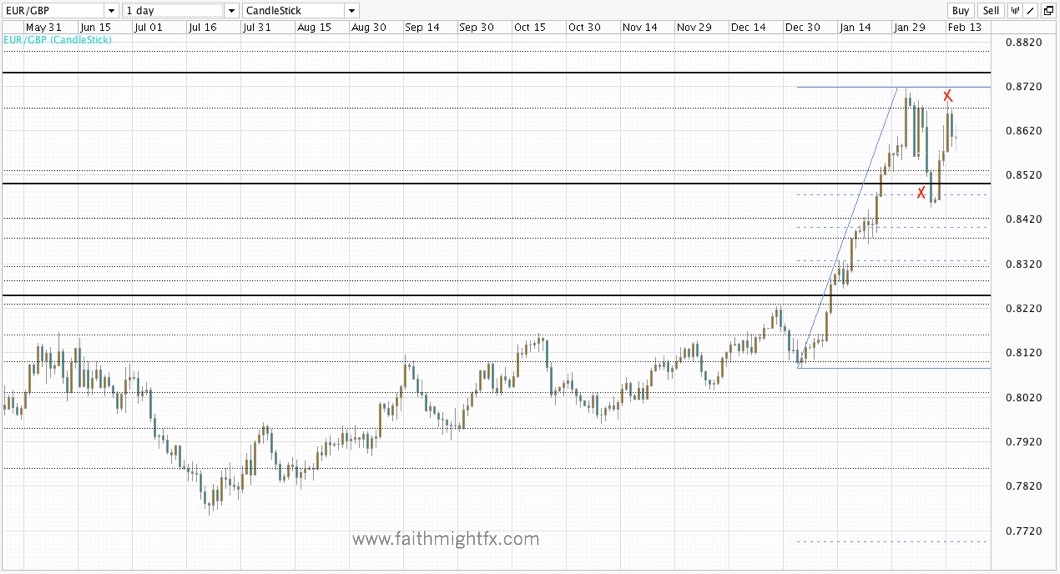
The $EURGBP wowed traders last month as it staged a rally not seen in several years. However, since then ECB officials have shown mild disdain for the strong euro. While the $EURGBP staged an impressive bounce off the 0.8440 lows, it failed to even make a new high above 0.8716.

EURGBP DAILY CHART

And now the pair is staged to drop lower still. I’ve been watching and trading the $EURGBP long enough to know that when it breaches the 38.2% Fibonacci retracement level on any given timeframe, you can expect it to continue on to test the 50% Fibonacci level. On the daily chart, looking at the recent bullish wave, we see that price breached that 38.2% Fibonacci retracement level. The aforementioned failed high confirms price will continue lower to the 50% Fibonacci level at 0.8400.

From there, it will be interesting to see how the pair unfolds. The fundamentals have taken a less than rosy turn this week and future data could continue to support an economically faltering EU with little tolerance for the high exchange rate. Price below 0.84 could be the beginning of the end of the euro. Again. But, for now, this is only a correction. Only a daily close above 0.87 changes the impending bearish outlook.

A Kiwi Breakout

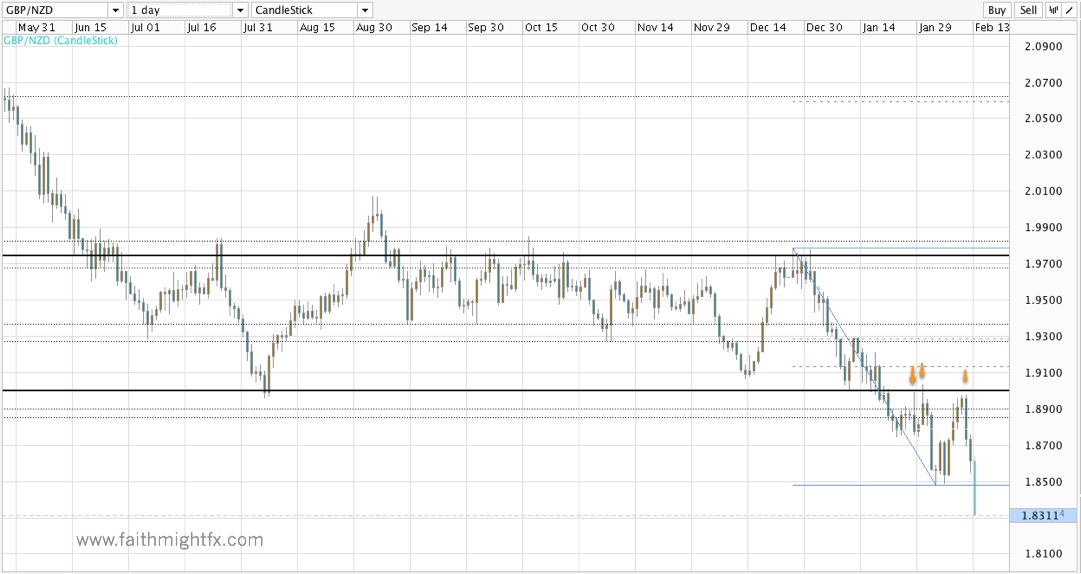
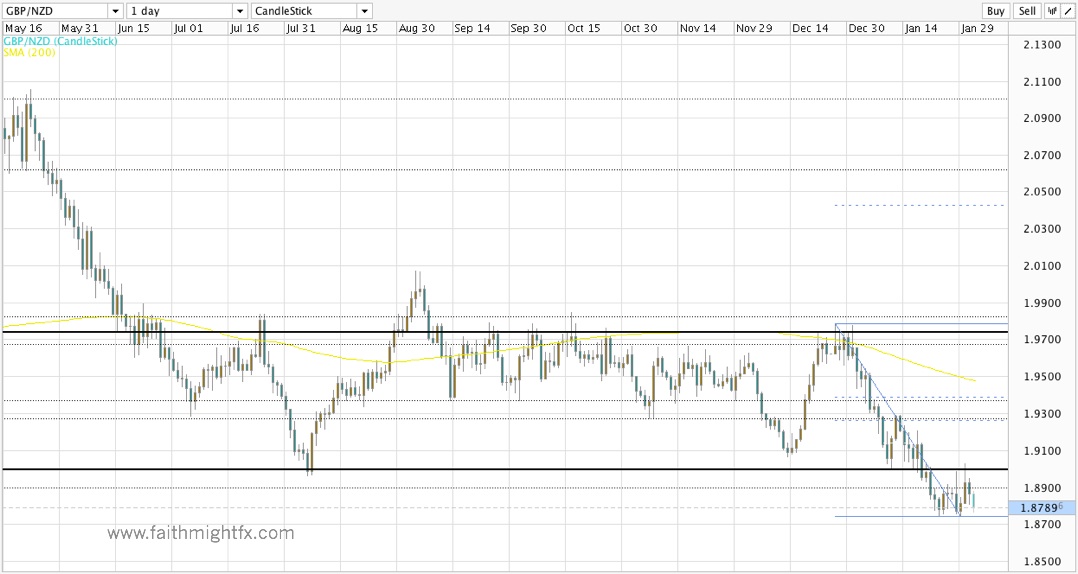
The $GBPNZD has officially broken out on the larger timeframes in Wednesday’s trading session. After breaking below the major psychological level of 1.85, the pair has extended losses from there to trade at 1.83 in early Asian trading. At the European open, those losses have extended further to 1.82.

GBPNZD daily chart

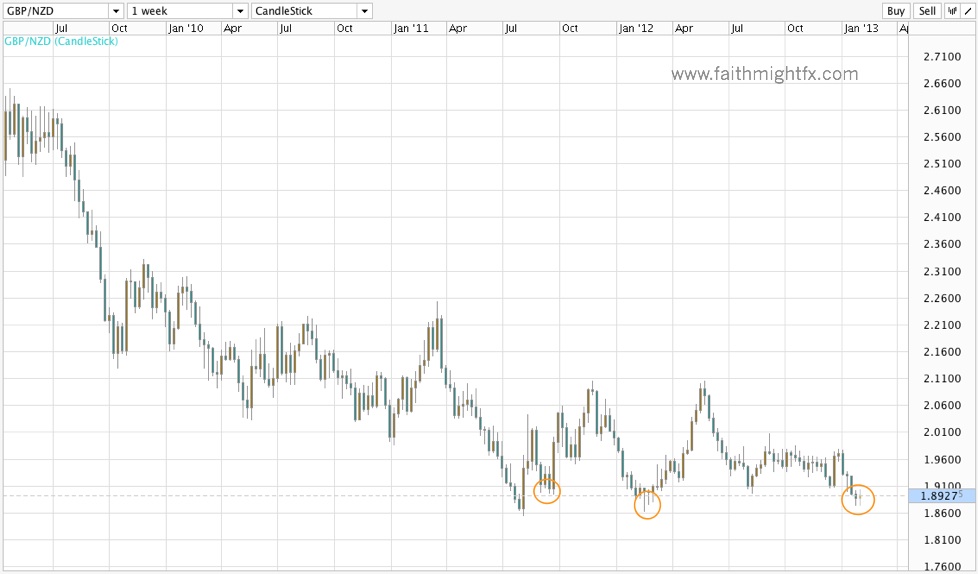
Technically, the hold below 1.90, despite the spike highs, set the stage for a breakout to the downside in $GBPNZD. 1.90 marked the bottom of a consolidation range that held for well over 2 years. With the pair now below the 2011 lows, the pair is in uncharted territory trading at all-time lows.


gnwk

To trade a pair that has no historical reference, it becomes prudent to either trade the psychological levels that tend to exist at the whole numbers and 50-pip intervals. Because the $GBPNZD moves in such wide swings, a trader can capitalize on moves from whole number to whole number with an eye on how price behaves at the 50 level. Another approach, is to remain on the sidelines as price falls and then enter trades on a correction. After the correction, the pair has left some historical support levels in place that a trader can now use as a guide when prices turn lower.

Sterling Digest, February 11 2013: a fading rally

Kipper Williams cartoon, The Guardian
So Carney is not the UK’s savior?

GBP ended last week in consolidation as the technicals were helped in large part to the fundamentals when UK economic data surprised on the strong side and incoming B0E governor Carney surprised markets by steering clear of his dovish Davos comments on monetary policy. All this helped sterling rally last week to new highs across the board. This week holds a light economic calendar from the UK which may allow sterling to continue its consolidation rally. However, watch the current market sentiment to change on a whiff of bad news. With CPI, retail sales, and the BoE Inflation Report out this week, any of these news events has the potential to send sterling back on its long term bear trend.

Image credit

Is The Weak GBP Trade Crowded?

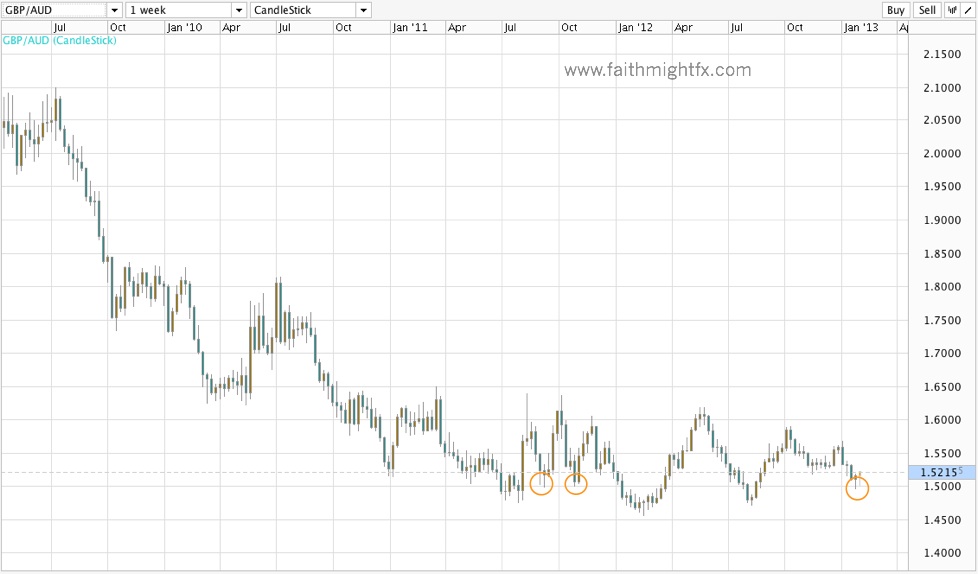
Sterling has spent most of the new year in the dog house. It has tumbled against every major currency with the exception of the Japanese yen. $GBPUSD, $GBPNZD, $GBPAUD have broken 2012 lows to reach new lows and are building breakouts to the downside.

Everyone is well aware of the poor fundamentals underlying the weak GBP story. Triple-dip recession looms. A dovish incoming central bank governor spouting his rhetoric before he even takes the helm. Unwinding of the “safe” haven flows that sterling enjoyed while the European Union was imploding. Traders piled in short GBP. Analysts made recommendations to sell sterling. However, even after hitting new lows this week, GBP bears have not been able to gain additional ground lower.

GBPUSD WEEKLY CHART

GBPNZD weekly chart

GBPAUD weekly chart

A crowded trade does not mean a change in sentiment. It is important to understand that the fundamentals definitely favor a weaker sterling. However, GBP has dropped considerably in just a month’s time without significant correction. Nothing moves in 1 direction forever. Profit-taking can be brutal in this environment as swing and position traders who caught the trend early become more cautious with these price stalls at lows. Also, perhaps more importantly, is that the fundamental landscape has become a bit more optimistic in just the past week. UK economic data has surprised on the stronger side. Carney sounded far less hawkish than he did a few weeks ago in his testimony today. While I still think GBP has further to fall in these highlighted currency pairs, it may be more prudent at these levels to wait on the more significant pullback before reloading the swing short sterling trade.

Sterling Digest, February 4 2013: week of the central banker

Bank of England at Night - Arsat 30mm Fisheye lens on Flickr
BoE at night – What happens behind closed doors?

This is the week of central banks as the market looks ahead to 3 central bank announcements from the Bank of England, the European Central Bank and the Reserve Bank of Australia. After consolidating most of last week, sterling diverged in Friday’s price action weakening against every major currency except the JPY. While the USD weakened on a NFP miss against the EUR and NZD, it gained against the GBP. The reason is a fundamental one. The US economy is in better shape than the UK. While both were surprisingly disappointing, US GDP contracted by less than the UK GDP. UK manufacturing PMI missed expectations; US ISM exceeded expectations. The $FED is on hold; the BoE is dovish and likely to enact another round of QE. Following the announcements already from the BoJ, RBNZ, and FOMC, this week’s announcements should complete the fundamental differences in the major currencies. With the forex market now trading on fundamentals (and not risk appetite), the best trades now become the ones that exploit the stark differences in fundamentals.


Image credit


The NFP Dollars

As the market awaits the first non-farm payrolls (NFP) release of 2013, the Australian and New Zealand dollars have wildly diverged in price action this week. Historically, the 2 currencies move together given their geographical proximity and relation to commodities. But this past week, the AUD has weakened considerably versus the USD while the NZD continues to rally against the USD. The fundamentals have supported this divergence as the RBA is considering interest rates cuts while the RBNZ remains much more hawkish.

As such, I think any interesting GBP trade idea is one that takes advantage the way the USD reacts to the non-farm payrolls report. If the USD weakens, the better play would be the $GBPNZD as the kiwi will advance more rapidly versus a weak USD as it has all week.

GBPNZD daily chart

A weak USD supports a weak $GBPNZD down to 1.85. On the other hand, if the USD strengthens, then taking advantage of the already weak AUD would make the $GBPAUD the better opportunity.

GPBAUD daily chart

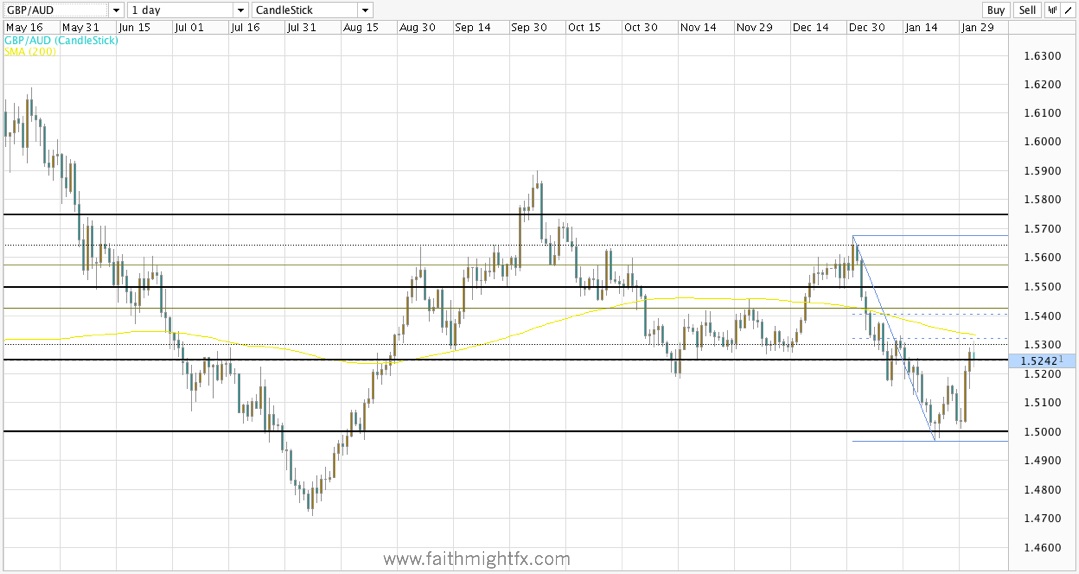
A decline in the $AUDUSD would see the AUD also weaken versus the GBP and extend the rally in $GBPAUD to 1.54, the 61.8% Fibonacci retracement level on the daily chart.

NFP in due to be released in 30 minutes. Given how the aussie and kiwi have traded already this week versus the USD, we can take advantage of either a hit or a miss in NFP expectations without direct exposure to the USD volatility.

GBPCAD Fails To Hit Bottom

After hitting the top of the range at 1.6214 to begin the new year, the $GBPCAD has been working its way down towards the bottom of the range all month. Last week, it hit a low of 1.5670 before it abruptly turned and rallied higher on the dovish Bank of Canada rate decision. While the BoC left rates unchanged, they downgraded the Canadian economy sending the CAD lower. Prior to this statement, the market viewed the BoC as hawkish helping drive the $GBPCAD currency pair lower. With this shift in fundamentals, albeit temporary most likely, the currency pair has turned higher on a weaker CAD without the pair hitting the bottom of the range at 1.5400.
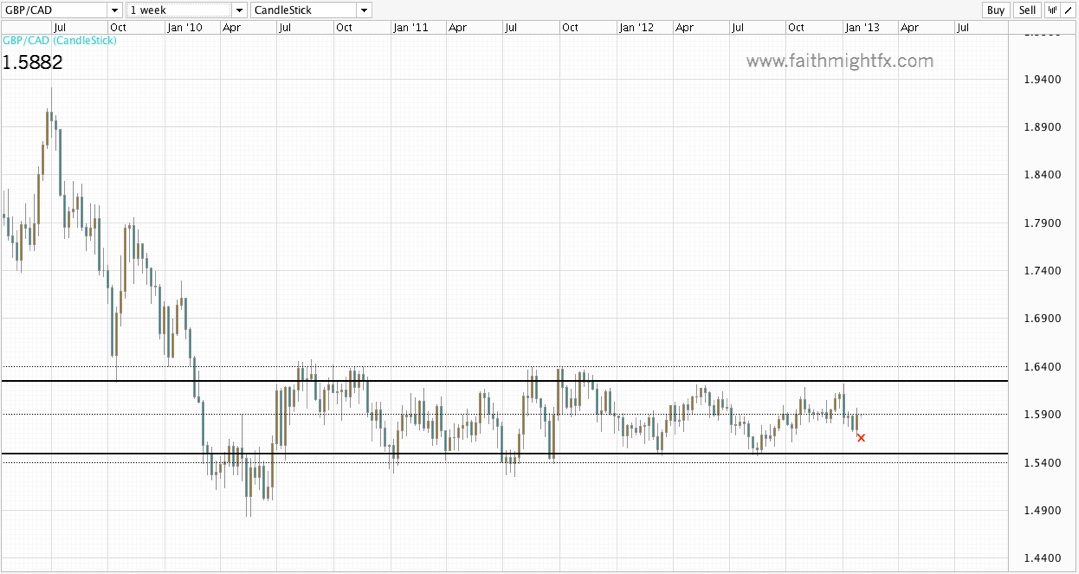
GBPCAD weekly chart

With the new high last week at 1.5965, is the $GBPCAD poised to go higher still towards the range highs at 1.6200?
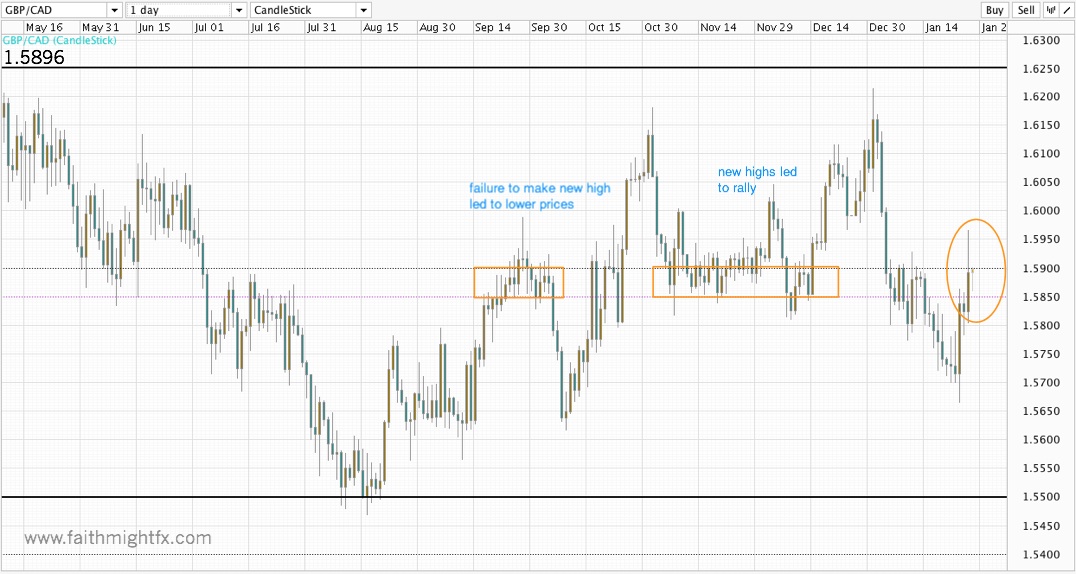
GBPCAD daily chart

For the answer, watch the area between 1.5850 – 1.5900 for bids. If the $GBPCAD can remain supported by 1.5850 AND make a new high higher than 1.5965, then I suspect this pair can continue higher to the top of the range above 1.6000. After Monday’s trading session, $GBPCAD failed to do either and fell to lows at 1.5780. Price action confirmed its bearish direction with a daily close below 1.5800 support. As Tuesday’s session opens, the pair is poised to finish its business and hit the bottom of the range.
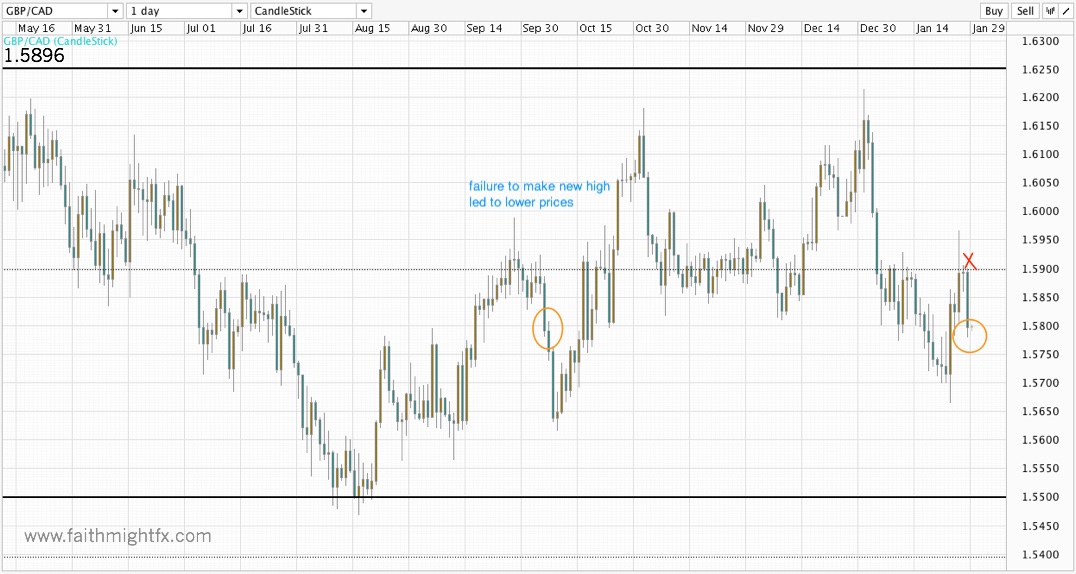
gbpcad

With a very light economic calendar out of the UK and Canada this week, it is entirely possible that we see the CAD continue to strengthen into Canada’s GDP release on Thursday. In contrast with the contraction in the UK economy reported last week, the market may rally CAD vs. GBP on a simply positive number. Any number higher than expected will move the $GBPCAD decisively lower to the range bottom at 1.5400.