Bitcoin, the premier cryptocurrency, reached the threshold of $1trillion market cap in 2021 and this year also, a feat no other cryptocurrency has attained. The current market capitalization of Bitcoin is $1.2trillion. The next most valuable cryptocurrency is Ethereum, with a market cap of $347billion. The value of the crypto market is way ahead of the total US stock market as of this year which stands at $50.8miilion.
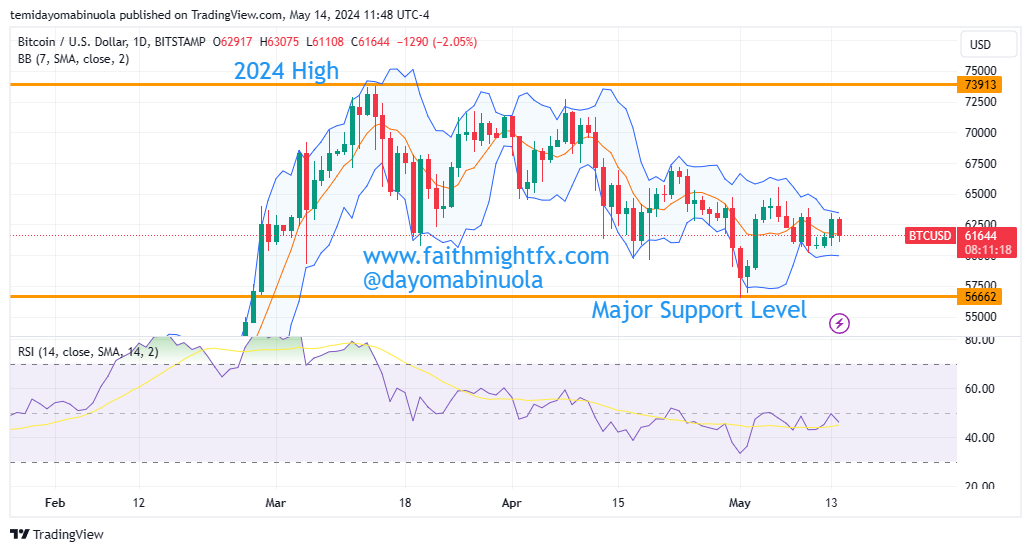
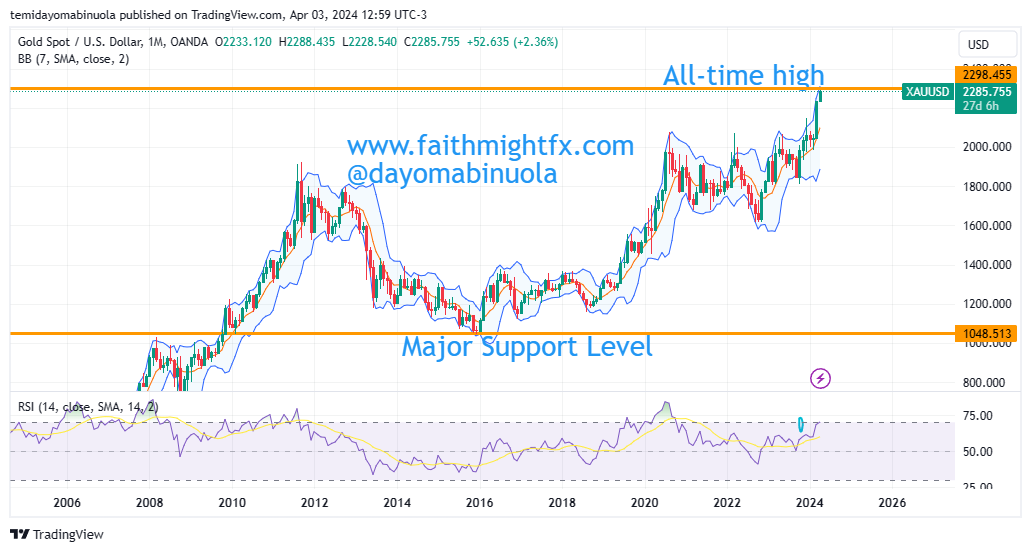
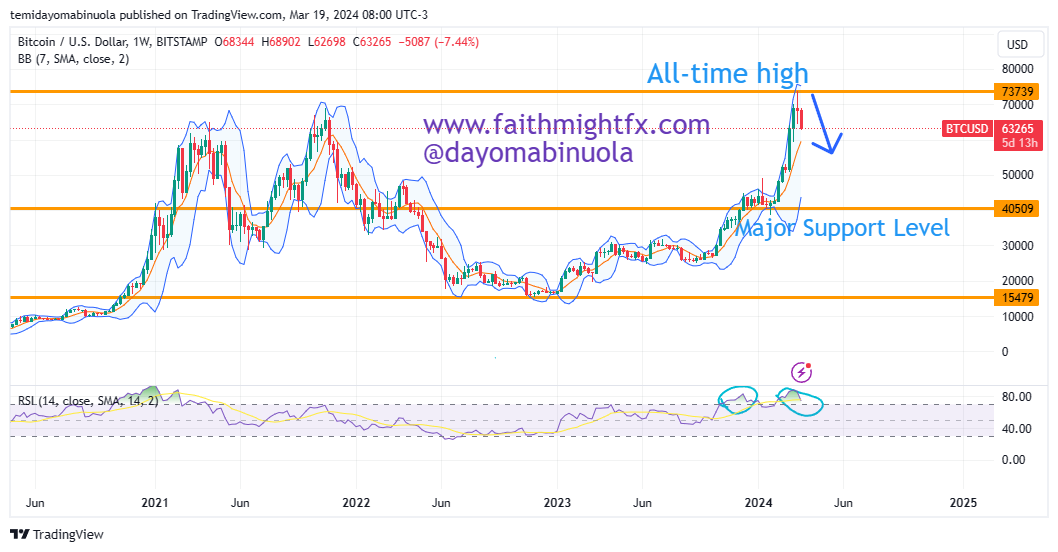
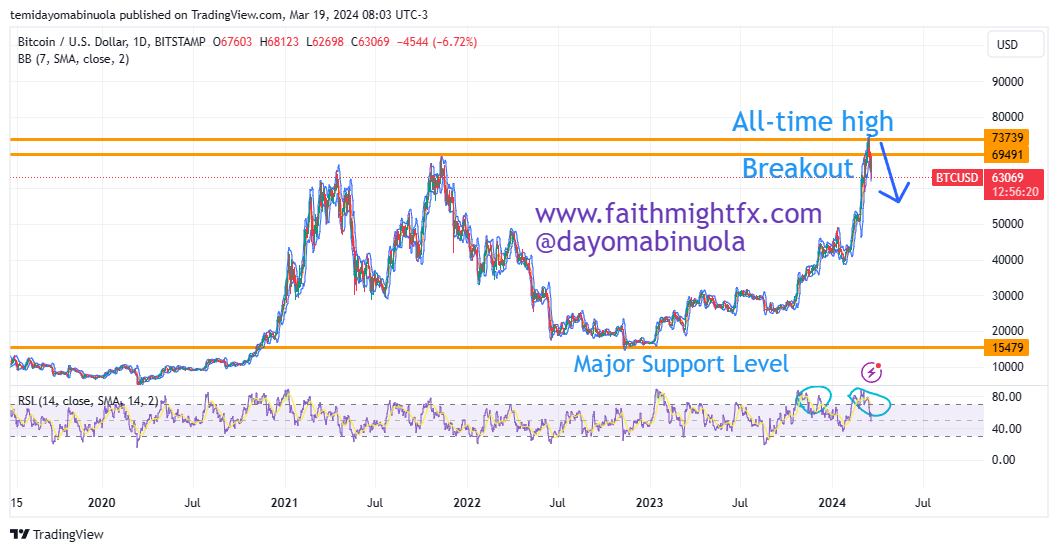
Bitcoin reached a record high at $73,913 in March 2024. Since the downturn of 2022, investors haven’t been able to smile to the bank until now. The bulls have been in control since January 2023, but with slow movement. The 2024 growth is quite exponential as price has been able to reach an all-time high.
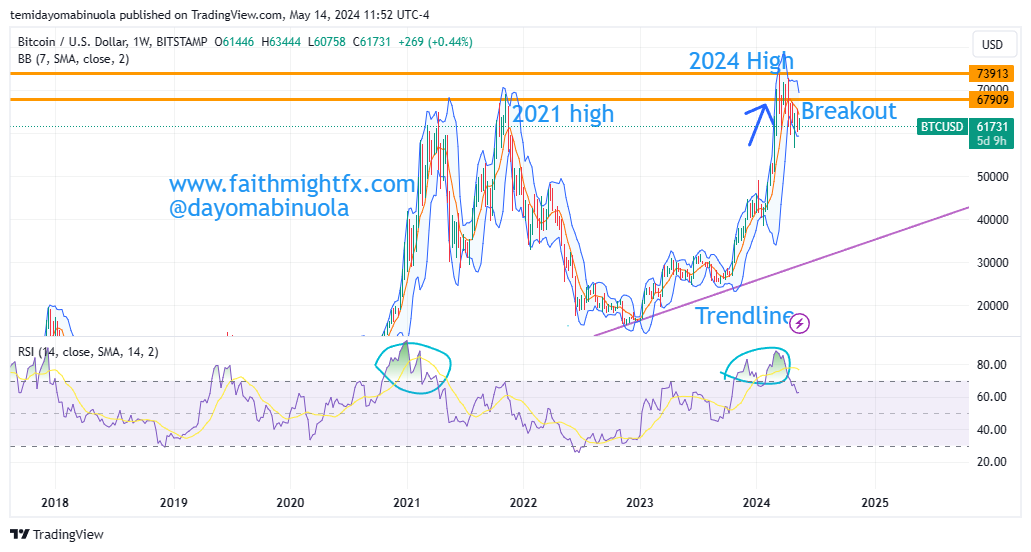
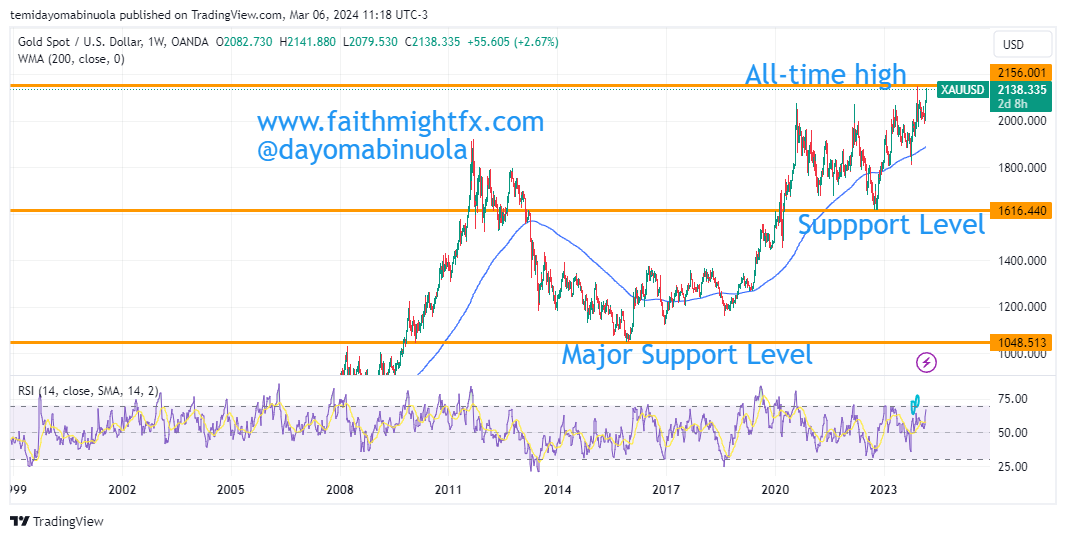
On the weekly chart, RSI has shown that price has been overbought since November 2023. This has not resulted in a reversal. Instead, price has continued its bullish run. Bitcoin’s price corrected, which made price fall to $56,464 on the first trading day of May 2024. As of the time of this writing, Bitcoin is at $61,472. We might see the bulls move price to $64,900 in the coming weeks.
Some of these ideas are in our clients’ portfolios. To understand if this one can work for you or for help to invest your own wealth, talk to our advisors at FM Capital Group. Would you like more information on how to get cryptocurrency in your portfolio? Schedule a meeting with us here