fbpx

Seasonality in GBP/USD

Seasonality is an interesting trading edge. Like correlation, it works until it doesn’t.

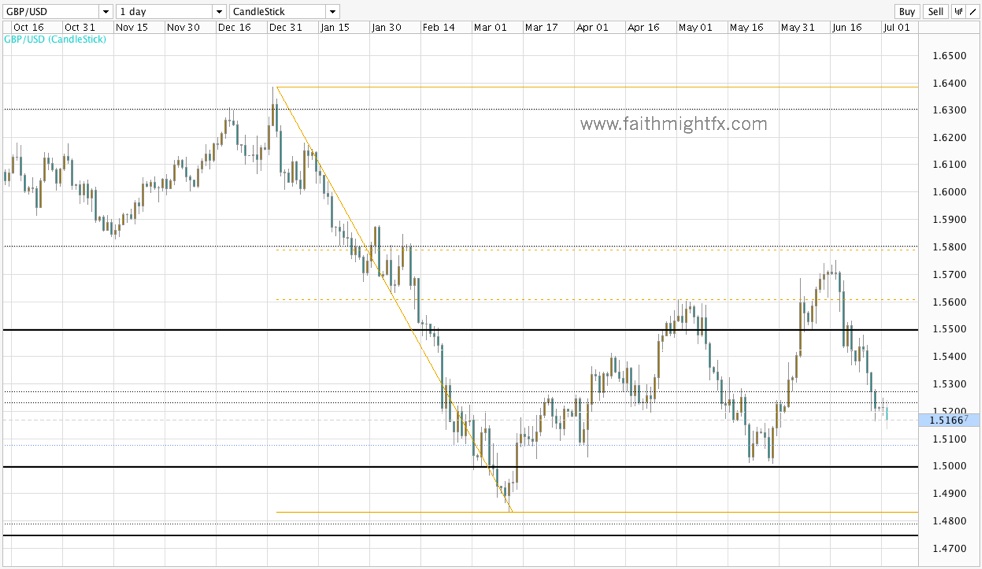
Taking a closer look at the $GBPUSD seasonality pattern: the pair rallies for the month of April, finds a top at the end of April, and sells off for the month of May. It’s pretty incredible the reliability of this pattern. We find it playing out perfectly in the past 3 years.

GBPUSD 1 WEEK CHART

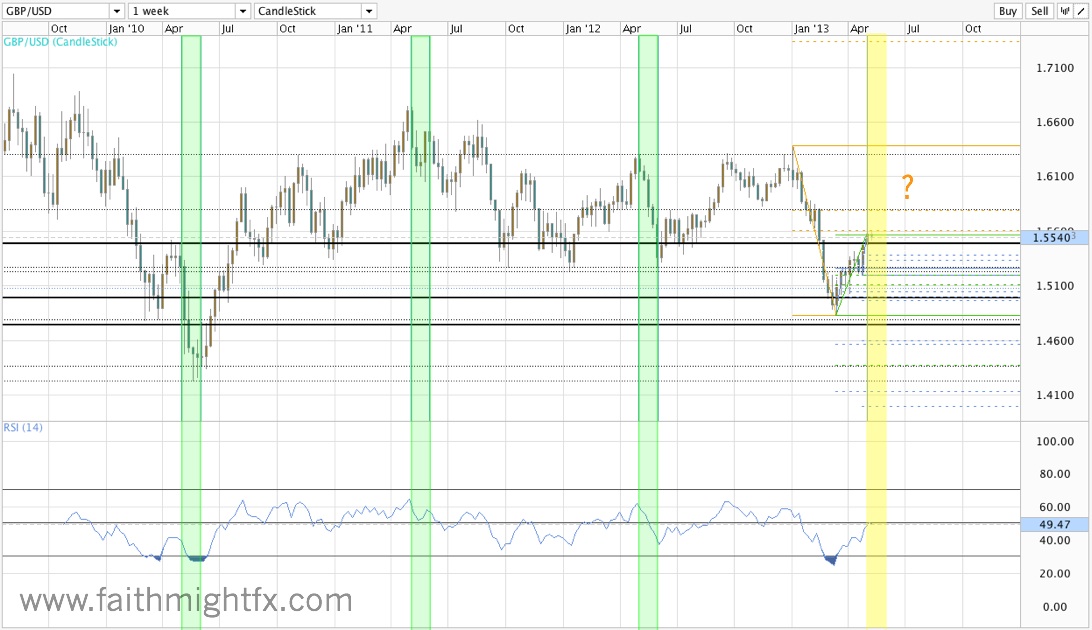
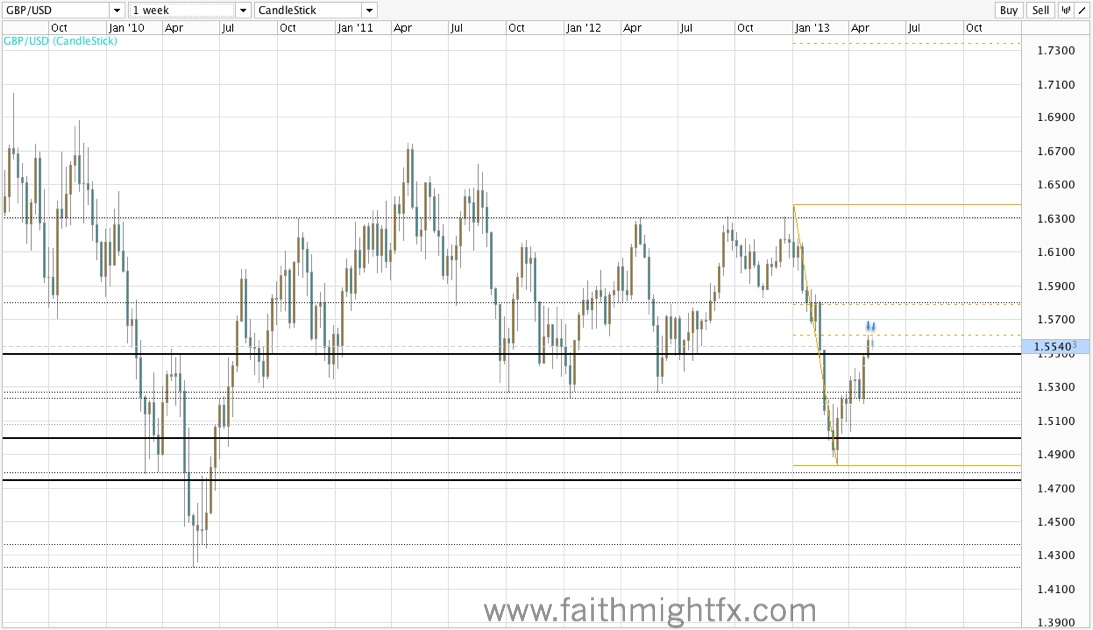
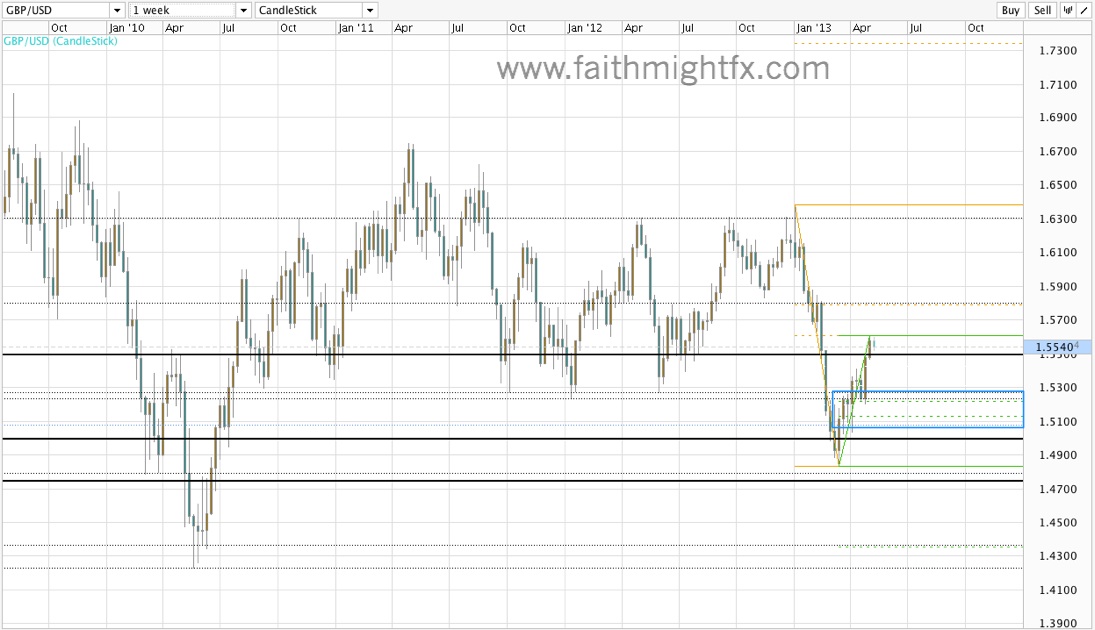
Every May since 2010, $GBPUSD has sold off hard to the tune of 500 pips or more. By the end of May, cable puts in a bottom. Conversely, every April since 2010, cable has rallied only to top out at the end of the month. This April was no different. Why should this May be any different?

cable4hr

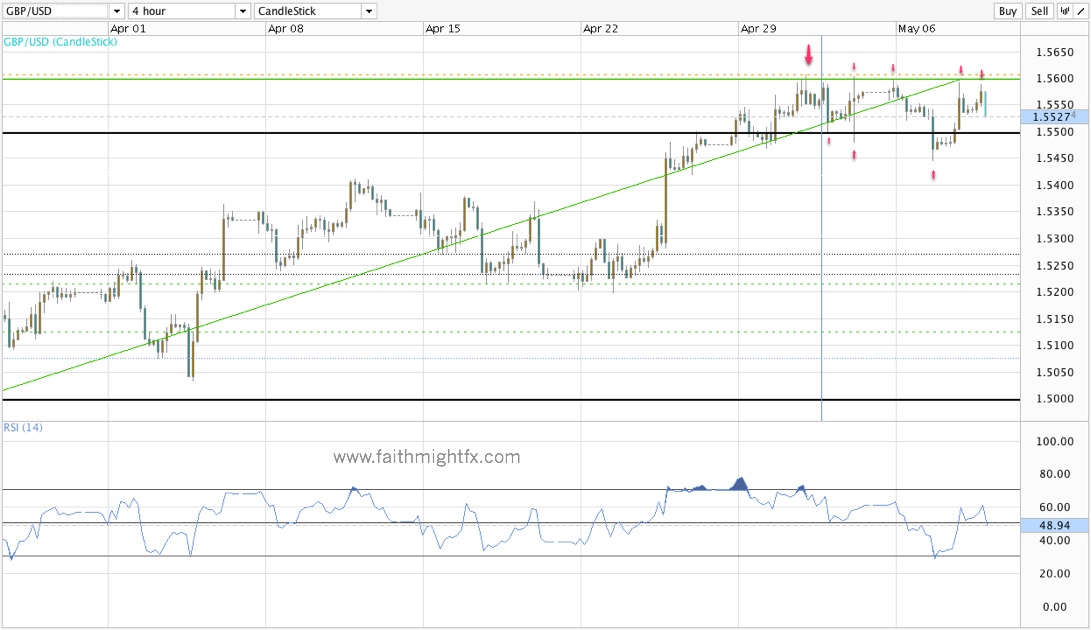
So here we are in the 1st trading week of May and since topping out in April at 1.5606, $GBPUSD has put in lower highs and lower lows. The swings have been very wide and very volatile. Each new low has been met with bids that push price right back to highs. But this type of volatile price action is very characteristic of cable when it is experiencing a change in sentiment and, therefore, direction. What is important to me is that cable is carving out the very definition of a DOWN trend, lower highs and lower lows, despite the volatility.

GBPUSD 1 week CHART

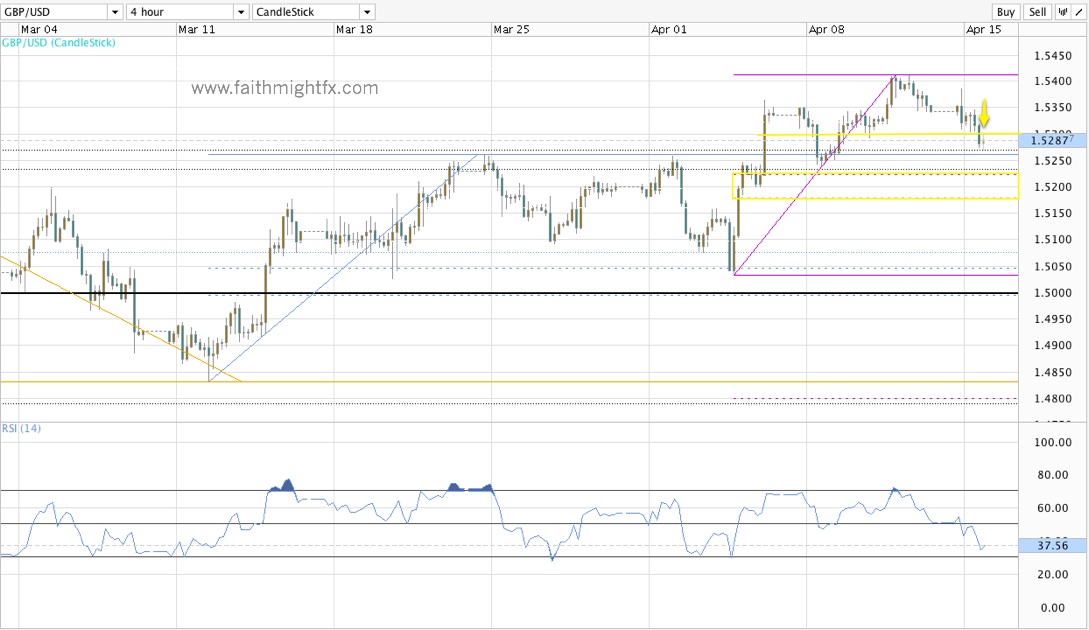
Looking at the big picture, we see where cable was going and why on the rally. I’ve laid out that bullish scenario all April long (see below).

GBPUSD 1 WEEK CHART

With sellers back in the picture, the 1st target to the downside is a massive support zone on the weekly chart. This zone sees long term support at 1.5250/30, the 50%Fibonacci level of the April rally at 1.5213, the 61.8% Fibonacci level at 1.5118, and the 1.5075 support level that buttressed the rally to 1.5600. A break below all of these levels would certainly accelerate price lower. The 50% Fibonacci correction to 1.5606 suggests that cable is looking to put in a new low below 1.4830. The seasonality trend says we could very well get there. Here’s to May!

Read Also:

GBPUSD Back In Play

Here is an chart update for “GBP/USD Can Still Go Higher” posted last week. Buys were never initiated (for me) with price above 1.5300 last week. Sellers never got going either with strong bids at 1.5300 keeping price propped enough to make new highs above 1.5400. Strategy now in play with $GBPUSD breaking 1.5300 support of last week in early Tuesday (New Zealand/Sydney) trading. Read full analysis for key levels.

GBPUSD 4hr chart

Euro Strength Is Ridiculous

Analysts called for $EURGBP to firm since Cyprus blew over. I couldn’t believe it. After Cyprus then Slovenia and Portugal scares, calls for the $EURGBP to make a new daily high were ridiculous to me. So much so that I wasn’t comfortable going long EUR. So I didn’t. However, the strong close on Friday at 0.8541 after holding 0.8490 that day was the confirmation for me that price is in fact moving higher. I try very hard to trade only what I see. Even if some one else saw the rally before I did, I could only buy euros comfortably after price confirmed what most were starting to see. The target above 0.85 is a new daily chart high above 0.8800.

EURGBP weekly chart

To start the new week, the key levels were 0.85 to the downside and 0.8570 and 0.86 to the upside. Monday, price held 0.85 on a dip to 0.8515. Yesterday, $EURGBP broke both resistance levels. Now today following the release of poor UK employment numbers, $EURGBP has made new week highs at 0.8637 (at the time of this writing). Key levels from here are now 0.8600 to the downside and 0.8670 and 0.8750 to the upside.

During the Cyprus fiasco, I didn’t think EUR could recover. I thought the party was indeed over. This euro strength is ridiculous. But even ridiculous can make money.

Mentioned here:

GBPUSD Can Still Go Higher

Last Friday, $GBPUSD moved beyond the 1.5250 resistance that has capped rallies since February. This price move is pretty significant and sets cable up for a nice correction of the entire breakdown into the 1.5600 50% Fibonacci level. However, despite the new highs, sterling came off its across-the-board Friday highs as corrections set in during the Monday trading session.

GBPUSD 4hr chart

Price so far has managed to find support in the former resistance zone between 1.5230 and 1.5250. But bulls shouldn’t get too aggressive here. Later this morning, markets expect the release of UK manufacturing PMI number. As manufacturing and construction data releases have been poor all year, the market expects another weak number. I expect knee jerk price reaction on a poor release to send $GBPUSD lower into the yellow buy zone. But because the market expects such a release, the bearish sentiment will be short-lived. As such, I expect that price can still move higher still into 1.54 long-term support-turned-resistance. Conversely, a stronger-than-expected release has the potential to reignite this GBP rally ahead of the 50% Fibonacci level. Trade what you see!

Background reading:
Can Sterling Really Rally? (FaithMightFX)
Sterling Digest, April 8 2013: freedom to grow (FaithMightFX)

More Evidence of Sterling Strength

Yesterday, I outlined the case for a potential rally in sterling via the $GBPUSD currency pair. But there are other sterling pairs that are also showing potential for GBP strength as well. Let’s look at two of those pairs.

EUR/GBP

The $EURGBP had a bearish divergence as it found resistance yesterday against 0.8500 major psychological level. However, sterling weakened tremendously into today’s Bank of England (BoE) rate announcement (the 1st of 2Q2103) causing the pair to spike above 0.8500 to a high of 0.8521. Now that the event risk has passed, the pair has moved lower and looks to target support at 0.8400. A break below targets the 50% Fibonacci level at 0.8285 giving GBP a 200-pip rally.

EURGBP daily chart

GBP/NZD

The $GBPNZD had a bullish divergence yesterday even as it dropped to new lows at 1.7909. The pair rallied to the major psychological level at 1.8000 where it found resistance into the BoE rate announcement. However, like $EURGBP, after the announcement sterling strength pushed the $GBPNZD above 1.80 to a high today at 1.8054. Even on today’s intraday pullbacks, price is managing to now find support at 1.80. If this level can hold as support, this pair can rally back to the resistance zone between 1.84 – 1.8450. A break above this resistance has the potential to rally to 1.8900, the 50% Fibonacci level of the entire breakdown, giving GPB in this pair a 900-pip rally.

GBPNZD daily chart

Given these daily charts, I have to stress that GBP strength goes against the very strong bear trend that has seized sterling since the beginning of this year. Any rally will be VERY choppy, meaning, highs will be met aggressively by sellers. We have seen this in $GBPUSD just this week with highs at 1.5260 on Monday being sold to 1.5075 lows; and again with Tuesday highs at 1.5150 being sold to 1.5033 today. Therefore, it is prudent to take profits at resistance levels rather than hold for large swing moves. It is also prudent to pay close attention to the BoE. If the vote shifts to more members wanting additional QE or if an actual QE increase materializes, all bullish bets are off. However, the converse is also true. If fewer members call for QE and monetary policy continues to be on hold, a sterling rally can really take hold. The BoE minutes are due out in a couple weeks. That will give us our first 2nd quarter impression of what the BoE sentiment really is.

Can Sterling Really Rally?

In this week’s Digest, I made the assertion that after a dismal 1st quarter, sterling could stand to rally during this 2nd quarter. Much of GBP weakness has been fueled by the weak UK economy and dovish central bank rhetoric. However, these fundamentals caught a glimmer of optimism from last month’s Bank of England minutes that explained the hold in monetary policy so far delivered. While the market expected more members to join Governor King in favor of more QE, the dove cohort remained the same. What was new to the minutes was discussion that more QE would further deteriorate the value of the GBP. Hence, despite King’s disregard, the rest of the BoE actually is paying worrying attention to the country’s high inflation.

This new rhetoric is hawkish as sterling has been firming across the board. HOWEVER, it has been choppy because the long term trends are still firmly bearish. The $GBPUSD has moved higher but highs continue to be met by sellers parked in at the former yearly lows between 1.5230 and 1.5250.

 GBPUSD daily chart YESTERDAY

Even with an 800-pip rally off the lows, cable still remains in a downtrend. Such a rally targets the 50% Fibonacci retracement level of the entire breakdown at 1.5600. However, traders should understand that any bullish sentiment is strictly short term and again very choppy with plenty of sellers parked at 1.5250.

GBPUSD 4HR CHART TODAY

Despite the sellers, price has been unable to get back below the major psychological level at 1.50. On yesterday’s move down (due to poor UK manufacturing data), I had my eye on the yellow zone marked by 1.5075 support and the 50% Fib at 1.5042. With today’s UK construction PMI release, I suspected that price would spike lower in the 50% Fibonacci level but find buyers and start to rally higher. Instead, price bottomed at the 1.5075 support level and staged a nice rally in today’s price action.

 GBPUSD 4HR CHART TODAY

Price rallies now target 1.5250 yet again and should be expected to be met by sellers again. However, once price clears this resistance zone, look for price to target 1.5300 resistance and then the large psychological level at 1.5500 on its way to 1.5600.

Cable Drops to Fresh Lows

And this is the zone (between 1.53 – 1.5230) everyone is watching.

GBPUSD WEEKLY CHART
We have failed 5 times in the past 3 years to break lower (below 1.5230). With COT data showing traders still very light sterling shorts and UK minutes being ultra-dovish, there is a very good chance $GBPUSD finally breaks through this support zone. If so, the major psychological level at 1.5000 becomes the new target for bears short term.

The Other Side of The Euro Party

On Friday, I laid out price action that could suggest a weak euro in the short term. Today, Kathy Lien laid out the fundamentals that could shift market sentiment euro bearish.

… investors look to economic data and the European Commission’s forecasts for clues on whether the 5% decline in stocks and sharp contraction in Q4 GDP growth means that euro’s problems have returned.

The decline in Eurozone GDP growth in the fourth quarter raised concerns that the complete lack of growth last year and the prospect of a flat first quarter will make budget deficits in the region even more unsustainable.

Germany has been carrying the Eurozone on her shoulders and this week we learn whether she continues to do so vis a vis the IFO and PMI reports. If economic activity in Germany continues to surprise to the upside, the euro could find support but if there are any downside surprises, the currency could tumble quickly.

This week could be epic for euro or just a non-event. Either way, the holiday-shortened week has already been volatile and choppy for euro positions. The $EURGBP has already tested higher to 0.8650 as 0.8600 holds. So the euro is trying to keep the party going. Time will tell.

Read Kathy’s entire piece, Have the Euros Troubles Returned?

Is The Euro Party Over?

The $EURGBP wowed traders last month as it staged a rally not seen in several years. However, since then ECB officials have shown mild disdain for the strong euro. While the $EURGBP staged an impressive bounce off the 0.8440 lows, it failed to even make a new high above 0.8716.

EURGBP DAILY CHART

And now the pair is staged to drop lower still. I’ve been watching and trading the $EURGBP long enough to know that when it breaches the 38.2% Fibonacci retracement level on any given timeframe, you can expect it to continue on to test the 50% Fibonacci level. On the daily chart, looking at the recent bullish wave, we see that price breached that 38.2% Fibonacci retracement level. The aforementioned failed high confirms price will continue lower to the 50% Fibonacci level at 0.8400.

From there, it will be interesting to see how the pair unfolds. The fundamentals have taken a less than rosy turn this week and future data could continue to support an economically faltering EU with little tolerance for the high exchange rate. Price below 0.84 could be the beginning of the end of the euro. Again. But, for now, this is only a correction. Only a daily close above 0.87 changes the impending bearish outlook.

A Kiwi Breakout

The $GBPNZD has officially broken out on the larger timeframes in Wednesday’s trading session. After breaking below the major psychological level of 1.85, the pair has extended losses from there to trade at 1.83 in early Asian trading. At the European open, those losses have extended further to 1.82.

GBPNZD daily chart

Technically, the hold below 1.90, despite the spike highs, set the stage for a breakout to the downside in $GBPNZD. 1.90 marked the bottom of a consolidation range that held for well over 2 years. With the pair now below the 2011 lows, the pair is in uncharted territory trading at all-time lows.


gnwk

To trade a pair that has no historical reference, it becomes prudent to either trade the psychological levels that tend to exist at the whole numbers and 50-pip intervals. Because the $GBPNZD moves in such wide swings, a trader can capitalize on moves from whole number to whole number with an eye on how price behaves at the 50 level. Another approach, is to remain on the sidelines as price falls and then enter trades on a correction. After the correction, the pair has left some historical support levels in place that a trader can now use as a guide when prices turn lower.