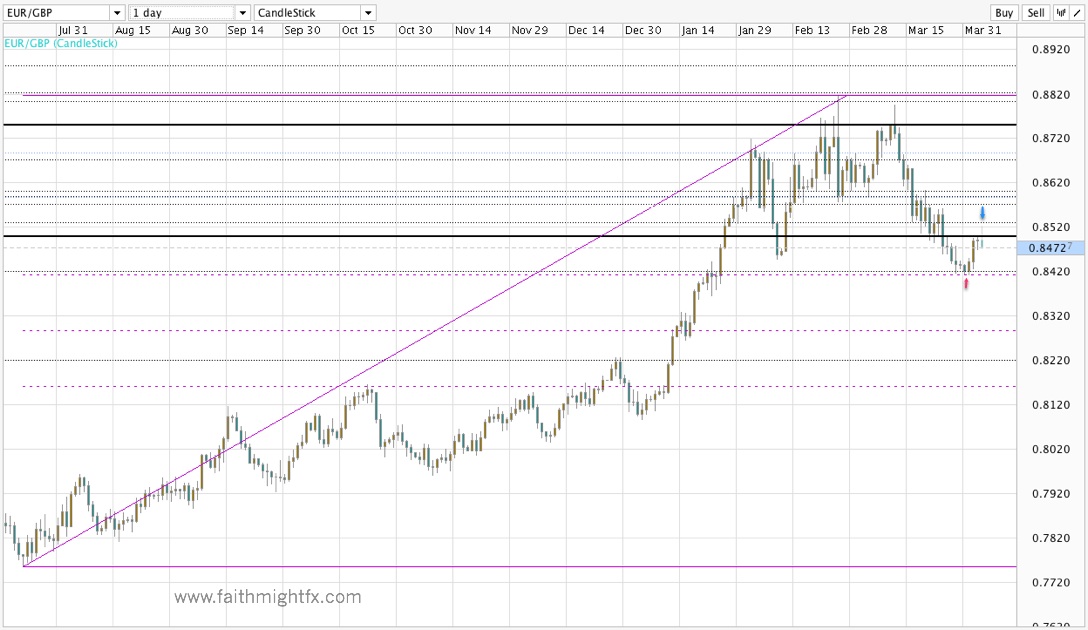
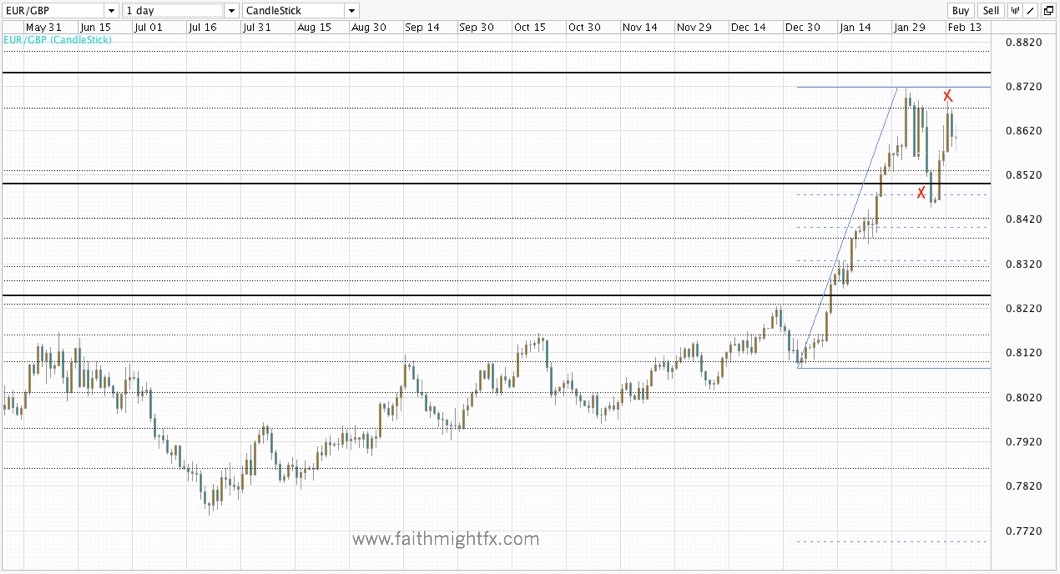
Analysts called for $EURGBP to firm since Cyprus blew over. I couldn’t believe it. After Cyprus then Slovenia and Portugal scares, calls for the $EURGBP to make a new daily high were ridiculous to me. So much so that I wasn’t comfortable going long EUR. So I didn’t. However, the strong close on Friday at 0.8541 after holding 0.8490 that day was the confirmation for me that price is in fact moving higher. I try very hard to trade only what I see. Even if some one else saw the rally before I did, I could only buy euros comfortably after price confirmed what most were starting to see. The target above 0.85 is a new daily chart high above 0.8800.
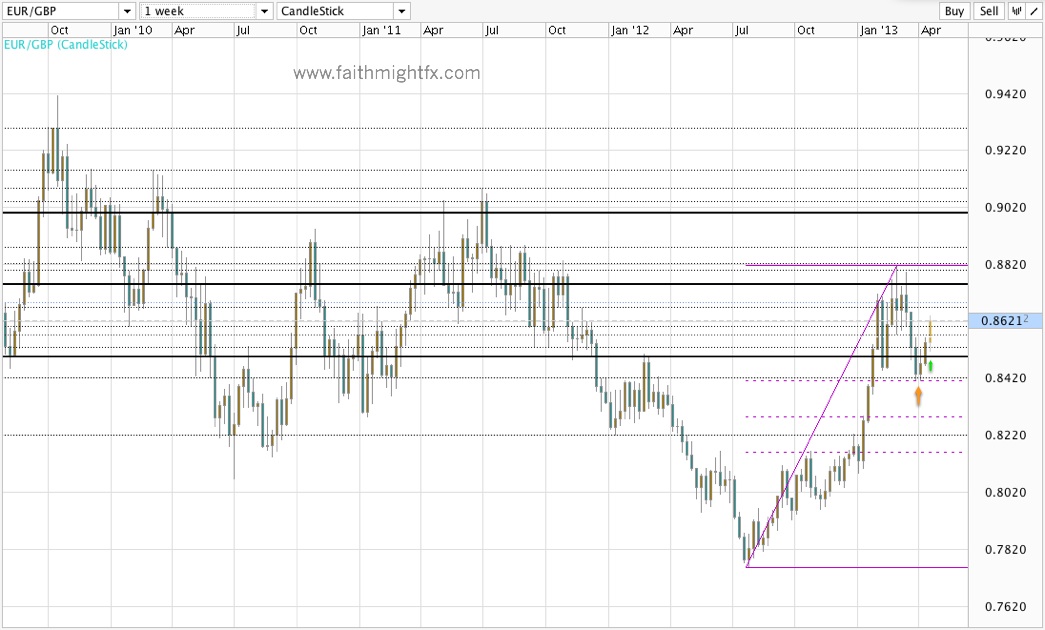
To start the new week, the key levels were 0.85 to the downside and 0.8570 and 0.86 to the upside. Monday, price held 0.85 on a dip to 0.8515. Yesterday, $EURGBP broke both resistance levels. Now today following the release of poor UK employment numbers, $EURGBP has made new week highs at 0.8637 (at the time of this writing). Key levels from here are now 0.8600 to the downside and 0.8670 and 0.8750 to the upside.
During the Cyprus fiasco, I didn’t think EUR could recover. I thought the party was indeed over. This euro strength is ridiculous. But even ridiculous can make money.
Mentioned here:
- TOP 3 FOREX TRADES FOR Q2 (BK Asset Management)
- Slovenia Not in the Danger Zone: Pro (CNBC)
- The Other Side of The Euro Party (FaithMightFX)
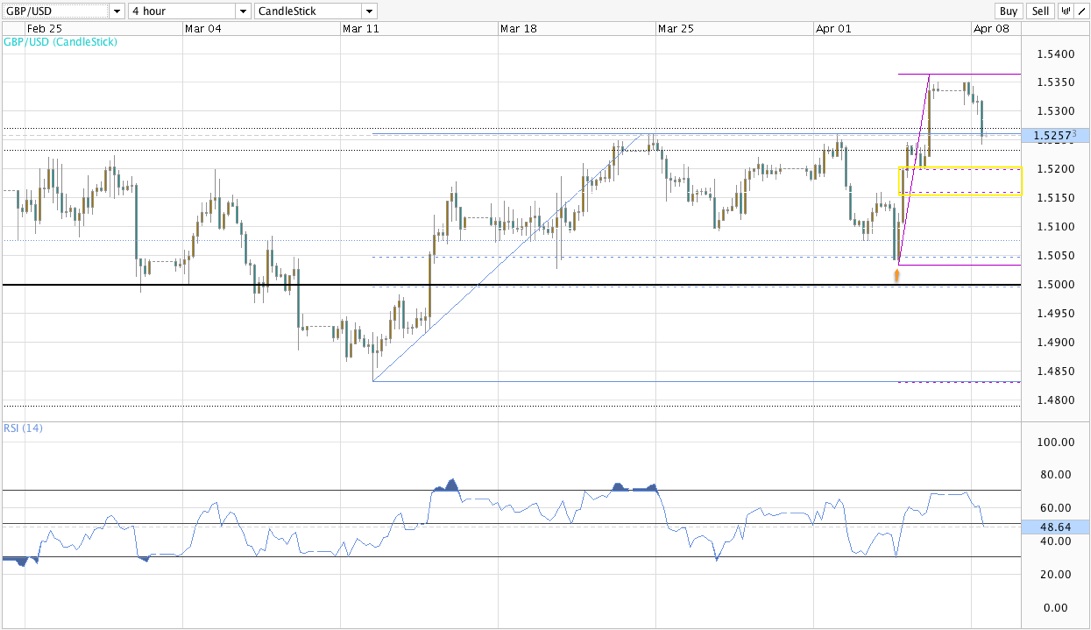
- Sterling Digest, March 17 2013: dangerous precedent (FaithMightFX)