fbpx

Commodities Still Strong Against Sterling

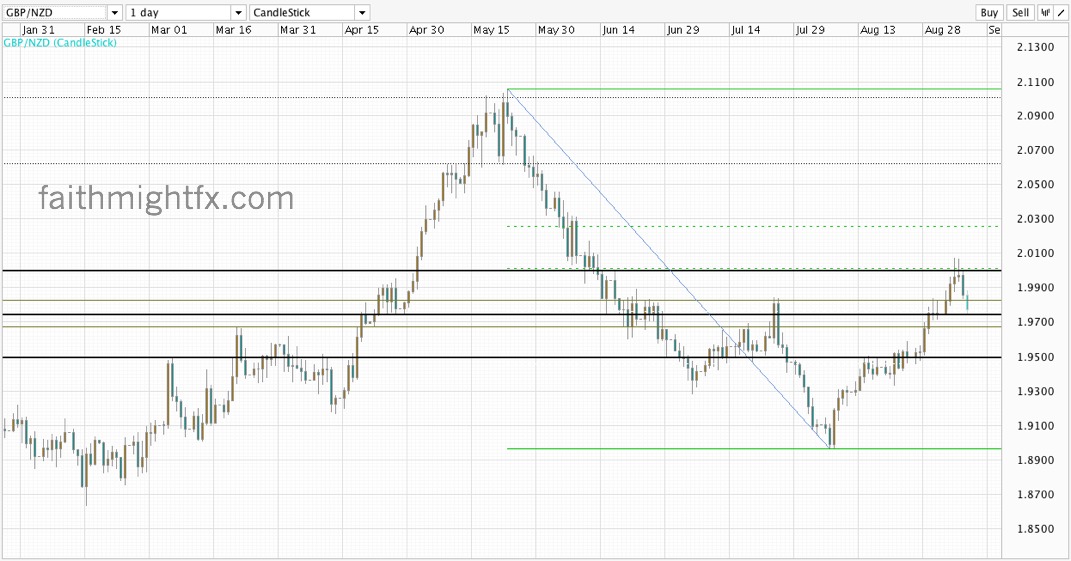
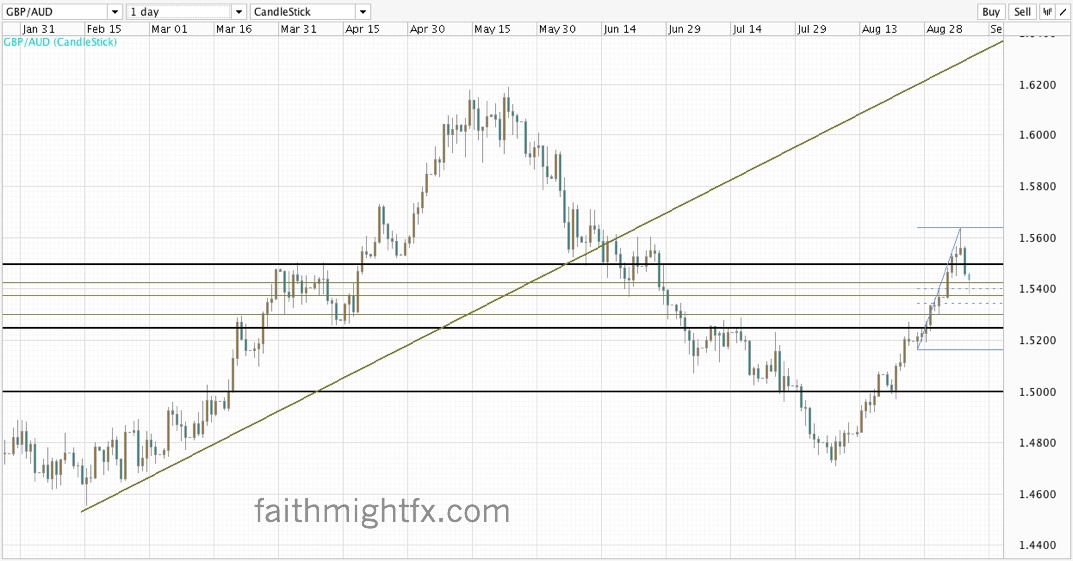
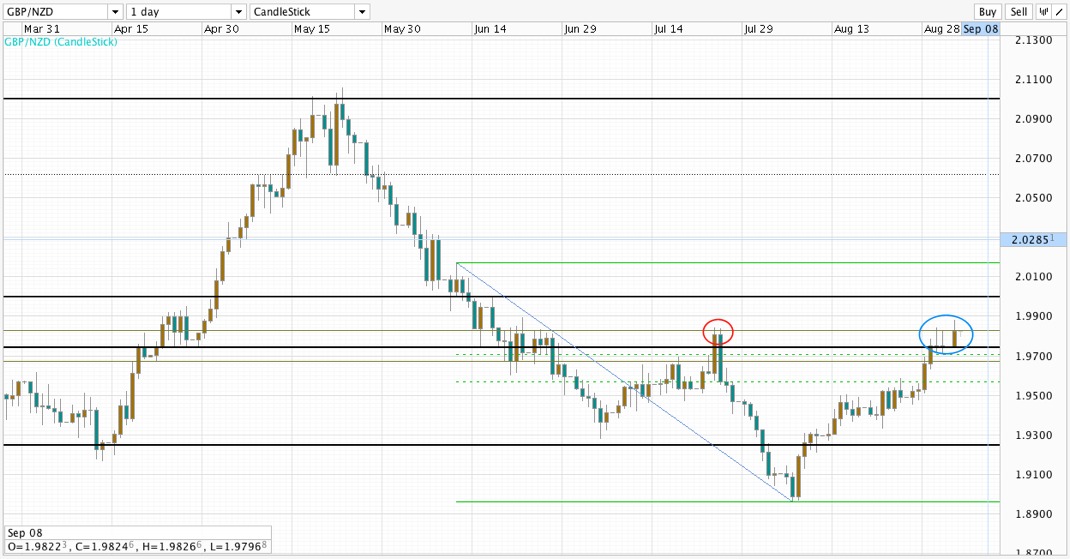
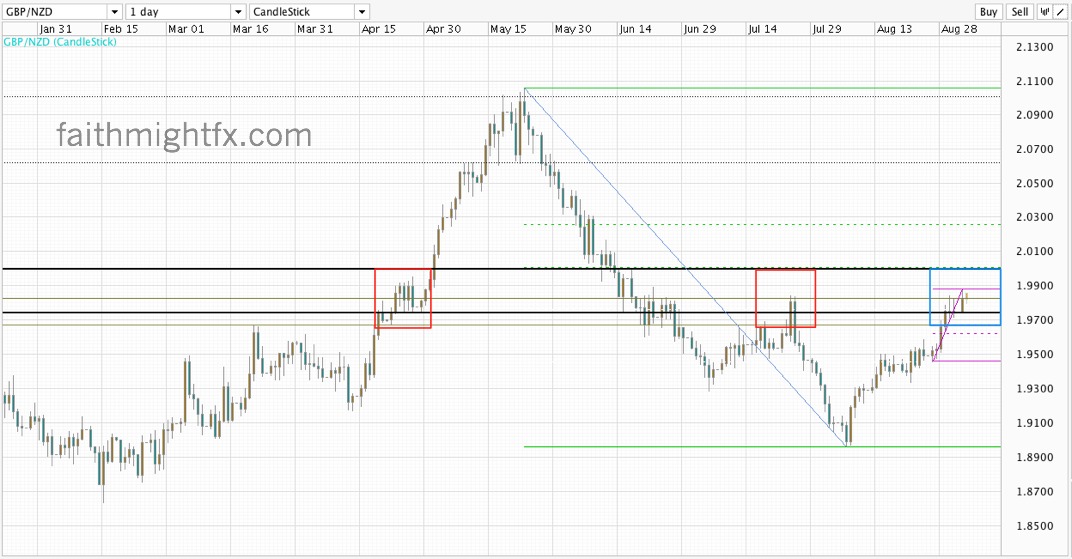
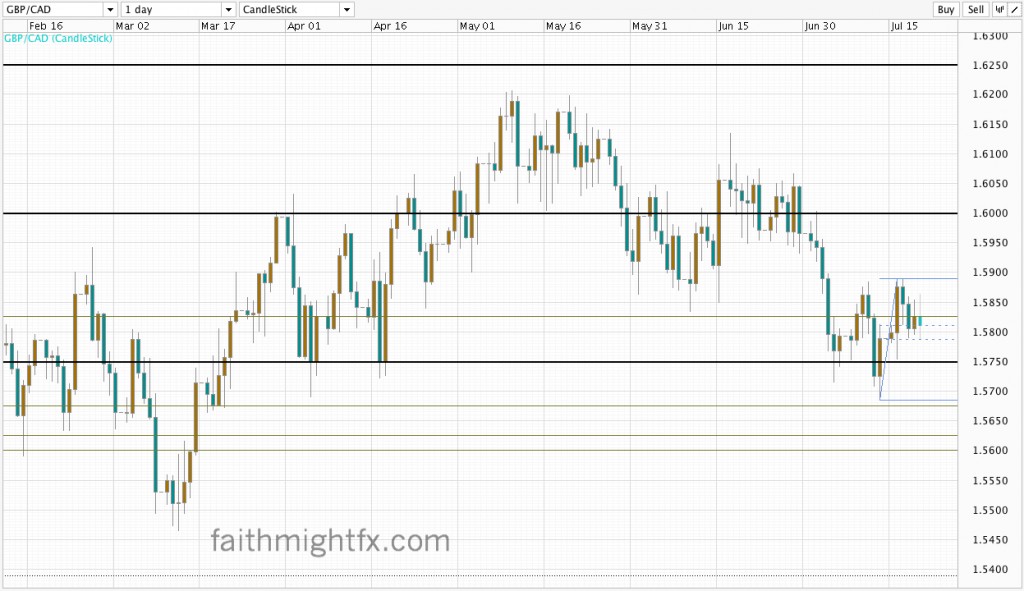
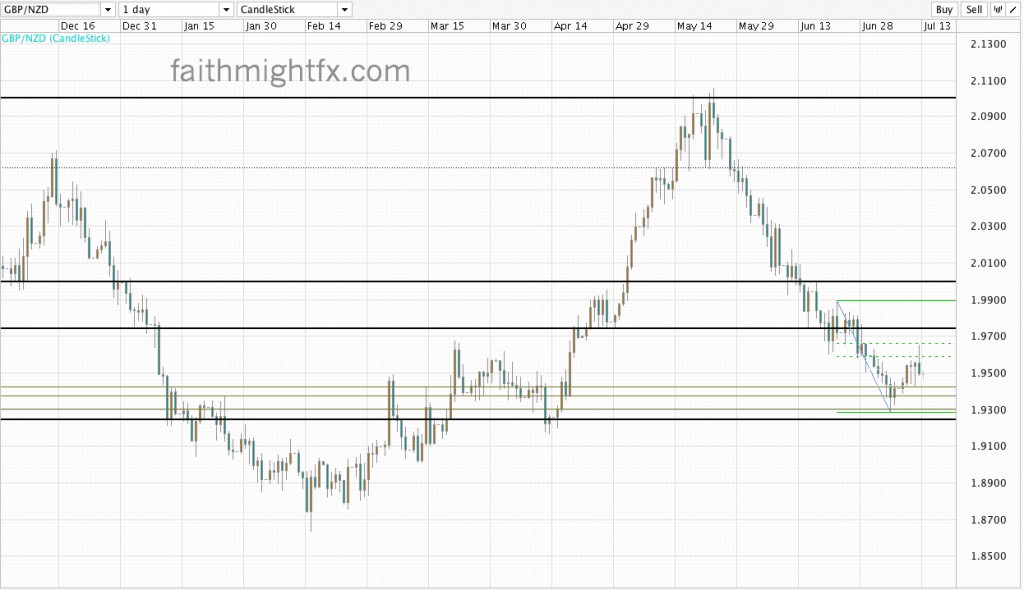
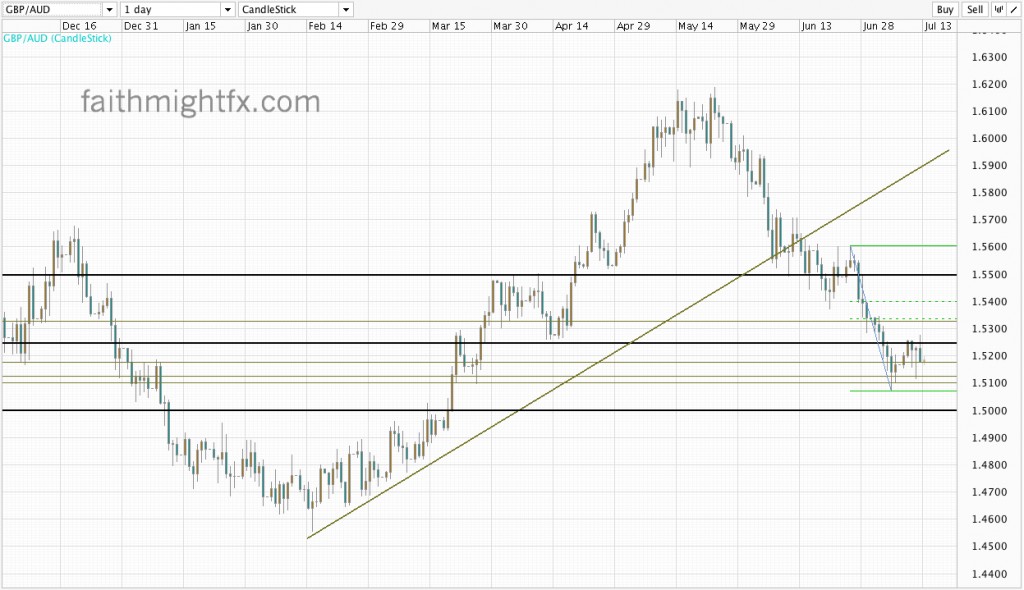
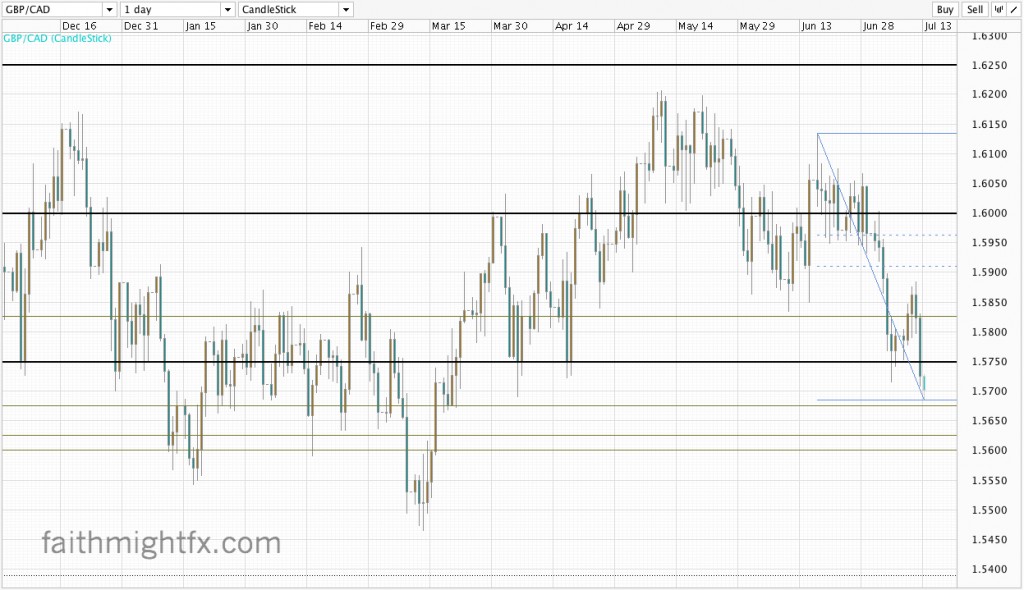
BoE easing and QE increases have been dovish for sterling. $GBPNZD and $GBPAUD have staged reversals that has dragged the $GBPCAD right along with it. The GBP breakout against the commodity dollars in the Q1 of this year was all but undone during Q2.

GBPNZD DAILY CHART
Breaks 1.95
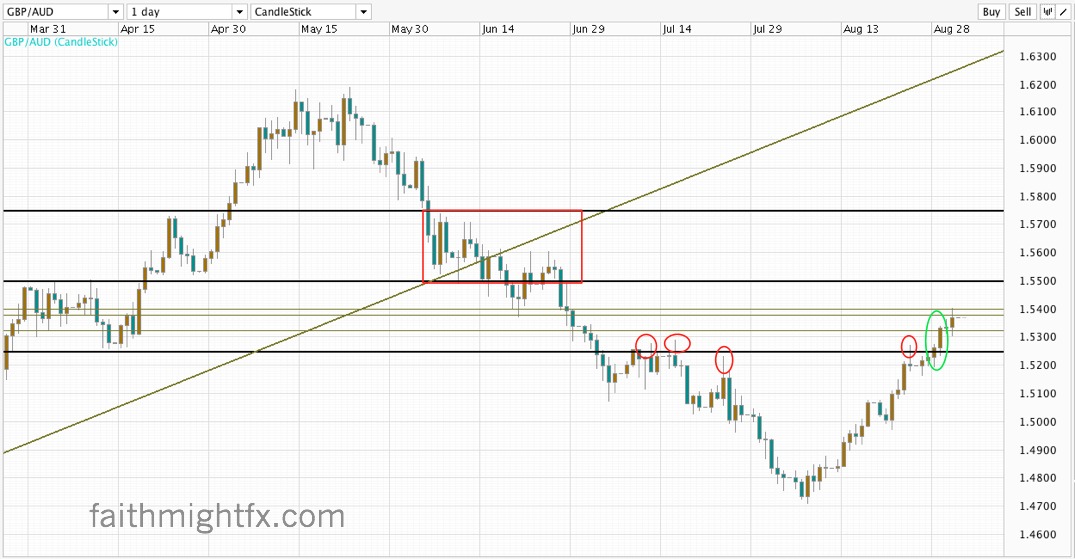
GBPAUD DAILY CHART
Breaks 1.5250
GBPCAD DAILY CHART
Breaks 1.5750

After breaking key levels, all 3 pairs are at lows to end the week. No interest in new entries here. Watch for profit-taking to end the week but it is more likely that sellers will be holding their positions for new lows in the short term.

Despite the current weakness in commodities versus the US dollar, the rally in the commodity dollars versus sterling continues to advance. It seems to me that commodities bears shouldn’t get too comfortable. While the USD is likely benefiting from an on-hold Fed while other central banks are cutting rates, commodities may find strength again when the Fed does also move on monetary policy. And the China and global slowdown theory is overblown. While China rates are lower-than-expected, 7% growth in an economy is still ridiculously fantastic. Especially when there is no growth in the UK and only 1.9% in the US. China and other fast-growing economies will likely continue to demand commodities at decent rates to keep prices ultimately higher. Food prices around the world are still very high even as oil dropped nicely. When commodities finally turn and rally again versus the USD, it is more likely that the current bear trend in $GBPNZD, $GBPAUD, $GBPCAD will only steepen and continue the mid term bear trend.

GBP/USD Sets Up

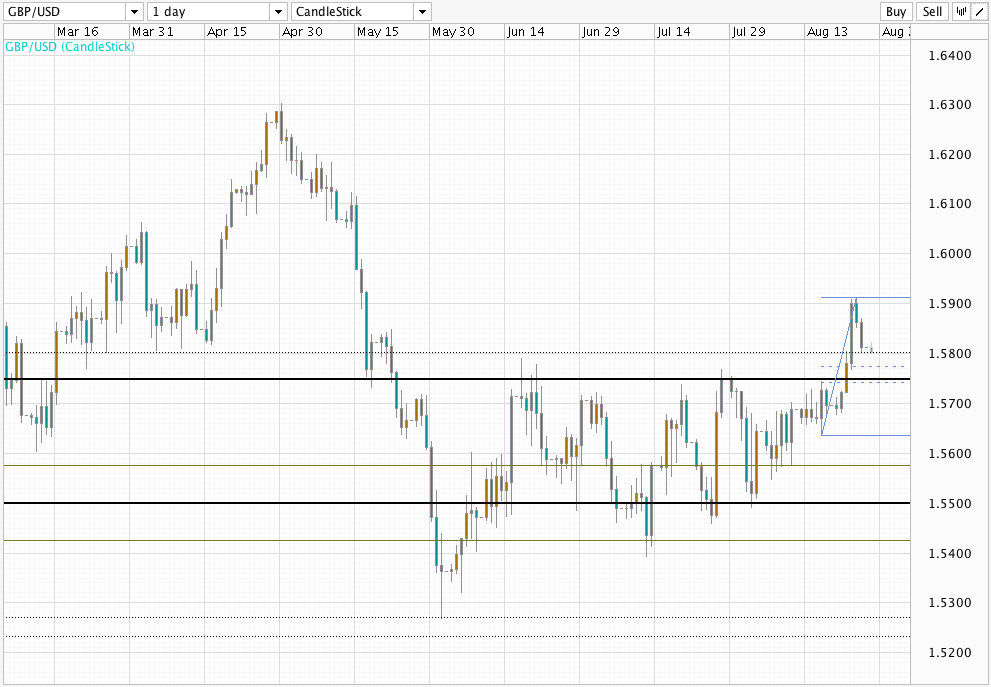
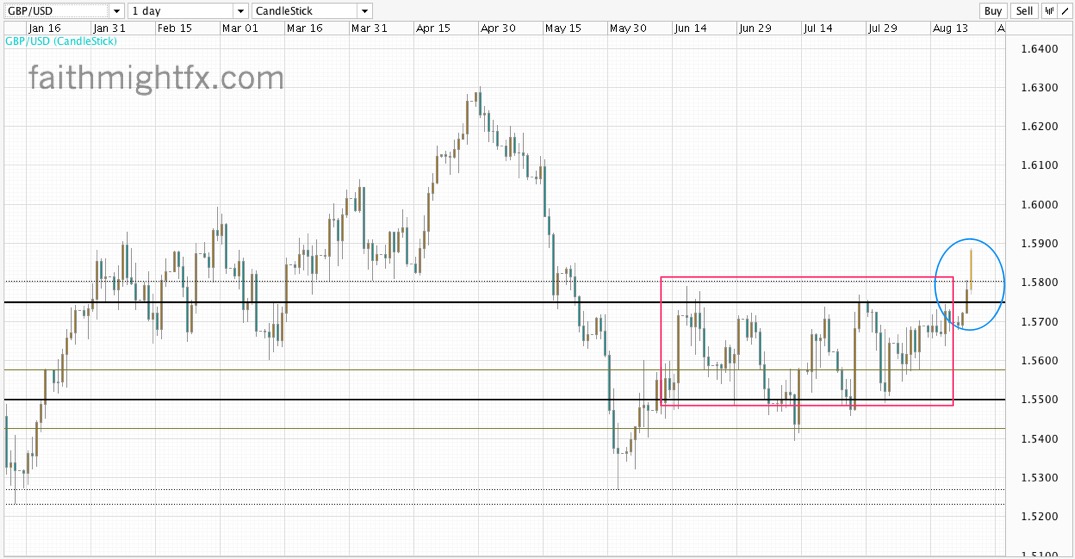
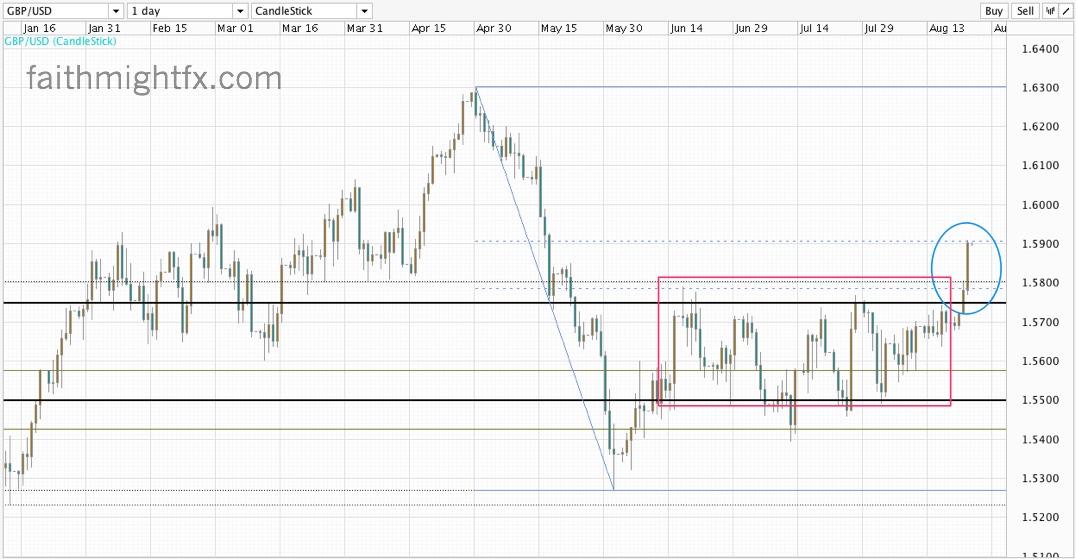
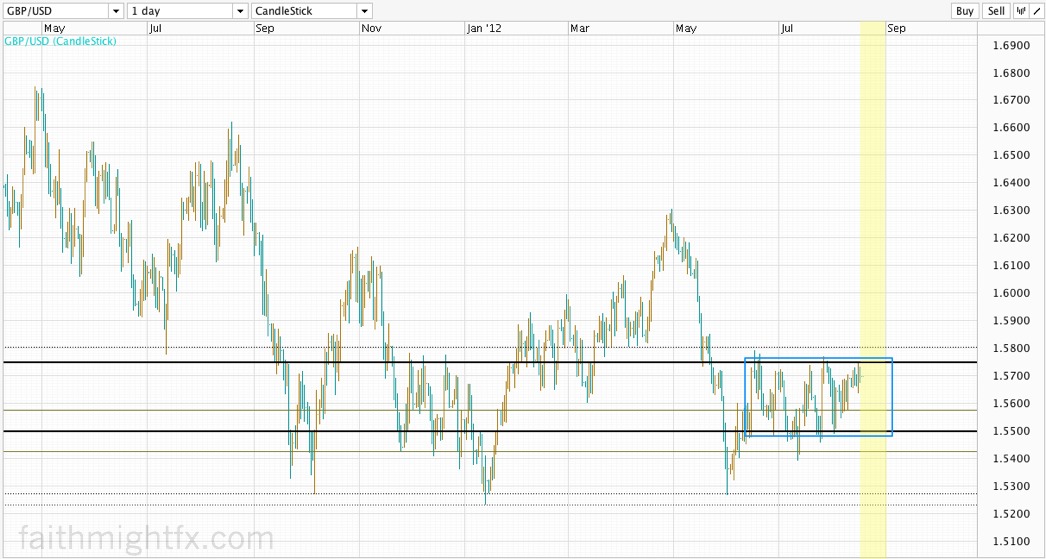
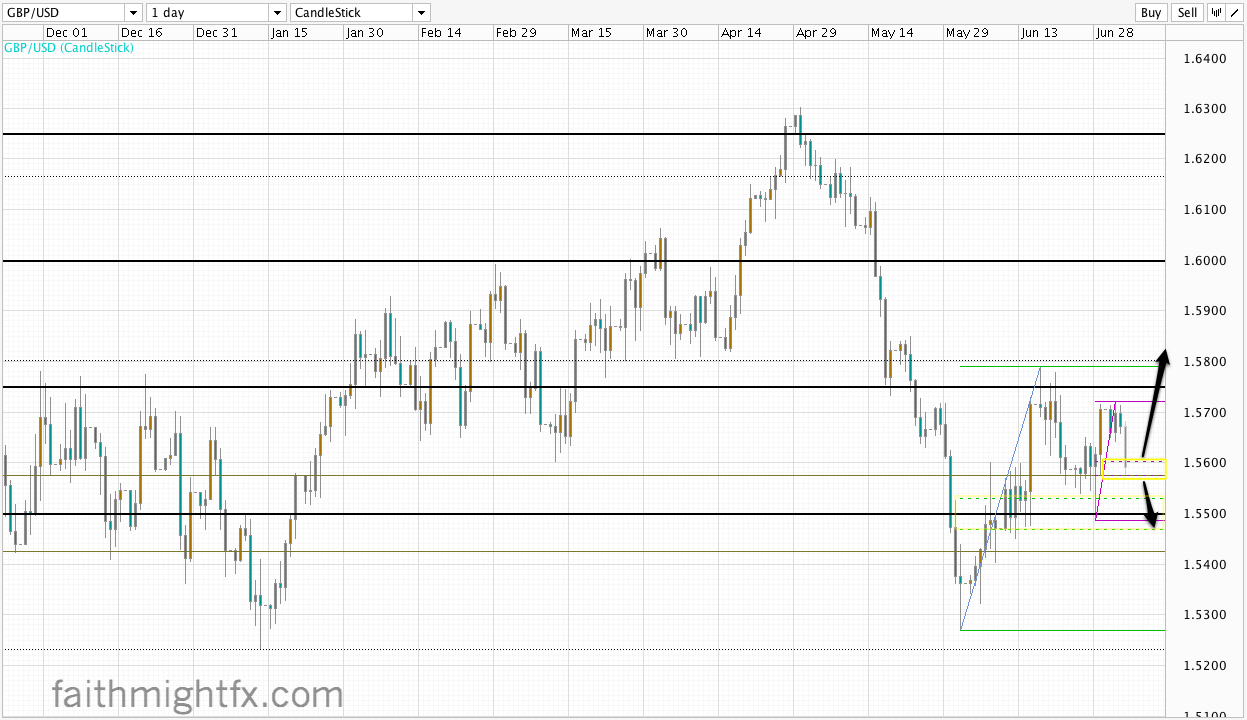
Cable is setting up ahead of the Bank of England decision tomorrow and Friday’s US jobs report. Both releases have impact on both sides of this currency pair so I always find it interesting to look at where the pair trades ahead of these back-to-back releases. Despite the overshoot break below 1.5500, the 61.8% Fib held to see cable rally back to 1.5700. With price exhausting at the whole number, a weak sterling has taken $GBPUSD lower into the zone between 1.5575 and 1.5600. This move lower technically gives bulls a nice buying opportunity. However given the event risk over the next 2 days, traders should assess their risk accordingly ahead of the BoE and NFP.

GBPUSD daily chart

If cable closes the week above 1.5500, the pair remains bullish and favors a move back into the major 1.5800 support-turned-resistance level. A move into 1.5500 still remains a buying opportunity unless $GBPUSD closes out the week below the major psychological level. At current levels, it is still all about 1.5500.

Summer Season

Spring was hectic. This year I was School Site Council Chair, PTA Secretary, and a GATE parent volunteer. I managed to teach 2 classes at the art college. The big kids eeked out 2 activites each over the course of 3 months. The baby started school for the very first time complete with her first extracurricular activity too. Hubby and I did a high five after the last ballet recital. The school year is officially over! So happy for the kids because it has been a great year. Lots of growth in us this year.

I say all that because it’s no surprise that this hectic schedule has forced me to trade slow. Slow and deliberate. More so than I ever have. And I found that there is a peace in not rushing trades. Trades are now limit orders triggered by my rules. And once set, I am free to watch the market however I choose: at my computer, in a meeting, during the boy’s basketball practice or the girl’s art class.

The high-energy of active day trading has very little appeal anymore. Instead, checking price becomes a check on the chart rather than a check on my trades. That subtly in grammar is also the subtly in psychology that has really helped my trading. The chart is a 3rd person. My trade is very personal and very 1st person. Personal matters tend to be emotional whereas we can all can detach from a 3rd party’s issues because they are not our own. As a trader, markets work when it becomes less about me and more about it.

The timing of my slower trading is not lost on me. The kids are back home full time. The whirlwind of winding up a school year is one I more appreciate now as a teacher and parent than when I was a student. The seasons have changed and, quite naturally, my trading changed with it. Trading is certainly a marathon, not a sprint. If you are in it for the quick thrills you probably can’t stay at it long enough to truly be rewarded. The longer I do this the more I understand that. Now I have entered a season in which I am truly living that out.

TRADE SLOW — my new mantra.

Why I do what I do how I do it 🙂

Europe Contagion Hits Japan

chart of Japan trade balance with EU

Europe hit Japan right where it hurts – in the wallet – for the first time in 38 years. We all know that Europe is hell bent on carrying out austerity-driven policies. That drop in exports above is vicious. The following recovery has been tepid at best. It looks like the recession that has gripped Europe since 2009 is spreading beyond its borders.

As its second largest trading partner, Japan needs European business to help inflate its economy. Decreasing trade, however, leads to decreasing price hikes which leads to more deflation which equals a strong yen. Currencies from low-inflation countries are always in favor with investors. With $USDJPY around 80.00 and the $EURJPY having traded to record lows, the BoJ has quite a fight on their hands as Europe only gets worse still.

But who cares? Interesting chart, nonetheless.

Source: Reuters

A Pre-FOMC Look At Cable

cable daily chart

While the $GBPUSD has been bearish since tumbling from 1.63, it turned bullish when it climbed back above 1.5500 after putting in a higher low. This week opened with a 1st test of 1.5800 major support level with the high at 1.5790.

Now the market waits on the FOMC. QE3 is supposed to be revealed today. If so, cable will soar. Support at 1.5800 certainly sets the stage for a return to 1.6000. However, if the Fed decides to wait, the $GBPUSD may fall back towards 1.5500. A break below 1.55 would certainly have bears hoping for new lows below 1.5220.

Trade what you see!

Strong USD, Strong GBP

There is a new theme emerging with the USD BREAKOUT this week. Everything is weak against USD. $GBPUSD has fallen over 650 pips in 4 weeks. It ended last week on a technical break of the 61.8% Fibonacci retracement level of its entire rally off the January 2012 lows. That was the last defense for bulls though their case was lost with price action below 1.60 for 2 weeks now. However bearish cable may be this does not at all roll neatly into a weak sterling story.

On the contrary, sterling is killing almost everything else. GBP is at multi-year highs against the euro. No secret there as to why. But the commodity dollars are also weakening tremendously against sterling on broad-based weakness in commodities. The strong USD combined with slowing Chinese growth is looking to make commodity weakness a new trend in the short-term.

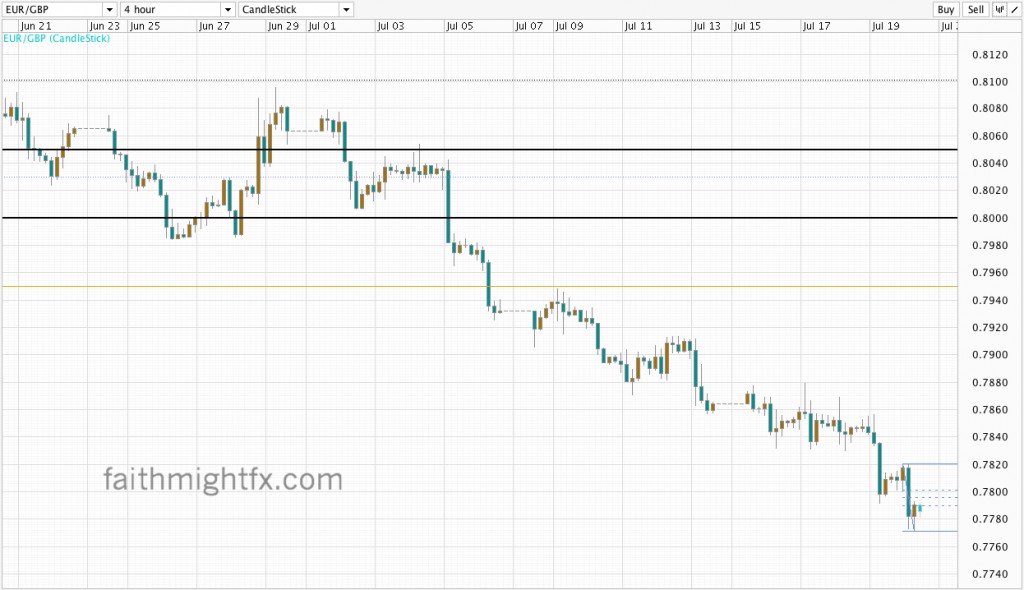
When trading these markets, timing is crucial. The reason for the choppy consolidation around 1.60 in $GBPAUD and $GBPCAD is due to the sterling weakness in $GBPUSD and general GBP strength in $EURGBP and $GBPNZD. The EURGBP close below 0.80 signals more GBP strength; even as the $GBPUSD close below 1.5750 signals more GBP weakness there. The correlation is ironic. But price action is truth. The strong USD — strong GBP theme bears paying attention to as we head into summer trading.

1.60 The Big Figure

60 Yonge Street
The Bigga Figure

The market loves magic numbers. And the one on radar is 1.60. GBP is dealing with 1.60 on 3 currency pairs that I follow. This is quite uncanny and ironic but maybe not so much coincidence. $GBPUSD, $GBPAUD, $GBPCAD is a strong dollar bloc. Their breakouts above 1.60 marked technical reversals across this bloc to new yearly highs. But this week’s breaks below 1.60 looks to undo all of that.

Looking back a year at $GBPUSD reveals that a break below 1.60 after breakout above only points to more weakness. What started as a correction has already turned to a reversal in the $GBPUSD today. @EdMatts did a great video explanation so good it was highlighted twice in the Sterling Digest.

$GBPAUD hasn’t held up in the past when it broke below 1.60 after new highs. Where it has held, price rallied for hundreds of pips before topping out.

GBPAUD daily chart

So now look at the $GPBCAD. It is still holding up as today’s low at 1.6003 is ahead of the big figure even if only by pips. It then bounced over 120 pips to settle at 1.6100 (as of this writing). A close above 1.60 keeps the pair bolstered for a rally higher. But with lower highs on the daily chart, a rally to met by sellers until buyers can prove themselves with new highs.

GBPCAD daily

Nonetheless suffice it to say that 1.60 is a serious psychological level for sterling at the moment. Trade what you see!

Image credit

Exit The Euro

Chart: the deleveraging process is desynchronized and heterogeneous

It has to be a very scary thing when your banks, companies, households and even governments can’t pay down its debt. Can a currency be made worthless based on its debt load in a world where money is electronic and can be minted with a push of a button? We just may soon find out. Exit the euro.

Beware Trade Tips

Especially when it comes from Goldman Sachs:

The mighty Goldman Sachs has apparently recommended selling EUR/GBP at 0.8210/20 with a tight stop of 0.8250 and targeting a move back down to 0.8150/60

Since Goldman Sachs wants to make trade recommendations, why don’t we all make some? Here is mine:

GOLDMAN SACHS IS LONG EUR.

Do what you will.


screen shot of my twitter stream at 2:20ish am pacific time
I LOVE my Twitter stream


Source: Trade Recommendation… (Forex Live)

Enter The Chaos Index

the Chaos Index
Is this for real?!

Apparently, there are more riots and protests against the goverment in countries with poor or declining economies. In fact,

The strong link between unrest and austerity suggests that cutting expenditures in times of crisis may be even harder than previously thought…To avoid the spectre of default and a downward spiral of collapsing output, lower tax revenue, and a rising wave of unrest – an austerity trap – governments have to act more cautiously in good times. They need to borrow less and keep taxes high even if public debt is falling in a period of expansion.

This is hardly news. As long as credit rating agencies rule the world, governments are more interested in pleasing them as opposed to its own citizens. Expect more Arab Springs and Occupys as food and energy prices rise with unemployment in countries with strict austerity measures. And the markets won’t be forgiving. Look no further than Europe.


Source: This Chart Predicts Rising Violence And Unrest Around The World (Business Insider)