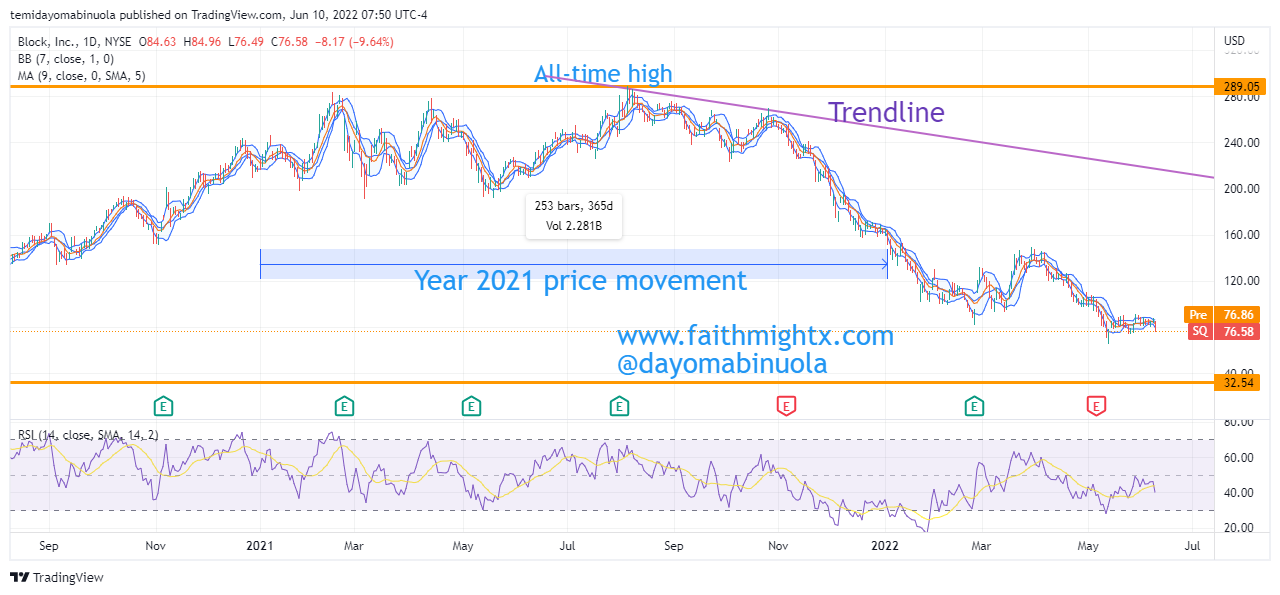
fbpx

Bitcoin Drops To A New 2022 Low At $32,670

Bitcoin opened in 2022 at $46,196. At the end of January 1st, 2022, Bitcoin closed at $47,795. This price is the highest that Bitcoin closed for this year. Since the second day of the year 2022, the bears have been aggressive toward the Crypto king. In the last week of March 2022, the price rallied above the $48,000 psychological level but the price still maintained the highest close of the year at $47,795. While this rally was building up, the bears snuffed out the steam that was brewing in the bulls and dragged the price further downwards. 

Daily Chart

Back in 2021, the price of Bitcoin hit an all-time high of $69,000 in November 2021. Many investors and potential investors were looking forward to investing more at this point as analysts all over the world were forecasting a strong bullish run. But to their greatest surprise (and disappointment), Bitcoin’s bulls couldn’t hold the reins for long and the price began a descent that would last for the next three months. Candlesticks in November 2021, December 2021, and January 2022 all closed on bearish notes.

Earlier in 2021, El Salvador adopted Bitcoin as a legal tender and many analysts were optimistic of Bitcoin’s price reaching $100,000 as they expected other countries to follow in El Salvador’s footsteps. On October 12, 2021, we published an article on the dangers of Bull & Bear Traps. On that day, the price was $57,200. We made a forecast that Bitcoin’s price could go below $30,000. On November 19, 2021, following analysts’ forecast that Bitcoin could hit $100,000, we published another article reinstating our bearish stance. On that day when we published the article, the price was $58,229. Our analysts, however, were confident in the forecast that was made and we stuck to our prediction.

Weekly Chart

At the beginning of May, Bitcoin opened at $37,664 to reach May’s high of $40,000. But the past 7 days have been in favor of the bears and BTC has dipped below $33,000 making it hit the lowest point of the year at $32,670. Bitcoin’s current move is in perfect alignment with our forecast for Q4 2021 and we still stick to the call that BTC will go below $30,000.

Some of these ideas are in our clients’ portfolios. To understand if this one can work for you or for help to invest your own wealth, talk to our advisors at FM Capital Group. Would you like more information on how to get stocks in your portfolio? Schedule a meeting with us here.

UNCHARTED Podcast: Episode 4

CRYPTOCURRENCY: An overview of the Crypto market
CRYPTOCURRENCY: Analysis of Bitcoin & Ethereum

In this podcast episode, we did a general review of markets. First, we extensively discussed Cryptocurrencies. We looked into Bitcoin and Ethereum and the recent stagnation. We also did a forecast of the direction that these major Cryptos may move in the coming months. We touched on Solana and the impact Bitcoin has on all cryptocurrencies. Here’s a forecast on Bitcoin we made some months back.

CURRENCIES: The Impressive Run of the US Dollar and how Risk-Aversion is contributing to it
CURRENCIES: Depreciation of world currencies and their reliance on the USD
CURRENCIES: US Dollar as a Safe Haven, GBPUSD, & NZDUSD
CURRENCIES: Possible causes for USD rise and Inflation
CURRENCIES: US Economic Strength and quarter-over-quarter GDP growth
CURRENCIES: Recession Fears & USDJPY

We also took a dive into the world of Currencies, specifically the United States Dollar. The Dollar has been dominating the world of currencies. Despite inflation rates being sky high, the Dollar seems to be doing relatively well when compared with other major currencies. We also discussed the Central Banks and their reactions to the inflation their respective countries face.

COMMODITIES: An overview of Gold & Silver
COMMODITIES: USD vs Gold, which is the Safe Haven of Choice?

We closed this episode on Commodities. During times of crisis, it is expected that people will hedge their funds in Precious Metals but this isn’t what we are seeing. Investors are hedging their funds in USD and investors from emerging markets also see USD as a safe haven as opposed to Gold and Silver.

Some of these ideas are in our clients’ portfolios. To understand if this one can work for you or for help to invest your own wealth, talk to our advisors at FM Capital Group. Would you like more information on how to get stocks in your portfolio? Schedule a meeting with us here.

Coinbase Share Price On A Catastrophic Descent

Coinbase was one of the most promising stocks of 2021 because right on the first day it launched on NASDAQ, its share price shot from $379 to $428 in less than 24 hours. This price rise led many investors to buy into Coinbase as they expected the price to keep up the bullish momentum. However, it seems fortune was not on the side of Coinbase after all. 

Weekly Chart

For the first 6 weeks post-IPO in April 2021, the price began its descent, but investors didn’t worry. The price then began to range from that time until October 2021. At the end of October 2021, the price closed at $318. Afterward, the price began a long-awaited rally that pushed the price to $368. But this price will end up becoming the high in Q4 2021. Since then, Coinbase’s price has been remarkably bearish. Despite being the month of its high, November managed to close on a bearish note. The months that followed – from December 2021 to April 2022 – have all closed with a bearish candlestick.

Daily Chart

As mentioned earlier, Coinbase’s price has been majorly bearish since the end of the IPO day on April 14, 2021. All investors that bought Coinbase post-IPO day are at a loss, and the loss seems to be getting worse by the day as the price plunges to the $100 psychological level. RSI indicates an oversold position on the daily and weekly time frames which could be an indication of a possible rally. Our analysts look forward to the formation of an inverted head and shoulder pattern on the charts. If this happens, bulls can pick up some steam and push the price above $200.

Some of these ideas are in our clients’ portfolios. To understand if this one can work for you or for help to invest your own wealth, talk to our advisors at FM Capital Group. Would you like more information on how to get stocks in your portfolio? Schedule a meeting with us here.

A False Surge On Dogecoin

Dogecoin is an open-source cryptocurrency that was started in 2013 by Jackson Palmer and Billy Markus. Dogecoin was created as a “joke” by these two software engineers in a bid to make fun of the wild speculation of cryptocurrencies at the time. This is partly the reason why it is considered to be the first “meme coin”. Dogecoin was launched at an initial price of $0.0005588. 

Daily Chart

Currently, the market cap for Dogecoin is $18.13billion while the average daily transaction is over $1billion. One of the biggest investors of DogeCoin is Elon Musk. Dogecoin had little volatility since 2014 and it stayed below the resistance of 0.0188. In January 2021, there was a breakout to the upside and the price continued to rally for about 5 months till it reached its all-time high in May 2021 at 0.7612. Ever since this all-time high was attained, the price of Dogecoin has continued to fall. The support level for the year 2022 sits at 0.1097. 

RSI shows that price has been overbought on the daily timeframe. Just recently, as a result of the takeover of Twitter by Tesla’s boss and richest man in the world, Elon Musk, the price of Dogecoin rallied mainly due to the fact that Elon holds a substantial amount of Dogecoin. The previous rallies of Dogecoin in the past have been attributed to Elon’s tweet and there have been speculations that Twitter might integrate Dogecoin as one of the acceptable currencies for transactions. 

Weekly Chart

Dogecoin rallied by 20% on Monday, 25th of April, 2022 as a result of the Twitter buyout. But this spike was short-lived as the price dipped to 0.1366. Our analysts don’t see the price of Dogecoin appreciating soon because Bitcoin as the “King of Cryptos” has a way of influencing other cryptocurrencies. Bitcoin has failed to rally in recent times and has not been able to break the $50,000 psychological level to the upside as the bears have been more dominant.

Some of these ideas are in our clients’ portfolios. To understand if this one can work for you or for help to invest your own wealth, talk to our advisors at FM Capital Group. Would you like more information on how to get crypto-currencies in your portfolio? Schedule a meeting with us here.

Dow Jones Falls Below $34,000 Psychological Level

Dow Jones experienced a comeback rally after the global lockdown of 2020 was eased. As of January 2020, the price of Dow Jones was at $21,618. Price was able to reach a new all-time high on January 5, 2022, at $36,991 which was close to the $37,000 psychological level. Ever since this year’s high was reached in January, Dow Jones bears have been aggressively active. Attempts by the bulls to push the price higher have been overpowered by the bears.

Daily Chart

This year’s support currently stands at $32,296 which is over $4,500 lower than the all-time high. In March 2022, the price rallied to $35,368 which was March’s high. After March’s high, the bulls couldn’t push the price further upward as the bears seized back the momentum and caused the price to dip to $33,103. However, the price has risen a bit and is currently at $33,301.

Weekly Chart

RSI on two different occasions has shown that the price has been oversold on the daily timeframe. Despite these indications, the bulls have failed to push the price above $36,000. However, our analysts forecast that the bulls in a couple of weeks might manage to push the price to $35,000 and even beyond.

Some of these ideas are in our clients’ portfolios. To understand if this one can work for you or for help to invest your own wealth, talk to our advisors at FM Capital Group. Would you like more information on how to get stock indices in your portfolio? Schedule a meeting with us here.

Netflix To Rally Despite Sudden Price Dip

Netflix reached its all-time high at $701 in November 2021. Since then, the price has plummeted dramatically over the last 5-6 months. This huge slump has taken the price to $218, making it the worst fall ever. This fall is about a 70% loss from the all-time high of $701. As a result of the price fall, Netflix investors are yet to make a profit this year.

Daily Chart

On the daily chart, a gap down occurred on January 21, 2022, from $507 to $399 and the price is yet to retrace. In the process of the price falling during this gap down, it hit a target we forecasted in an article we published in August 2021. Another gap down occurred on the daily chart on April 20, 2022, from $333 to $246. As of April 21, 2022, the price closed at $218 as a consequence of this last gap down, thereby making $218 the most recent support. Price last hit this point in January 2018.

Weekly Chart

In the last few days, $NFLX reported a loss of over 200,000 subscribers in Q1 2022. There are speculations that Netflix will lose over 2million customers in Q2 2022. Despite speculations, we foresee a price rally and we expect both gap-downs to be filled. This price rally should take the price to $387.

Some of these ideas are in our clients’ portfolios. To understand if this one can work for you or for help to invest your own wealth, talk to our advisors at FM Capital Group. Would you like more information on how to get stocks in your portfolio? Schedule a meeting with us here.

DRIVEME: Our 1st Investment in 2022

DriveMe Technologies is an EduTech startup out of Nigeria. Though they are formally classified as a EduTech company, they really are positioned to push the frontiers of the transportation and logistics sector in Nigeria, and Africa at large. Skilled drivers are a rare commodity within the transportation sector in Nigeria. Lack of driver’s education and skills is the number one reason for vehicle accidents in Nigeria. There has long been no requirement (or at the very least, little enforcement) of the requirements put in place for formal drivers’ education before obtaining a license. This has resulted in 35% of driving-related accidents in the world occurring in Africa. Drivers simply don’t know the traffic rules and they become a danger to themselves and other commuters.

Many firms in the logistics sector have to rely on under-educated drivers and when accidents happen these firms find themselves in positions where they have to cough up millions of Naira in damages and business losses. Not too mention the hit on their reputation. These organizations and business owners are in dire need of formally educated and skilled drivers but seeing that this is not their area of competency, they also find themselves struggling with what the right curriculum should be and keeping up with the driving laws. They are left with little or no choice but to hire and fire which inevitably leads to high turnover. High turnover is a huge cost to the business and it further squeezes already small profit margins. Therefore, there is a huge incentive for businesses who are reliant on drivers to find a solution to having high-quality drivers. This is where DriveMe comes in.

DriveMe uses technology to deliver high-quality, up-to-date drivers’ education in Nigeria. They are an accredited driving school educating drivers of all levels: from the novices to the veteran drivers, DriveMe covers all their drivers’ education needs. In recent months, driving laws have changed in Nigeria making drivers’ education mandatory. This is what really attracted us to DriveMe because it is not just supplying drivers’ education solutions. There is a ready demand.

Looking at the demand side, drivers are able to list their services on the DriveMe platform. They have the benefit of being educated on the platform while also having exposure to potential clients and employers who are in search of high-quality drivers. In that respect, DriveMe also acts as a matching platform that provides job opportunities for drivers.

Another perk of onsite due diligence is SWAG!!

DriveMe is one of the first investments that I was fortunate enough to visit onsite (physically) in Nigeria during our Due Diligence process. It is not uncommon for angel investors to deploy capital into startups/companies we have not “physically” met. In this age of teleconferencing, physical on-site meetings have become less of a requirement in order to make a good investment decision. However, nothing can replace a physical meeting and it was a pleasure to meet Dami and Charlotte Odunlade at the DriveMe offices in Lekki, Lagos. We got to meet some of their students and spend time with their staff. We spoke with Dami and Charlotte in their offices discussing their long-term vision and current operational successes and challenges. Dayo and I walked away from that meeting confident that investors should make the investment in DriveMe. Even as virtual conferencing explodes all over the world, there will always be a place for in-person onsite meetings during Due Diligence and even post-check. In person meetings remain invaluable.

We are glad to make the DriveMe investment. We trust the DriveMe team will continue to grow the business and exceed their near term milestones!

The USD Continues Gaining Against The EUR

EURUSD opened in the year 2022 at 1.13695. All through 2021, EURUSD was majorly bearish with 8 out of 12 of the monthly candlesticks being bearish. The pair continued its bearish run as it entered 2022 and found support at 1.07574. 

4hr Time Frame

Despite the continuous fall, there have been a few times when the bulls tried to trigger a rally. However, each time this happens, the bears overpower the bulls and send the price further downwards. On the 4-Hour timeframe, the price has indicated oversold positions since the first week of April. Despite this indication, the bears are still dipping the price of EURUSD. 

Daily Chart

There are indications that the price could rally, against the current odds, to 1.11542 as the price recovers in the coming weeks. Currently, the price has crossed over to the upper region of the Bollinger Bands which could be an indication of the next bullish run.

Some of these ideas are in our clients’ portfolios. To understand if this one can work for you or for help to invest your own wealth, talk to our advisors at FM Capital Group. Would you like more information on how to get currencies in your portfolio? Schedule a meeting with us here.

Procter & Gamble To maintain Bullish Trend

The consumer goods giant has been listed on the NYSE for over 40 years and has accrued huge gains over the decades. Looking at the monthly charts since the IPO, there have been several higher lows and higher highs which is a fundamental characteristic of a bull market. Analyzing the monthly chart, there have never been indications on the RSI that the price has been oversold.

Monthly Chart

Generically speaking, fast-moving consumer goods are low-cost and often affordable which typically makes FMCG companies record-high revenues. Also, consumer goods are products that the population “consumes” and uses up very fast hence the name “fast-moving”. This makes consumer goods sell very quickly and inevitably increases the revenue made by the FMCG companies. Since 1978, the world’s population has increased by over 3 billion people. This data corroborates the success of FMCG firms particularly a firm like P&G which has been in the industry for decades and is considered a global leader in the FMCG industry.

Like other stocks, $PG experienced a fall in 2020 as the price moved from the pre-Covid price of $128 to $94 during the lockdown. Post-Covid price was able to rise to a new all-time high in December 2021 at $164. But then, it rose again to another new all-time high at $165 in January 2022. After this all-time high in January 2022, the price fell to $142 in March 2022 which currently serves as the year’s support. 

Daily Chart

Price has been able to bounce from the support to the current price at $160. This rally is expected to continue and the price could break out of the current resistance level at $165 which will invariably lead to a new all-time high.

Some of these ideas are in our clients’ portfolios. To understand if this one can work for you or for help to invest your own wealth, talk to our advisors at FM Capital Group. Would you like more information on how to get stocks in your portfolio? Schedule a meeting with us here.

Investors To See Share Price Increase As Delta Airlines Makes New Policy

Since Delta Airlines hit its all-time high in July 2019 at $63, the bears have been significantly active as price plummeted to $17 in May 2020. The global lockdown played a huge role in this nosedive as it did for other airlines like Virgin Atlantic and Southwest Airlines. Following the global roll-out of vaccines and the subsequent ease of the lockdown in the last quarter of 2020, the $DAL share price got a reasonable boost that pushed the price above $50.

Weekly Chart

Recently, Delta Airlines announced a New Policy Shift that was targeted at easing travel fares for flights with high price tags. This loyalty program was run all through 2021 and still continued this year but it was meant to be temporary. However, the airline has now announced that the benefits from this loyalty scheme will become permanent. According to the announcement, Delta Airlines will be the first airline in the industry to announce this type of benefit.

Daily Chart

This year, the resistance for $DAL has been maintained at $45.20 while the support level is at $29.84. This new policy is expected to influence the movement of the share price to the upside. Although there are several Dojis in the upper region of the Bollinger Bands, the bulls could steal the trend and as a result, the price could rally. This rally might push the price above $50 which is over a 35% increase from the current price of $37.

Some of these ideas are in our clients’ portfolios. To understand if this one can work for you or for help to invest your own wealth, talk to our advisors at FM Capital Group. Would you like more information on how to get stocks in your portfolio? Schedule a meeting with us here.